LINKUSDT - Breakout after an extended Period of Consolidation!!LINKUSDT (1D Chart) Technical analysis
LINKUSDT (1D Chart) Currently trading at $8.2
Buy level: Above $8.1
Stop loss: Below $7
TP1: $9.5
TP2: $12
TP3: $14
TP4: $18
Max Leverage 3x
Always keep Stop loss
Follow Our Tradingview Account for More Technical Analysis Updates, | Like, Share and Comment Your thoughts
Chainlink

Oracle potential correction is ON 🚨#usstock :: NYSE:ORCL
#dyor :: ORACLE
Present I am bearish 📍 on it 👍
I belive top is completed 📌
Now 35-45% potential drop we will see
Based on drop and pump 📌 we can decide macro top completed 📌 or not 🚫
Present my target is :: $80-90
( be in follow article under this post update will be provided )

LINKUSD reminding us of its glorious days.Chainlink (LINKUSD) smashed through our 8.000 target (and the Lower Highs) that we set on the September analysis (see chart below):
The price made a 17-month High, broke above the 1W MA100 (green trend-line) for the first time since the week of February 07 2022 and has essentially welcomed the new Bull Cycle as it's now above even the Bear Cycle's Lower Highs. The last Resistance standing is the 1W MA200 (orange trend-line), currently at 13.1636.
We have shifted our focus on the more long-term 1W time-frame as it allows us to compare LINK with the previous Cycle, at the time when the 1W RSI first turned overbought above 70.00 (as it has now). That was on the week of May 13 2019, on a strong 3-week rally (as currently), with the 1W MA50 (blue trend-line) turned into Support.
The rally didn't stop there but instead extended up to the 2.618 Fibonacci extension. There is no reason to expect a stop before at least $18.00, which is the March 2022 High. The 2.168 Fibonacci is a little over $20.00.
-------------------------------------------------------------------------------
** Please LIKE 👍, FOLLOW ✅, SHARE 🙌 and COMMENT ✍ if you enjoy this idea! Also share your ideas and charts in the comments section below! This is best way to keep it relevant, support us, keep the content here free and allow the idea to reach as many people as possible. **
-------------------------------------------------------------------------------
💸💸💸💸💸💸
👇 👇 👇 👇 👇 👇

W-Pattern Breakout to 12.50$ ?This is a simple pattern, a W-Pattern. Feel free to post your opinion below! I would love to see other charts or opinions. Hit the like button if you like my chart analysis. Would enjoy some more rep+ trying to be able to chat with people. Thanks for giving me the time of your day!

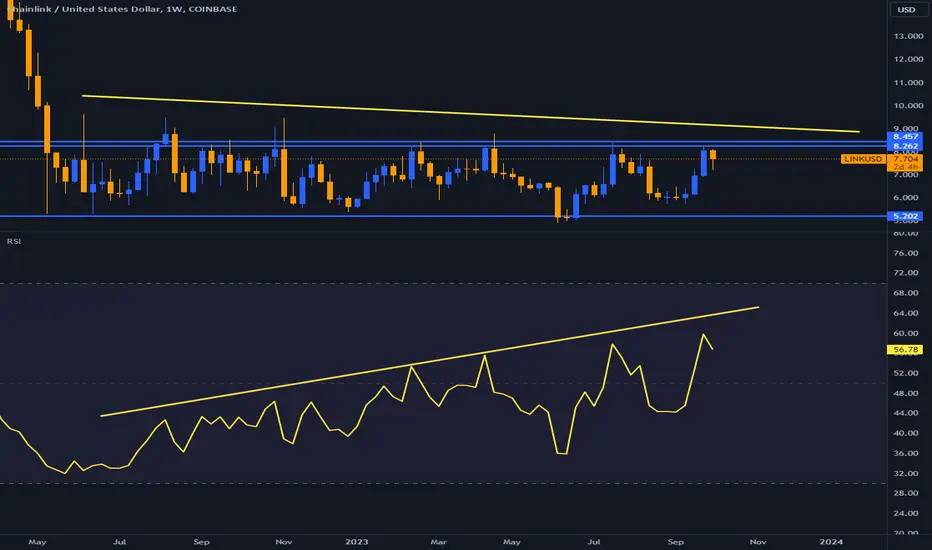
The key is whether the price can be maintained above 9.870Hello?
Hello traders!
If you "Follow" us, you can always get new information quickly.
Please also click “Boost”.
Have a good day.
-------------------------------------
(LINKUSDT chart)
(1M charts)
The key is whether it can rise above 15.13.
To do this, it is important to receive support around 11.236.
(1W chart)
The key is whether it can receive support in the 10.852-12.754 range and rise above 15.0.
If possible, I would like to see a movement that causes the HA-High indicator to fall and be created by shaking it up and down.
(1D chart)
The key is whether the price can be maintained above 9.870 and rise above 13.660-20.410.
--------------------------------------------------
- The big picture
The full-fledged upward trend is expected to begin when the price rises above 29K.
This is the section expected to be touched in the next bull market, 81K-95K.
-------------------------------------------------- -------------------------------------------
** All explanations are for reference only and do not guarantee profit or loss in investment.
** Trading volume is displayed as a candle body based on 10EMA.
How to display (in order from darkest to darkest)
More than 3 times the trading volume of 10EMA > 2.5 times > 2.0 times > 1.25 times > Trading volume below 10EMA
** Even if you know other people’s know-how, it takes a considerable amount of time to make it your own.
** This chart was created using my know-how.
---------------------------------
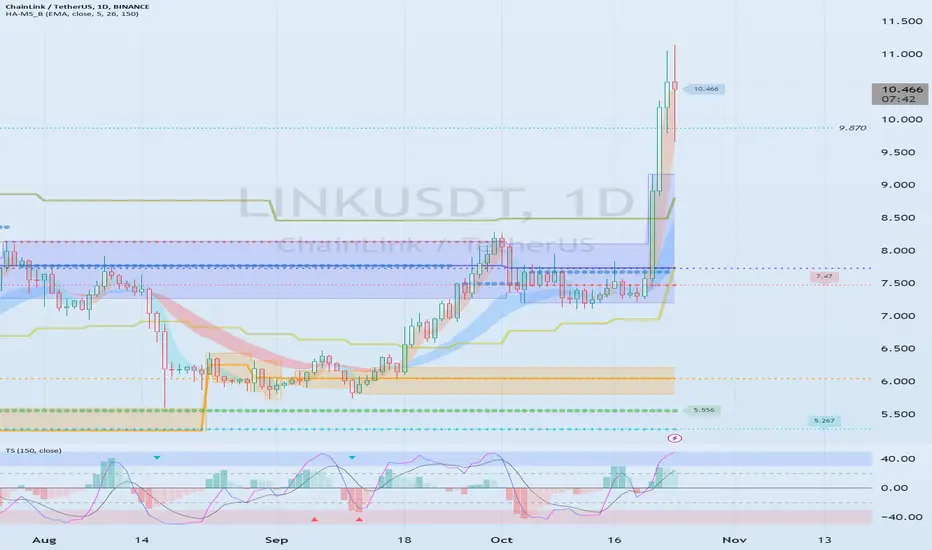
Chain [LINK] Surges 25% In Weekend Rally: What’s Behind This?In recent weeks, Chainlink has been generating significant attention. It has outperformed several other cryptocurrencies and consistently ranked as the top gainer over the past few weeks. Throughout the month, the coin had been trading within a narrow range. It has been fluctuating between $7.194 and $7.786. However, during the last week, LINK’s price exhibited substantial volatility, resulting in a remarkable 12% surge in just one day. This further signified a strong bullish sentiment in the market. Furthermore, the price has soared by more than 42% within a week, positioning it as the best-performing cryptocurrency of the week. After this recent price jump, LINK reached a yearly high of $11.037.
At present, LINK is trading at $10.48, reflecting a 12.5% daily price upswing. It’s important to highlight that in addition to the price increase, the network has seen a notable uptick in whale transactions, unique interacting addresses, and trading volume. These metrics have reached their highest levels in the past three months, marking a significant achievement for the network.
However, the situation underwent a swift transformation as Bithumb ceased its accumulation of LINK and transferred out 220,000 LINK tokens, equivalent to about $2.05 million. This move coincided with a noticeable drop in LINK’s price from its peak, underscoring the significant influence of exchange activities on the cryptocurrency’s market dynamics. A closer examination of LINK’s holders unveiled the participation of numerous influential whale addresses within the
LINK market. Some of these addresses had been accumulating LINK since February and began selling their holdings in October. Others had amassed substantial quantities of LINK from Binance, with their accumulation commencing in September. One standout whale, represented by 38 addresses, had procured 1.25 million LINK tokens at an average price of $7.58. These holdings translated into substantial profits, given the current market conditions. However, investors were advised to exercise caution, especially when whales decide to offload LINK in pursuit of profits.
Adding a twist to the story, Smart Money, an entity known for capitalizing on Chainlink’s price fluctuations, entered the fray. One wallet, in particular, capitalized on the opportunity to short LINK by selling 38,381 LINK tokens at $9. Subsequently, they borrowed 38,747 LINK tokens from Aave to sell at $9.5. This move further contributed to the intricate dynamics of LINK’s recent price movements.
Chainlink: New staking platform to further propel LINK’s price?
Chainlink is preparing to roll out a highly anticipated update in the form of Chainlink Stakingv0.2 later this year. The fresh staking platform is set to introduce a range of innovative elements to enrich the Chainlink ecosystem. The debut of Chainlink Staking v0.2 signifies a noteworthy progression in the evolution of Chainlink’s staking ecosystem. This release is poised to grant users a broader array of choices, bolstered security, and an overall more adaptable and versatile experience. It will be captivating to observe the reception of these features and their impact not only within the Chainlink community but also across the wider blockchain sphere.

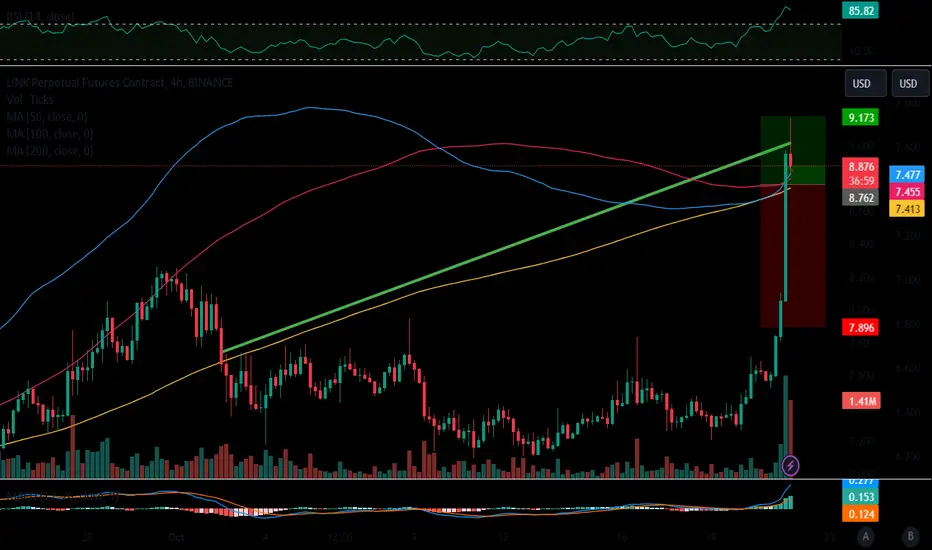
WHY IS LINK PUMPING TODAY?Why is Chainlink BINANCE:LINKUSDT pumping today?
Last month, I forecasted this coin on reach to a year-long resistance and to watch out for a potential breakout or pump in the upcoming weeks.
Now, BINANCE:LINKUSDT pumped because of a year-long breakout , that's 16 months to be exact.
What should we do next?
Scalping either long or short would be best in my opinion but be sure to have a setup for that strategy. For intraday traders, be patient for finding some possible bullish patterns (mini resistance breakouts, head and shoulders, cup and handle) as the coin is still in an uptrend. Take note, we can see retracements for the coin price, as the price would wait to be stable from the yearly breakout.
From a technical standpoint, I would rely on identifying a common resistance for a potential take profit area.
I find the $11,446 resistance line convincing since it presents strong support and could be a new resistance line for the coin (click the chart above for better quality) . Another would be at near $12 range, based on the fib retracement of .382 from its all-time high.
This would take possibly a week or more in order to reach that price that I've mentioned.
If you entered the breakout, congratulations! Now, you need to do set a protective stop profit in tranches.
Plot your support line because that will be a guide in taking partial stop profits. In this case, I would plot a diagonal support line. If a breakdown happens with confirmation of candles and your indicators, you could take a bit of your profit OR for those who did not enter, execute a scalp short play and plot your Fibonaccis.
I'll add more forecast to this idea but will update you in the comments section.
Thanks to those who are supporting my past ideas, means a lot. Feel free to comment your questions or suggestions and please follow my profile on this platform for more of this and possibly add more trading content.
PLAN your trades, happy trading!

LINK ANALYSIS (3D TF)After the bullish mCH, the LINK symbol went up and gained a lot of momentum. The LINK symbol attempts to sweep the liquidity pools indicated on the chart. The red box is where it can reject the LINK symbol down. Note that the time frame is large and time-consuming
For risk management, please don't forget stop loss and capital management
Comment if you have any questions
Thank You

Celebrating LINK's Remarkable Breakthrough - Long LINK Our beloved LINK defied expectations and broke through its one-year trend with an incredible 13% jump! 🚀
Let's take a moment to appreciate the magnitude of this achievement. LINK has not only shattered the barriers of its previous trend but has also shown its potential for continued growth. This remarkable breakthrough is a testament to the strength and resilience of the LINK community and its long-term vision.
Now, you might be wondering, what does this mean for you as a trader? Well, my friends, it means that there's an incredible opportunity knocking at your door. The time has come to consider joining the long LINK movement and seize the potential for further gains.
Why long LINK, you ask? Here are a few compelling reasons:
1. Momentum: LINK's recent surge has demonstrated its ability to defy trends and propel itself to new heights. By long LINK, you can ride the wave of this positive momentum and potentially maximize your profits.
2. Strong Fundamentals: LINK's underlying technology and the team behind it have repeatedly proven their worth. With a solid foundation, LINK has the potential to continue its upward trajectory.
3. Diverse Use Cases: LINK's integration with smart contracts and decentralized finance (DeFi) applications has opened up a world of possibilities. As the demand for DeFi grows, LINK's value is poised to follow suit.
So, how can you get in on the action? It's simple! Take a moment to evaluate your trading strategy and consider adding a long position on LINK to your portfolio. Keep a close eye on market trends, set realistic targets, and remember to diversify your investments for a well-rounded approach.
Remember, trading is both an art and a science, and timing is everything. While the past performance of LINK is no guarantee of future results, it certainly provides us with an exciting opportunity to capitalize on its recent breakthrough.
As always, please conduct thorough research, consult trusted advisors, and make informed decisions aligning with your risk appetite and financial goals.

Link breaking up from bullflag & inv H&SNot even factoring in the much larger monthly pattern link is breaking up from here and only focusing on the inv h&s and bullflag. Will be interesting to see how price action plays off these measured move lines on the way to their targets. While it seems like we have definitely triggered the breakup from the bullflag I don’t think it has officially broken upward from the inv h&s neckline just yet, but likely will soon. *not financial advice*

A confirmed breakout of linkusd’s daily falling wedge = $8.58If it confirms the target is around $8.58. Confirming this breakout would likely ensure the recent golden cross is sustained as well. *not financial advice*

Link's Ongoing Struggle At $7.6 Hopes For A Breakout To $11(Link), one of the leading cryptocurrencies in the market, has been locked in a seemingly endless struggle to breach the 7.6 dollar price point for several months.
The cryptocurrency market is no stranger to volatility, but Link's stability at this particular price range has caught the attention of investors and analysts alike. In this article, we will explore the factors contributing to this prolonged struggle and examine the potential catalysts for a price breakout that could propel Link to $11.
Understanding the $7.6 Resistance
Link's performance in the cryptocurrency market has been impressive over the years. However, since , it has been unable to sustain a significant upward momentum beyond the $7.6 mark. To understand this resistance, it's essential to look at the various factors influencing Link's price.
Factors Contributing to the Prolonged Struggle
Market Sentiment: Market sentiment plays a vital role in determining the price movements of cryptocurrencies. Negative news, regulatory concerns, or general pessimism can create downward pressure on a cryptocurrency's price. Link has faced its share of setbacks and FUD (fear, uncertainty, doubt) in recent months, which has contributed to the struggle.
Resistance Levels: Technical analysis often highlights significant resistance levels that can act as barriers to price movement. The $7.6 level has been a formidable resistance point for Link, with traders and algorithms reacting to it.
Overall Market Conditions: Cryptocurrencies are also influenced by broader market conditions. A bearish market can make it challenging for any asset to rally, while a bullish market can provide tailwinds for significant gains.
The Potential Catalysts for a Breakout
Despite the challenges, there are several factors that could potentially drive a breakout for Link, with a price target of $11
Technical Analysis: A break above the $7.6 resistance level could trigger a surge in buying interest, pushing Link's price higher. Traders and algorithms often follow such breakout patterns.
Fundamentals: Chainlink's fundamentals remain strong, with its decentralized oracle network being widely used across various industries. Adoption of the technology can create sustained demand for the cryptocurrency.
Positive Developments: News and developments related to Chainlink's partnerships, integrations, and projects can significantly impact its price. Positive news can rejuvenate investor interest.
Chainlink's extended struggle at the $7.6 price point has frustrated many investors, but it's essential to understand the myriad of factors that have contributed to this situation. While breaking the resistance will not be easy, there are several potential catalysts that could pave the way for a significant breakout, with a price target of $11.
Investors should closely monitor the market sentiment, technical analysis, and the broader cryptocurrency landscape for signs of a potential turnaround. In the volatile world of cryptocurrencies, one thing is certain: surprises are always around the corner, and Link may yet surprise the market with a remarkable rally to $11.
As with all investments, it's crucial to exercise caution and conduct thorough research before making any decisions in the cryptocurrency market. check for plagiarism.
LINK ANALYSIS (short term)Link has entered the correction phase after its rise.
Due to the overlapping of the waves and spending similar times, it seems to be inside the diametric pattern.
The link is expected to move according to the predicted path on the chart.
For risk management, please don't forget stop loss and capital management
Comment if you have any questions
Thank You

Chainlink Roadmap ($200?)(Chart above Green Line - November 2024 , Red Line October 2025)
There are some amazing things happening right now on the Chainlink chart. It may seem like LINK is still in a boring range, but for me, it's quite the opposite. This move down to $5 was the best that could have happened for LINK.
We documented this entire move down to $5, and you can check it out below:
The bar pattern you see in front of you on the main chart above is taken from December 2018 to May 2021. Why so specific in December 2018? Well, if we zoom into the Daily timeframe, you can see a clear mirror pattern appearing. This move down to $5 confirmed to me that, in fact, Chainlink has been playing out a very similar fractal since its first and only bear market, starting from November 2022 (FTX crash).
This is an incredible find! Just look at it; it's undeniable!
The last wave from December 2018 looks pretty much the same as the one we had in June 2023; it even took the same time at the bottom and to pump back up to the range high.
The only major difference here is that in December 2018, this final wave set a higher low, but this year we set a lower low:
Now, let's talk about Fibonacci time sequences:
I forgot about this time count, in October 2022, I marked it as failed because we didn't get a reaction from it anymore, but I stumbled upon it in an old chart save, and wow, it did, in fact, mark the bottom of wave 5 and pivot up.
If Chainlink does repeat the last cycle, then this October 2023, Chainlink will have a massive run-up to an all-time high:
So, out of the last five Octobers since this chart started in 2017, Chainlink has finished the month positively every time except for the first:
Oct 2017 -55%
Oct 2019 +49%
Oct 2020 +28%
Oct 2021 +19%
Oct 2022 +2.75%
Keep in mind that this chart starts in September 2017, so this October we could see a big move up or the start of it. If Chainlink behaves like the last cycle, it rallies to all-time highs.
Remember that Chainlink broke all the high four times before Bitcoin finished its cycle top:
If Chainlink breaks the 3.618 Fibonacci level four times again, LINK would go over $1000:
I put this outcome as unlikely since it takes a lot more money to move this market cap to those numbers.
This TA assumes that Chainlink will follow more of the Bitcoin cycle, as that's what coins that run through the cycle once and significantly increase the market cap tend to do.
LINK/BTC
This time sequence started everything , put everything in motion for chainlink for me , since then its been right at predicting Chainlink events 100% of the time for years , the next date is April 2024 which happens to be the next Bitcoin halving, things are going to get really crazy around this time expect anything.

🔗Chainlink(LINK)🔗 will Go Up⏰(15_min)⏰🏃♂️ Chainlink(LINK) is moving in the 🟢 support zone($7.34-$7.13) 🟢.
🌊In terms of Elliot waves , Chainlink(LINK) has completed its 5 waves in the 15-minute time frame.
💡Also, the Regular Divergence(RD+) between two successive valleys is clearly visible.
🔔I expect the 🔗 Chainlink(LINK) 🔗 to move towards my 🎯 Target 🎯 after the downtrend line breaks.
Chainlink Analyze (LINKUSDT), 15-min time frame ⏰.
Do not forget to put Stop loss for your positions (For every position you want to open).
Please follow your strategy; this is just my Idea, and I will be glad to see your ideas in this post.
Please do not forget the ✅' like '✅ button 🙏😊 & Share it with your friends; thanks, and Trade safe.

LINK ☀️ Upside In the Next 24 Hours; Bullish Forecast Cloudy ☁️, slightly bearish trading conditions will linger over the global crypto market in the next 24 hours. Sunnier ☀️ slightly bullish conditions will, however, prevail overChainlink Uniswap, and Cardano, according to ATTMO’s forecasts.
Over a one-week horizon, a mixed picture arises. The sun ☀️ will return and shine over Bitcoin, Litecoin, Cardano, and Uniswap. Other altcoins including Ether, XRP, and Binance face bearish clouds ☁️ and downside risks. Avalanche may even face stormy ⛈️ trading conditions, signaling the risk of a very bearish trend.
Follow us for more crypto weather reports!

🔗Chainlink(LINK)🔗will Go Down by Triangle⏰(1-Hour)⏰Hi, everyone👋.
🔗Today, I decided to analyze Chainlink(LINK) for you. I hope that it is useful to analyze.
📚 What Is Chainlink(LINK) ❗️❓
🔸Founded in 2017, Chainlink is a blockchain abstraction layer that enables universally connected smart contracts. Through a decentralized oracle network, Chainlink allows blockchains to securely interact with external data feeds, events, and payment methods, providing the critical off-chain information needed by complex smart contracts to become the dominant form of digital agreement.
🔸The Chainlink Network is driven by a large open-source community of data providers, node operators, smart contract developers, researchers, security auditors, and more. The company focuses on ensuring that decentralized participation is guaranteed for all node operators and users looking to contribute to the network.
🚩It seems that Chainlink(LINK) is creating a Contracting Triangle between two areas of 🟢Support🟢 and 🔴Resistance🔴 .
🔔I expect Chainlink(LINK) to move towards the 🟢 support zone($7.34-$7.13) 🟢 after breaking the lower line of the Contracting Triangle .
Chainlink Analyze (LINKUSDT), 1-hour time frame ⏰.
Do not forget to put Stop loss for your positions (For every position you want to open).
Please follow your strategy; this is just my Idea, and I will be glad to see your ideas in this post.
Please do not forget the ✅' like '✅ button 🙏😊 & Share it with your friends; thanks, and Trade safe.

"Chainlink's Decentralized Oracle Network**Chainlink's Bullish Surge Today: RSI, SMA, and EMA in Focus**
Chainlink (LINK) is making waves with a strong bullish trend today. The Relative Strength Index (RSI) for LINK indicates robust buying momentum, firmly above the 70 mark, signaling a potential for further gains. The Simple Moving Averages (SMA) reveal a golden cross, with the 50-day SMA crossing above the 200-day SMA, a classic bullish signal. Furthermore, the Exponential Moving Average (EMA) shows a consistent upward trajectory, emphasizing the sustained momentum. Chainlink's innovative decentralized oracle network, which plays a pivotal role in the DeFi ecosystem, coupled with strong technical indicators, positions LINK as a standout performer in the crypto market today.

Be carefulPlease, don't chill, don't to be too greedy.
Be careful with it.
There a big bearish hidden divergence in weekly.
CHAINLINK - 06/10/23LINK
It looks like #ChainLink wants to take out the $8.271 SUPPLY or at least tap it, could the cup and handle be about to play out?
This is going to depend on BTC breaking out the range it is stuck in.

LINK/USDT SCALPHi.I hope you have good time.As you can see in the chart, I expect a decline to the range of 6.96. A Order Block on the price of 6.96 can cause an upward jump. Taking a short position at this price can be done by getting confirmation. If you like this analysis, please like and follow

Chainlink Bottom Is In. Range Breakout PendingChainlink BIST:LINK has been in an accumulation range for over 500 days. The breakout is coming soon. My bags are packed.

CHAINLINK READY FOR TAKEOFF!CHAINLINK READY FOR TAKEOFF!
Link is the leading oracle and has no real competition, this project will make it to near all time highs in the next 6-12 months and will retest perfectly unless there are any blackswan events in our economy.
Global corporations and enterprises are ready to adopt a blockchain standard and will do whatever it takes to get clarity before this next bull run.
Im expecting chainlink to make definite partnerships with top organizations on the globe and have the potential to have its own ETF or be apart of an ETF.
Chainlink is in a group by its self and theres only a couple projects out there that actually provide real world use-case and LINK is one of the best.
This asset is tightly following ETHERs 2017 bear cycle which lasted 790 days from the previous top. This resulted in ETHER having a massive blow off top and with things rhyming so closely, I believe that chainlink is poised to be upward of $200-$500 if we get lucky.
If this doesn't happen in this bull cycle i still expect to see these price levels by 2030-2031
because crypto cannot survive right now without Link and that gives it enough use-case as BTC does or more in this current day in age where Utility is needed and foundation has to be established to meet industry standards.
