CHAINLINK - WYCKOFF ACCUMULATIONLINK/BTC looking a lot like accumulation over here.
The market is very uncertain at the moment, with BTC being very much in no-mans land.
It could go either way.
But the technicals along on LINK/BTC indicate we may be testing areas where demand is too much for supply.
Chainlink

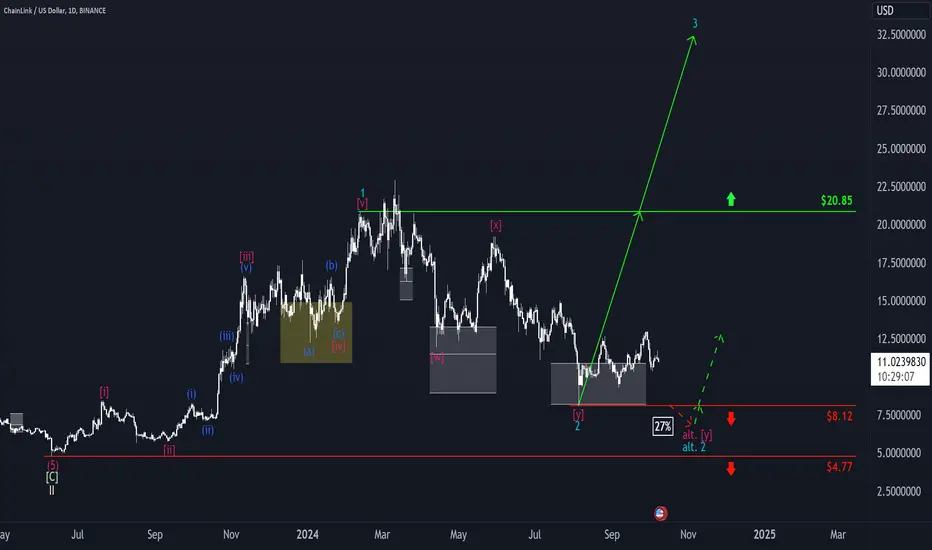
Chainlink: SetbackLINK pulled back significantly over the past seven days. However, we interpret this development primarily as part of the internal substructure of turquoise wave 3 and, therefore, stick to our primary assumption. Moving forward, the price should continue to rise and surpass the resistance at $20.85. However, if the price drops below the support level at $8.12 (probability: 27%), we will have to consider a lower completion for turquoise wave alt.2.
LINKUSD Is it about to catch the world's attention again?Almost 1 year ago (October 25 2023, see chart below), Chainlink (LINKUSD) gave us an excellent long-term buy signal after breaking above the Bear Cycle's Lower Highs:
Our 20.000 Target was hit and shortly after the price started to decline inside a 7-month Channel Down, which is still dictating the price action. Since the August Low though, the price has been rebounding on the 2023 Resistance, which we can now consider that it turned into Support.
This cyclical behavior was last seen during the previous Cycle when after a 2.618 Fibonacci extension reach, the price entered a multi-month correction below the 1W MA50 (blue trend-line) and then recovered for the 2nd and final (and most powerful) rally of the Cycle.
This is exactly what we've been seeing this time around also. See how similar the 1W RSI sequences also are between the two fractals.
As a result, we expect LINK to start rising aggressively, even on this month. The previous Cycle topped on the 4.382 Fibonacci extension, so assuming this will be targeted again, we expect to see 53.00 by mid 2025, which is almost its All Time High.
-------------------------------------------------------------------------------
** Please LIKE 👍, FOLLOW ✅, SHARE 🙌 and COMMENT ✍ if you enjoy this idea! Also share your ideas and charts in the comments section below! This is best way to keep it relevant, support us, keep the content here free and allow the idea to reach as many people as possible. **
-------------------------------------------------------------------------------
💸💸💸💸💸💸
👇 👇 👇 👇 👇 👇

LINK - Three White Soldiers Candlestick PatternIn the weekly timeframe, a bullish candlestick pattern has formed on Chainlink.
The Three White Soldiers are characterized by three consecutive green candles. The higher the timeframe, the more powerful the pattern. We've recently observed an instance of the TWS pattern in the weekly, which was a precursor to a 136% increase:
However, the unfilled wick around $8 remains a concern - but also a potential for buying in / accumulating at a lower price.
_________________________
BINANCE:LINKUSDT

Bullflag On Monthly Log Chart for LINKUSD has a target of $55.4For now this seems very achievable. This is a monthly chart pattern so this could take ome time to reach the target even after a breakout were to be confirmed. *not financial advice*

Quick LINKUSDT Short IdeaTrying a quick LINKUSDT Short here.
Reason: We see it run up to the 4HR Key Level zone and being rejected, so just trying to follow the price action and targeting the previous high to take profits.
Entry Price: 12.311
SL: 12.57
TP: 11.74
Planning to trim if needed in between but eventually the TP will be 11.74 or lower.
Good luck! Happy Trading!
Let me know your thoughts.

LINK - Bullish Control Soon...Hello TradingView Family / Fellow Traders. This is Richard, also known as theSignalyst.
📈After rejecting the $20 round number, LINK has been in a correction phase in the shape of a falling channel marked in orange.
Currently, LINK is hovering around a strong structure, support and round number $10.
🏹 Once the orange channel is broken to the upside, we will expect the next bullish phase to start leading to a movement towards the $20 mark again.
📚 Always follow your trading plan regarding entry, risk management, and trade management.
Good luck!
All Strategies Are Good; If Managed Properly!
~Rich

CHAINLINK long setup / Bulls or Bears, Tell me in CommentsBINANCE:LINKUSDT
COINBASE:LINKUSD
Hello Traders
💥Long position on LINK
SL1 ---> Low-risk status: 3x-4x Leverage
SL2 ---> Mid-risk status: 5x-8x Leverage
👾The setup is active but expect the uncertain phase as well.
➡️Entry Area:
Yellow zone
⚡️TP:
10.62
10.72
10.85
10.94
11.08
11.20
🔴SL:
9.99
🧐The Alternate scenario:
If the price stabilizes below the trigger zone, the setup will be cancelled.

LINK : MASSIVE Profits Possible from THIS ZONEA Bearish Head and Shoulders pattern formed in the weekly, and we're not quite out of the woods yet - usually, a H&S retraces all the way back to the bottom of the left shoulder. In this case, it falls exactly at the ideal buy back zone:
It's good to see that the trendlines are moving CLOSER together - if you look at historic prices, this usually precedes a time of range trading, followed by another impulse wave up. The wider the trendlines are apart, the stronger the sentiment (bearish if under, bullish if above):
_____________________________
BINANCE:LINKUSDT

Chainlink: Take-off! LINK shot upward last week and was thus able to leave our turquoise Target Zone (between $8.20 and $10.90). We expect the turquoise wave 3 to lead above the resistance at $20.85. However, a renewed dive into our Zone within the internal substructure is quite conceivable in the short term, which is why we continue to keep it active.

CODX, LINK, EHTH, UA, MIGI and EVRI. Huge upward potentialFED is expected to start to cut rates in September and smart money will start to find alternative investment vehicles to put their money in. These stocks are showing good potential. I already have positions in all of them but still may add more to my positions.
Disclaimer: Not financial advice. Do your own analysis and research.

LINKUSD Elliott wave countA complex correction ended at 7.864, wave ((ii)) into 0.618 fib retracement of wave ((i)) and wave (y) 123,6 % of wave (w).
Above 9.934 we are looking to the upside for wave (i) of wave ((iii)).
Possible target 19-20 USD.
Watch my related idea.

LINK Aims Higher!Currently reclaimed the previous week POC & VAL. I am expecting high prices to come. First target is the PW-VAH then the previous week high.
Calculate Your Risk/Reward so you don't lose more than 1% of your account per trade.
Every day the charts provide new information. You have to adjust or get REKT.
Love it or hate it, hit that thumbs up and share your thoughts below!
This is not financial advice. This is for educational purposes only.

Breaking Above the Resistance LevelLINK is currently within a range where a key resistance level is identified at $11.12. This level acts as a critical resistance, and breaking above it could indicate the return of buyer strength and the beginning of a new upward trend.
Potential Scenarios:
Breaking Above the $11.12 Resistance:
If the price can break above the $11.12 resistance level, this move could lead to an increase in price, reaching higher levels like $12 and $14. These levels are considered potential targets for an upward move.
Failure to Break Resistance and Price Reversal:
If the price fails to break above the $11.12 resistance, there is a possibility of a return to lower support levels like $9 and $8.49. These areas serve as key levels to support the price against further declines.

Chainlink: Let’s go!LINK dropped significantly in the last seven days and even briefly undercut our turquoise Target Zone (between $8.20 and $10.90). However, as it was able to turn around quickly and only undercut the range by less than 1%, our count remains intact. We now see the turquoise wave 2 as completed and expect an upward push above the resistance at $20.85 in the further course. Investors could open long positions within our Target Zone. Stops could be placed around 1% below the lower edge. Should the bears push the price significantly below the Zone (37% likely), we will have to anticipate a lower low of the turquoise wave alt.2

Chainlink Business As Usual It might seem like a shock for most that Chainlink had this big move down, but if you have spent a lot of time studying Chainlink's last cycle, you would know that this is business as usual.
The fact that Chainlink had this move has made me more bullish than ever. We are currently 64% down from March 2024. Crazy? I think not.
71%
71%
62%
44%
These are all the corrections Chainlink had during its last cycle to its all-time high.
All we are doing is a back test to this previous range. Chainlink was doing the same thing last cycle.
If we overlay the last cycle over this starting from wave 5, we can see that we have had a crash during the same time of the cycle as we did in March 2020 (Covid). Crazy.
I would not be surprised if Chainlink closed above $11 by the end of the week, just above the 1:1 Gann Fan, and started a V-shaped recovery, marking the bottom. There is a very high chance.
Once again, my time fibs hit right on the money. The blue fib marked the bottom, and the yellow marked the top!
**Next date: 18th Nov 2024**


Long position on LINKUSDT 49Min/ Volume PredictionBINANCE:LINKUSDT
COINBASE:LINKUSD
High-risk status: 4x-5x Leverage
Mid-risk status: 3xLeverage
Low-risk status: 2x Leverage
⚡️TP:
13.72
13.85
13.95
14.09
14.23
14.34(In Optimistic Scenario)
➡️SL:
13.28
13.07
12.85
The Alternate scenario:
If the price stabilize below the trigger zone, the setup will be cancelled.

Alikze »» PYTH| Descending channel failure🔍 Technical analysis: Descending channel failure
- It has been moving in a downward channel in the 8H time frame and daily.
- Currently, with the failure of the channel roof, it is around the supply area and neck line.
- Therefore, in case of a negative reaction, it can be broken into the channel with pullback and touch the specified targets by maintaining the 0.29 area.
💎 Alternative scenario: In addition, if it stabilizes below the 0.29 area, it can retest the green box.
🛑 Targets: 0.39 - 0.44 and supply area or red box.
🟩 Support: 0.29
»»»«««»»»«««»»»«««
Please support this idea with a LIKE and COMMENT if you find it useful and Click "Follow" on our profile if you'd like these trade ideas delivered straight to your email in the future.
Thanks for your continued support.
Best Regards,❤️
Alikze.
»»»«««»»»«««»»»«««
OKX:PYTHUSDT

LINK Looks Short Term Bearish!!!After breaking the previous weeks lows, the chances of us tapping the support again before a move up has increased.
Yellow arrows mark my areas of interest for a short & a long trade.
Calculate Your Risk/Reward so you don't lose more than 1% of your account per trade.
Every day the charts provide new information. You have to adjust or get REKT.
Love it or hate it, hit that thumbs up and share your thoughts below!
This is not financial advice. This is for educational purposes only.

$LINK targeting $2.72?NASDAQ:LINK looks like it's on the verge of a breakdown of it's H&S top. Should price break below $12.78, the target for the move would be $2.72.
We just got our first red candle on the 2D heikin ashi which increases the likelihood that it rejects here and falls lower below $12.78.
Let's see how it plays out over the coming months.

LINKUSDT Inverse Head and ShouldersLINKUSDT Technical analysis update
LINK price has been forming a head and shoulders pattern over the past 30 days. Now, the price is moving towards the neckline with high volume for a breakout. If the breakout is confirmed, we can expect a strong move in LINK.
Buy Level: Above $14.70
Stop Loss: 13.30
