LINK/BTC 1W - Fibonacci RoadmapJust using two Fib retracement and extension grids, all of the key S / R levels are neatly exposed.
Could a weekly close above 2.618 imply further upwards movement? Or will the retrace continue?
Also interesting to see an essentially non-decreasing OBV and high up above LINK's long term (mean reversion) trendline.
Should be interesting to watch.
Chainlinkbtc

Chainlink new support and bounce?Chainlink looks to be forming new support at the previous ATH level .00018. Low risk entry with tight stop just under .00018 is available. This is very very bullish if it does find support and bounces here. .00018 Key level. If this fails next support is .015ish and a bounce and support there still keeps the bullish chart trend, a bounce here at .00018 is just extra bullish.

Chainlink/BTC: The Recursive BullChainlink looks primed to follow another cup and handle burst upwards. If this will occur, we should expect at least 20k sats in the near future.
In addition to this, the 1w OBV is at ATH after breaking it's most recent. 1w MACD is set to cross and explode upwards as well.
Should be a fun watch.
Stay tuned.

Chainlink Potential Move upwardsChainlink (LINK) could potentially setting up for a move upwards. Looking at the chart .00009 is an area that has been resistance and support numerous times since November. While technically it is bearish to see price fall below this level, then bounce back and find resistance there, it has held a pretty solid floor around the .0008 area, and seems to be continue testing the .00009 area, and just broke through it. This will be very bullish if it is able to refind support at this level as resistance to become support is typically very bullish. So this is an area I would watch closely for a signal of a potential move. LINK/ETH chart also shows price sitting at a key resistance level as well.

Chainlink (LINK) bull vs bear???Chainlink potential support is this .00013 level. From here bullish scenario is the green path as it would be old resistance now becoming support. Bearish scenario is the red path of a dead bounce into the shaded area where it rejects falling back to this .00013 level and retesting it. If the .00013 it is at now acts as no support and price falls through without any bounce (very bearish) and next support is .0001-.00011. Ultimate support is the shaded area below. Watching closely here for direction. Stay safe.

LINK BULLISHLINK
I'm leaning towards bullish continuation to our target at R2, however I think we could see a pullback into grey box first, I'd like to see it hold as support.
I'm liking the volume here, shows very strong demand.

Chainlink @ resistance of trading range. Looking for new highs?S/R zones on weekly and monthly timeframe. Chainlink is keeping it's trading ranges beautifully.
After the mainnet announcement, I can imagine that it breaks through resistance on it's way to new highs. Definitely a project to keep an eye on.


LINK to price discovery! LINK broke out of its descending trendline and is currently breaking into resistance
If it can break above here, a test of ATH is on the cards and could very well break up higher into price discovery mode
Thanks guys!

ChainLink Symmetrical Triangle As you can see the symmetrical triangle formation on the daily; ChainLink can be expected to break out in the coming days. MACD has flipped which has signaled an end to the selling pressure. Bears were unable to break through support of the triangle which signals a possible breakup rather than a breakdown. Resistance at the orange line which is the moving average and resistance at top of triangle. Keep an eye out for volume as that will be key to breaking both resistance levels for a test at BTC ATH.
Not Financial advice just my opinion.

Trying to break from the falling wedge....Trying to break from the falling wedge after retracing to the .382 fib level since the 60%+ run that happened on January.
Volume is currently rising.
RSI Rising and MACD about to bull cross.
Potential Targets on the chart. UCTS showing a buy on the 12h

Chainlink (bullrun) continued (?)Chainlink has hit an important channel support. The overall trend is quite bullish, but should it break down from this channel, and especially the fib zone beneath it, it will likely correct lower. If it follows this bullish channel up, and breaks out, then it will likely continue the bullrun. You can seem the links of my past Link analysis. I'm doing these because Chainlink is virtually the only crypto to completely defy the broader bear market.

Daily Bullish Signal $LINK #LINK (20 Feb 2019)RED ARROW indicates the EXPECTED Time and Targets
Level Stoploss point up to maximize profit and reduce risk
I'm working all the time, even in Bearish Market

Chainlilnk updateI've been following Chainlink for a while and wanted to post this update. It is once again approaching a key crossing zone where it will either breakdown or resume the bullrun. You can see by the chart where the resistance and support are meeting. I don't know if it will breakdown or break out, but a move will likely happen soon. If it falls below that blue trend line, it will likely breakdown to the next support (marked by rainbow zones of fib retracement).

Consolidation over?LINK is almost done with consolidation, but indicators are still not good. This forecast is for the case BTC continue growing above 3400.

LINKBTC BINANCE 1D up to 11FEB19 Trading Analysis (TA)LINKBTC ChainLink / Bitcoin BINANCE 1D up to 11FEB19 Trading Analysis (TA)
1D Chart, ChainLink (LINK) by December 11, 2018 (1), was able to break down the 100 days MA signal, and find support over the 200 MA signal for days before rising its price hovering over the 60 RSI line (2), now the price is correcting moving down toward the 100/200 MA signals (3), where I believe could find support again and/or over the 40 RSI line, which is the optimistic approach, but remember "You are not suppose to try to catch the knive falling" its bottom support is close. At this time the Market Cap is around 119b. Good Luck!
1D Chart, ChainLink (LINK) el 11 de diciembre de 2018 (1), atravesó en caída la señal de MA de 100 días y encontró soporte sobre la señal de 200 MA durante días antes de aumentar su precio sobre la línea de 60 RSI (2), ahora el precio se está corrigiendo moviéndose hacia abajo hacia las señales 100/200 MA (3), donde creo que podría encontrar soporte nuevamente y / o sobre la línea 40 RSI, que es el enfoque optimista, pero recuerde que "No debe intentar atrapar el cuchillo cayendo", su soporte inferior está cerca. En este momento el Market Cap esta alrededor de 119b. ¡Buena suerte!
“I believe in analysis and not forecasting.” / "Creo en el análisis y no en el pronóstico".
REMEMBER: I am not a financial adviser nor is any content in this article presented as financial advice. The information provided in this blog post and any other posts that I make and any accompanying material is for informational purposes only. It should not be considered financial or investment advice of any kind. One should consult with a financial or investment professional to determine what may be best for your individual needs. RECUERDE: No soy un asesor financiero y el contenido de este artículo no se presenta como asesoramiento financiero. La información provista en esta publicación de blog y cualquier otra publicación que haga y cualquier material que la acompañe es solo para fines informativos. No debe considerarse asesoramiento financiero o de inversión de ningún tipo. Se debe consultar con un profesional financiero o de inversiones para determinar qué es lo mejor para sus necesidades individuales.


LINK: Short Term BUY Opportunity After Breakout !!Buy After Breakout and Set Risk reward Ratio as Shown in Chart.
You Can Also set Own Risk reward.
Let see what Will be Next Move.
Warning- I m Not a Financial Advisor this idea Only For Educational Purpose Only.
Thank You !!

LINKBTC CHAINLINK forming Cup and Handle on weeklyChainlink looking very nice forming the cup and handle (yellow line).
If the technical pattern continues we could see a massive rally soon
Short term target: 0.00006900 (7%)
Long term target: 0.00009345 (50% , recent November highs)
Very Bullish target: test above 0.00010000


linkbtc | daily | bullish | 40%+ potential gainsascending channel with solid resistance and support
re-entry at new support, to be determined

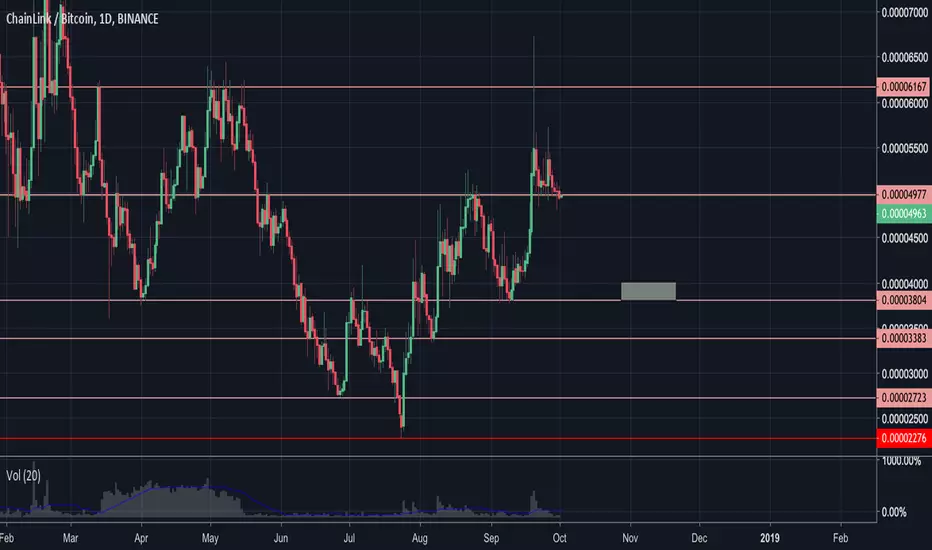
Analytics LINK/BTCChainlink is a platform that serves as a link between blockchains and real business. The idea is good, but not sufficiently developed. There are no descriptions of project progress activities in the official channels. The token should not be considered as a long-term investment.
The chart shows that the asset does not linger in portfolios and used mainly for speculation. There is a lack of strong areas of support and resistance.
In May, the trade volume fell sharply, almost 90%, and did not return to it's previous level. Thus, there is the low coin liquidity. Asset can be considered as a tool for intraday trading, during the day it shows a volatility of 7-15%, weekly - 30-40%.
The point of entry into the asset is not earlier than the price reaches the level 0.000038-0.00004. Be sure to use the stop-losses, because the rate is a subject to manipulation.
It is worthwhile to consider charts with a smaller time frame to make decision.