LINK is Super Bullish! (Ready to recover)After a long drop from $52 to $13 a few months ago, LINK's recovery is finally looking promising as it begins to ascend within the upward channel. Expect LINK to have micro pull-backs as it marks up, but I believe we can expect it to mark up in the short term and over the next coming months. This is not trading advice and yes I do HODL Link.
Please do not risk what you can't afford to lose. Happy trading!
Chainlinkusd

Chainlink Swing Trade Along MacBy identifying swing highs and swing lows, we can identify the appropriate targets.
Chainlink has targets at:
- $36
- $44
- $53
Using these targets and identifying the levels of support and resistance in conjunction, we can identify accumulation zones.
Chainlink accumulation this cycle assuming bullish top:
- $24 - $31.5
Currently, Chainlink is above the accumulation zone, but still under Target 1 and I believe a solid position to buy if below $35, just not a maximized gain.
Chainlink is in a great position right now to surpass target one and make a run to test target 2. The MACD has crossed paths along with neutral buying accumulation in midway, so looking back in history we could be expecting bullish momentum until another cross along the accumulation peak or MACD.
Best case scenario:
- hits target 2 and target 1 becomes support in preparation for the final top of the bull cycle
- sky is the limit by then
Worst case scenario:
- rests in accumulation zone
Be wary of:
- Bitcoin swings
- Panic and emotion selling
Note:
- Chainlink is the turtle, not the bunny
- Slow and steady wins the race...!

LINK trend continuationLINK shows strong price position and trend, next price levels seem to be just a formality

Chainlink UptrendChainlink price has been suffering for after May 19 crash and has stayed under a critical barrier because then. However, LINK is turning around as it coils as much as grapple with this hurdle and cause a new upswing.

Chainlink Monthly Stochaistic TakeOffParadise territory my dear Link Marines. Volcanic eruption in the works!

Chainlink analysisChainlink price could create one of the most sought-after bullish entry setups in Point and Figure analysis: the Bullish Catapult. However, buyers must keep Chainlink above a certain price threshold, or the pattern will be invalidated
Chainlink price has been hovering below a crucial resistance level at $28.20 for the past two weeks.
A decisive close above this barrier will likely propel LINK up by 55% to $41

CHAINLINK - $LINK | FOMO WAVE COMING?CHAINLINK - $LINK
FOMO wave coming?
Fractal Target apparently into the 110$ area within November end.

CHAINLINK ROAD TO 150$ , IF HISTORY REPEATS ITSELF!Road to 150$
the 1st wave of chainlink was from bottom low @0.20 before making new higher highs to @5.00 , ( it took 182 days for the 1st wave to happen )
the 2nd wave of chainlink was from bottom low @1.52 before making new higher highs to @20.00 , ( it took 153 days for the 2nd wave to happen)
the 3rd wave of chainlink was from bottom low @8.50 before making new higher highs to @50.00 . ( it took 182 days for the 3rd wave to happen)
If history repeats ..
the 4th wave of chainlink should be the bottom low of @13.50 to making higher highs to @150.00. ( it should take 153days or 184days for the 4th wave to happen which means January 1st , 2022 )
Upside-down mirror tool used

ChainLink longtermChainLink is moving in a clear channel. Just wait for a clear rejection from the bottom of channel.

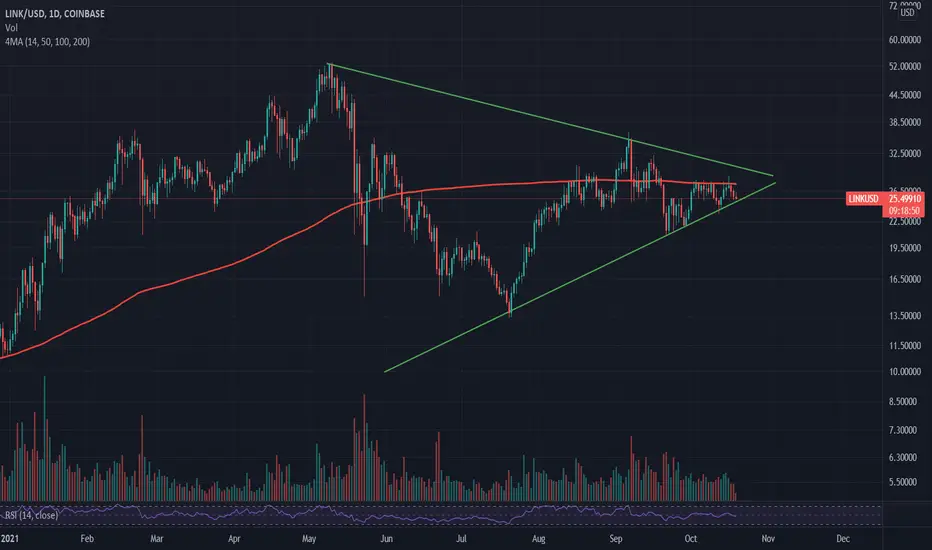
Chainlink symmetrical triangle, 200MAChainlink formed a symmetrical triangle and and still below 200MA, similar to VeChain. Link currently testing the support line and hopefully successfully bounces off the support line. Then I hope for a successful breakout in the next few days. If Chainlink successfully breaks through the symmetrical triangle and 200MA it will be a very bullish sign.
Link Looking for a Breakout!!Chainlink has been starting to push up once again off of our lows at almost 21$(USD) we are seeing a strong push upwards within a bullish triangle and we are seeing a strong hold on our bottom support of this triangle. Slightly above the top side of the bullish triangle we have been getting rejected off of the pivot point, we have had a total of 10 wicks and touches on this level and hopefully we can see some volume soon and see a final push above here. Regaining the pivot point is absolutely key for LINK like in the name it is a reversal point where we would likely see a nice rally off of, I think this outcome is pretty likely and due to the fact that we are currently in a bullish triangle which historically plays out to the upside so if we do see a break to the upside it could be an explosive one! Now keep in mind with BTC dominance still rising Bitcoin could ruin the party once again for the altcoins so that is always something to keep a close eye on! Looking at the bollinger bands we are sitting directly ontop of the midline which is currently support, and we definitely want to see a hold above here for daily close tonight and keep this level as support, the last thing we need is heavy resistance just above the bottom of the triangle. Checking out the RSI we are currently right on the midline and we are looking for a bounce here, we want to stay above this level not just because it keeps support but being above the midline confirms we are in or staying in an uptrend. If by chance we do break below here we have uptrend support coming from previous bottoms and there is a high chance we would see a nice bounce off of here, likely sending us back above the midline to hold onto this uptrend! Like i said before we always have to be mindful of BTC and what Bitcoin is doing because as you guys know if BTC takes a little fall the rest of the market for a majority follows, same thing if we see BTC dominance push higher we could also see the altcoins bleed a bit, but if we see BTC.D fall we can expect altcoins to start to breakout! Not financial advice just my opinion!!

LINK calmed potentialChainlink is currently sleeping, slight price fluctuations are not very noticeable, time will tell if this will change, but there is a good chance

LINK ready Link is looking good, ready to take off. Good iHnS printed on the daily timeframe. Target 36.30 by the end of October. SL at 23. It is now trading above the 50 day VWMA. However, we may see a retest of the broken neckline at 26, which would be a great buy opportunity. We have just printed a minor wave 1 and now into the minor wave 3 which will explode soon to reach 36.30. We have also printed a small iHnS on the 4h which will push link to 31 soon.
The final target of the minor wave's cycle is 41 dollars. However, i expect link to reach 95 by the beginning of December and 295 by middle January.
FOLLOW ME, SHARE, LIKE AND COMMENT

Chainlink (LINK) strong rebound and direction of $30Chainlink, after two strong corrections, is slowly regaining its price, the corrections were inevitable due to the strong pump. currently worth buying and holding for long

(CHAINLINK) Growth potential analysisHello everyone !
Today the Black Cat Trader is analyzing LINK on a weekly chart.
What we can see :
- Using the « trend-based Fib Extension » on the last four impulsive waves, we can see that each ATH tops at minimum into the « 1.618 fib extension » (during the waves 2 and 3, prices top at level « 3.618 »)
- Using the pitchfork, we can identify a strong resistance located on the intermediary upper line (white) where prices could top and be rejected if Link continues to rise like it does since 2017. Then we can identify a strong support on the lower line of the PF.
- Using Ichimoku system, we can see that prices are into the Kumo (cloud) and down the Tenkan and the Kijun. Note that the lagging span has been stopped by the Kijun (at the moment). This is actually neither a good or bad situation for Link.. Just neutral
What we can expect :
- If prices manage to leave the Kumo by the upside, and break the Tenkan and Kijun (which are major resistance right now) we can expect prices to reach our target area, represented by the Fib Extensions : « 1.618 to 3.618 » (wait for the lagging span confirmation).
- If Link breaks the Kumo by the downside, then we can suppose prices will take support on the lower line of the pitchfork which represents a strong support.
Major resistances : Kijun weekly + Intermediary lower line of the Pitchfork
Major support : SSB + Lower line of the Pitchfork
Take Profit 1 : Fib Level 1.618 (87$)
Take Profit 2 : Fib Level 2.618 (133$)
Take Profit 3 : Fib Level 3.618 (178$)
IF YOU LIKE THIS POST, FEEL FREE TO LEAVE A LIKE AND FOLLOW THE BLACK CAT TRADER
MAY THE CRYPTO BE WITH YOU GUYS (D.Y.O.R)

CHAINLINKMany are requesting a chainlink chart. Chainlink is approaching a great buy opportunity. It is trading in a bearish pennant, which suggest lower prices are on the way. However, I believe the pattern objective won't be completely exhausted, and link will touch 20 to resume then the bull run with solid momentum. 20 dollars is a strong support area, as it is a crucial lower high from February, flipping of resistance back in July. It is also where the diagonal support is created by linking together the low of waves 2 and 4. It is where the 0,618 retracements of the last rally are sitting, which is also the target for the retracement of wave 1 of the new bull run. It is beautiful. after this last week/10 days of weakness, LINK will climb up to break the descending wedge and reach 35 to complete the continuation inverse HnS. The indicators are starting to look great, with the RSI and Stoch RSI daily approaching the oversold area. The first target then will be 56. However, as a final target for this bull run, I have 297.
I hope you understand everything in the chart. If you need any clarification, just comment below.

Chainlink about to pump!Good Morning crypto fam :)
Today we take a look at LINK/BTC. As you can see in the chart, we are running slowly to the deciscion at the end of the year. In the next weeks we will now the route for 2022.
As of this moment we could see altcoins outperform Bitcoin and rise against the king.
I buy some Link just for the cause, i miss the pump.
A good long term project with an amazing community behind it.
Thanks for reading :)
Have an awesome day

Good opportunity for LINK If the BINANCE:LINKUSDT manages to keep above MA20 this will be a good opportunity to attack at 31-32-42 $ and maybe much more ... 50$ and 100$ :)
Entry price 26-27$
Targets: T1 32$ T2 34$ T3 42$
Stop loss: 25.50$

LINK/USDT SHORT 9% IDEAHello crypto folks!
If we not breakout above 29.94$ – 30.61$ its more likely that we see a little retracement. First level to gain as support is arround 28.21$ and this is our first profit target for this short idea. The range for short selling: 29.20$ – 29.80$.
This trade is more like a hedge because we have still some longs from 24.50$ and looking for more new fills at 27$ and 26.40$. This level is also our last take profit area for this short idea.

LINK - will the drop continue 🤔❓LINK has been in the global range for about a month now. The price is now in the middle of this range near the support level of $24.8. If the Link continues to squeezing this level, the price is likely to break through it and the next target will be the bottom of the global range.
Write in the comments all your questions and instruments analysis of which you want to see.
Friends, push the like button, write a comment, and share with your mates - that would be the best THANK YOU.
P.S. I personally will open entry if the price will show it according to my strategy.
Always make your analysis before a trade

LINKLINK looks playing in a raising channel about 2 years and got bounced from the bottom again. now Im looking for $90

Ascending Channel Link/USDLink follows the ascending channel to $35 before breaking down and then consolidating as $BTC makes its move to 50k.

Chainlink new highs this year. Link's long term trend is still holding. There is no reason to be bearish on Chainlink at all. COINBASE:LINKUSD
