ChainLink $LINKUSD Long Term Target PTs 70-150 and higherLINK/USDT
The bulls have propelled Chainlink (LINK) above the $36.93 overhead resistance today, indicating the resumption of the uptrend. If the bulls can sustain the price above $36.93, the altcoin could continue its march toward $50.
The 20-day EMA ($32) has turned up and the RSI has risen above 65, suggesting the bulls are back in the driver’s seat.
However, if the bulls fail to sustain the price above the $36.93 level, then it will indicate aggressive selling by the bears at higher levels. That could result in a drop to the 20-day EMA. A strong rebound off this level will suggest the sentiment remains positive.
Conversely, if the bears sink the LINK/USDT pair below the 20-day EMA, it will suggest that the current breakout was a bull trap.
Chainlinkusd

Link Buy break of recent ATH!LINKUSDT - Intraday - We look to Buy a break of 38.08 (stop at 36.68)
Daily signals are bullish.
Price action resulted in a new all-time high at 37.98.
A break of 38.00 is needed to confirm follow through bullish momentum. W
e look for gains to be extended today.
The early dip was bought into.
Our outlook is bullish.
Our profit targets will be 42.88 and 44.68
Resistance: 38.00 / 40.00 / 42.00
Support: 37.00 / 35.00 / 33.00


Next Expected Moves of CHAINLINK | LINK-USDwe can expected this bullish move in Chainlink in coming days. This looks pretty bullish from here after small correction.

Chainlink $LINKUSDT Target PTs 35-100 long term Chainlink Price Forecast: LINK primed for a 30% advance
Chainlink price struggling with short-term resistance at $32.00.
Whale transaction count registered a spike on April 2.
Topside trendline comes into play around $42.40.
Chainlink price trended sideways for more than a month and on below-average volume every day, but one. The price action in mid-February, early March, and now point to $32.00 being a psychologically important level. If the level is overcome, the altcoin should rally more than 30% in the coming days.
Chainlink price bottoming out versus Bitcoin
Data from ByBt.com shows that Grayscale bought 115,570 tokens for the Grayscale Trust from March 17 until April 1, which included a large 65,570 purchase last Thursday. Heavy buying like that gets the attention of market participants and may have been behind the 8% on April 2.
Santiment data showed that the number of mid and large holders owning 100-100k LINK tokens notably accumulated during March. Additionally, the so-called whales holding 100,000 to 1,000,000 LINK tokens increased 6% from April 1 - April 3.
The March high was $32.00, and that is the level that LINK has been struggling with over the last few days. A trade above $33.15 will confirm the April 2 breakout and set the stage for a quick advance to the February high at $36.92. The next target is the 2.618 Fibonacci extension of the August 2020-September correction at $40.53.
A 33% gain would accompany a rally to the topside trendline at $42.51, which was resistance at the February high and resulted in a rapid 40% decline. For now, LINK should not be reviewed as a trend trade but a short-term opportunity.
The first level of support is at the intersection of the rising trendline and the 50-day simple moving average (SMA) at $24.83, followed by the February 23 low at $21.00. The last gasp support level is the August 2020 high at $20.00.


Chainlink: Sellers Got SmokedSo the sellers were only able to take price down to 23.75 on March 24th.
Then price went up to the 21 day EMA and went right through it going
up to test the resistance around 31.00.
This has challenged many of the sellers with short positions and now many of them have
bailed out. When I saw this, I personally went long on April 4th buying Chainlink at a price around $30.63.
The weekly chart looks very bullish which also gave me more reason to go long
somewhat close to resistance.
On April 4th, the daily chart printed a churn bar which is a cyan color on this chart. This
indicates big players stepped in. Price went above the high of this bar on April 5th and 6th which
indicates there was enough demand and supply was bought up. This indicates prices will go higher
for the time being and most likely will test the high of 36.92.
We'll see what tomorrow's bar brings!

Possible head and shoulders pattern in CHAINLINKCHAINLINK is in an ascending channel since early 2021
After reaching a new ATH , LINK got stuck between 2 support and resistance zone (32$ and 24$)
There is a possible head and shoulders pattern if approved we will see a retracement move to the bottom of the channel
1st target would be about 26.5$

Chainlink (LINK) to test previous ATH and Beyond 54% GainUpdate 05 /04/21: Chainlink (LINK) to test previous ATH and Beyond 54% Gain to 161.80% Fibonacci level @ $47. Since reaching a new ATH on the 20th February @ $36.84 Link has been consolidating in this range between 61.80% and 23.60% Fibonacci level ($30 to $24) showing significant profit takers in the market as we have seen the bulls try to push the price above the 61.80% Fibonacci level and failing to break past this key resistance level 3 times over the past 42 days. On the 29th March our Swing Call script triggered a strong buy signal just above the 38.20% Fibonacci level and we actually saw the price push past the key area of resistance for the first time since setting the new ATH . Since then we have retraced back down touching the 50 SMA (a clear fake out from LINK). From here we expect another test of the 50 SMA before the LINK can truly break out of this key area of resistance to push past the 78.60% Fibonacci level and a test of the previous ATH which we can expect to be tested @ $36.84. This run from LINK has been long awaited with a lot of solid fundamental news around the project. If we see a break above $33 we can expect a probable 54% Gain to the 161.80% Fibonacci level and our price target of $47. Be patient, wait for further confirmation from price action, use buy zone to map out your buys whether you are already in LINK and want to DCA or are planning to make an entry. Happy trading :) $LINK

BULLISH AND BEARISH ARGUMENTS FOR CHAINLINK - CryptoManiac101CHAINLINK / USD TA
BULLISH CASE
Chainlink is in a symmetrical triangular pattern, otherwise known as a bullish pennant which in over 75% of the cases results in a bullish pump upon confirmed breakout. This would be a good longing zone while LINK is bouncing around in the 'No man's land' and we are waiting for confirmation of BULL or BEAR break.
BEARISH CASE
Chainlink is in the similar pattern as it was back in August - September of last year which results in a nice dump followed by a 4-5 month accumulation before further pump. In this case if we were basing this trade solely based off fractals, we would be entering a short position here and adding on top of it as we get confirmation for downward break.

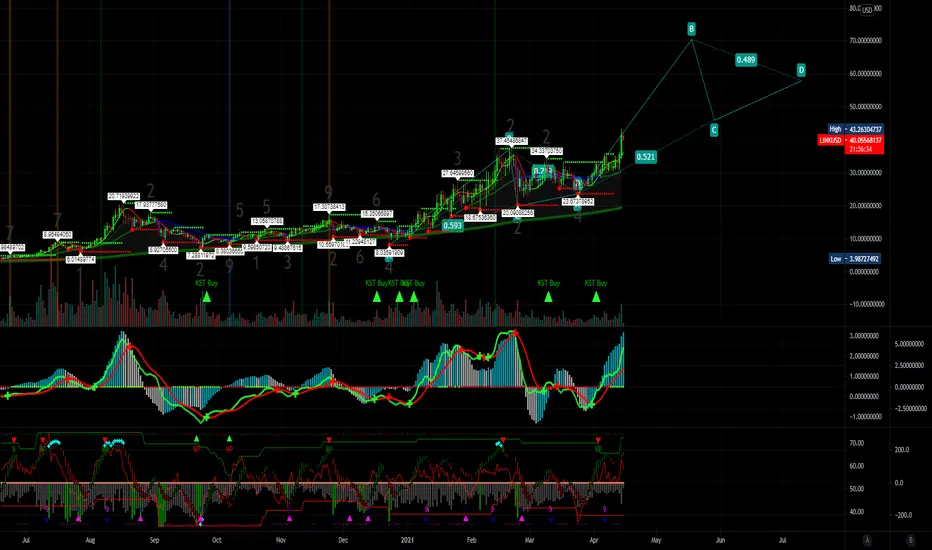
Chain-link idea Idea for LINKUSD
Believe we will see another 200% move upwards after a rest period that we have been seeing
Using spirals to identify strongest trend within price structure
I think LINK will be a big one

LINK usdt - rise to the 1 day resistanceStrong performance from chainlink.
Trendline is holding against the EMA.
Buy volumes are healthy too at this pricepoint.
Expect it to smash the 1 day resistance soon.

Chainlink several bullish signals! Parabolic?Hi Traders!
We are looking at the one day graph of link/usd ..
We can see a MACD Cross whereby the fast line has crossed the slow line, which is indicating a shift in momentum. Bullish in this case.
Furthermore, we can see a bullish engulfing candlestick candle on 29-03-2021. The previous bullish engulfing pattern dates from 01-01-2021, which resulted in a rally of nearly 2 months.
Beside the previous, we can also see a double bottom which indicates a change in trend and a momentum reversal from prior leading price action. Bullish in this case.
In our previous analysis about Chainlink (1 hour graph), we spotted a cup and handle which also is a bullish signa l.
However, yesterday I got me some new pair of shoes. Now I noticed that a lot of people are wearing the same shoes. Or was it the other way around?
This is not financial advice , I am not a financial advisor.
Press the like button and leave a comment !

Looking for LINK to breakout!For half a month now link has been trading mostly sideways creating a wedge, we are currently looking good sitting above our 0.3 FIB level and approaching the apex of our wedge. I think links time is coming i believe we will see a big breakout of the wedge to start the journey back up. Our MACD has crossed bullish and doesn't look like we are going to see a reversal as of now. We also want to watch our RSI and it crossing the 50. point line signaling a clear uptrend! we are currently sitting just below this point. The Stoch RSI is looking great we are bullish and only sitting in the middle of the neutral area. I see a lot a people getting upset that link isn't moving much but all you have to do is look at its full chart to realize its one of the most steady growing, also look at the future aspect and realize long term what they are actually doing and providing technology wise, Its truly amazing! NFA just my opinion!

Link Bullish!I do believe, with a clean break on the current resistance line, This is the last time we will see link at the low levels of $27. Next big resistance is the $31 which we will be testing this week as $BTC continues its upwards momentum!

Link - Stuck between long term demand and short term supplyLink is currently seeing price consolidate between long term demand that has been in place since late January and supply that has been established since its break below the prime trendline. Bids are placed at the 24.81 level and I will be targeting a trade up to the 31.50 level. Indicators providing no edge, Link also has low beta with the broader market so this has little BTC risk to the upside or downside.

LINK: CUP AND HANDLE confirmed, FALLING WEDGE formingHello Traders,
We are looking at the 1 hour chart of Chainlink.
As we can see, a cup and handle formation has formed which is considered a bullish signal.
Furthermore, also a falling wedge is forming / has formed.
Wedge patterns have a tendency to break in the opposite direction from the trend lines.
Which makes this signal a: bullish/bearish
b]leave your answer in the comment section!
This is not financial advice, I am not a financial advisor.
Click the like button and more ideas will follow.
Thanks.

Link looking for a key daily close!Currently we are sitting above our 0.3 FIB level and i'm watching for a daily close above it. We are looking very bullish In my opinion, the stoch rsi is looking great we flipped bullish and are coming out of oversold areas! RSI aswell coming up and im looking for a cross of the 50 mark indicating a uptrend! The market for the most part is following BTC and that is very key right now also. Not financial advice just my opinion


Lot of reasons to like chainlink right now KRAKEN:LINKEUR
OK marines, In my view there's a lot of factors lining up for Link to start its next leg. Now BTC please play nice!
• Approaching middle of pitch fork which has acted as S/R in the past
• Approaching prior highs which are also marked by the 1.0 fib extension which dates back to the highs of Feb 20 around $4.50
• Similar RSI to where we launched from at end of December
I wouldn't mind if price came further down to the $20-22 area and filled out the wick from that crash low, but I think its a good time to start layering in on a swing trade long.

Link Looking to rebound after closing daily on 0.2 FIBWe just closed todays candle on/above the 0.2 FIB and are currently sitting above it looking for a bit of a rebound, The stoch rsi is starting too bottom our in oversold and looks like we could be seeing a switch to bullish soon. our EMA ribbons have been pushing down a little bit obviously due to recent price action around the market, it doesn't look like we are seeing a twist at all just some downward movement. The Coppock Curve is getting real close to the bottom, indicating potentially some recovery soon. Bitcoin will move the market / altcoins so always keep an eye on BTC. NFA just my opinion.
