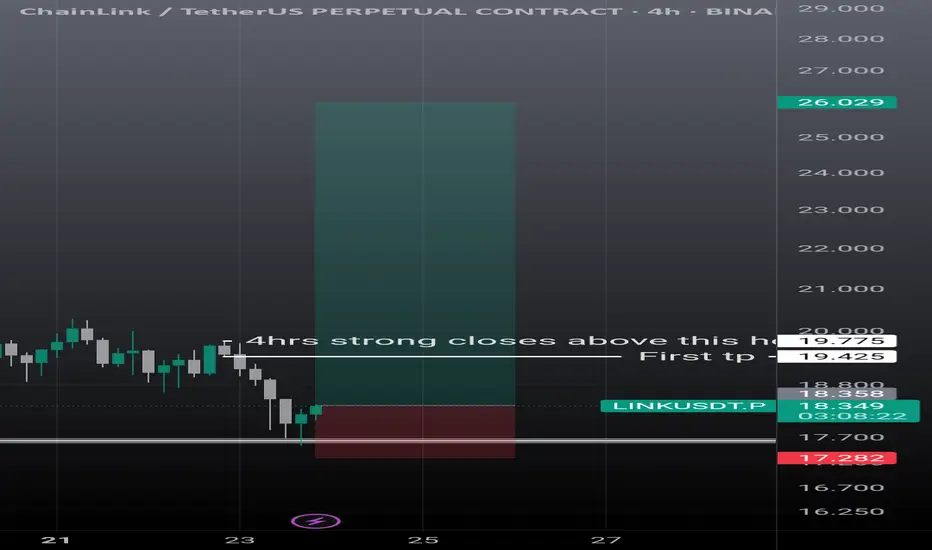
Linkusdt scalp n swing setupLink showing some strong momentum. On 4hrs it can go easily 19.30, then if it breaks strong and closes above the mentioned candle it's next stop is 26$. Must use sl as it can take further correction is it failed to break the mentioned level.
Chainlinkusdt
Chainlink (LINK) Trapped Between $18–$20: Explosion Soon?Chainlink (LINK) has been in a strong uptrend for most of July, rallying from under $13 to a recent high of $20.28. This level acted as a clear resistance where a "Sell" signal has been triggered, suggesting a temporary exhaustion of bullish momentum. After this peak, price has pulled back slightly and is now trading near $19.08, hovering between key levels — with $20.28 acting as resistance and $17.98 as nearby support. This positioning confirms that LINK is currently rangebound and consolidating.
Structurally, the price made a series of higher highs and higher lows, with a steep bullish leg between July 14 and July 21. However, recent candles show signs of hesitation. There's less conviction in the current move, indicating that traders are likely waiting for either a breakout above resistance or a breakdown below support to commit to the next move.
The range between $17.98 and $20.28 is now the battlefield. A clean break above $20.28 would signal bullish continuation, with the next logical upside target being around $22 or higher. But if price fails to hold $17.98, it may retrace deeper — first toward $15.66 (the breakout base), and then possibly down to $14.08 or $13.39 where previous accumulation occurred.
Volume appears to have faded slightly during the recent leg up, which adds weight to the idea that LINK needs a consolidation phase before resuming any meaningful trend. There's also a previous "Buy" signal near $15.66 that aligns with the last breakout zone, making this a key level to watch if bears regain short-term control.
Right now, it's a no-trade zone unless the market shows clear direction. Traders with a neutral stance should wait for confirmation — either a strong breakout above $20.28 with a decisive candle and follow-through, or a breakdown below $17.98 which opens up downside opportunity. Until then, LINK is best treated as being in a mid-cycle pause, building up energy for its next major move.

Link Update (4H) Correction Has StartedIn my previous analysis, I presented two different perspectives on LINK.
On lower timeframes, LINK completed its 5-wave impulsive structure, but in doing so, it invalidated the macro reversed Head and Shoulders pattern—rendering it no longer valid.
Currently, LINK has entered a classic A-B-C corrective phase, signaling temporary market weakness. If the price drops below the key S&R zone (highlighted in pink), I expect a swift move down towards the $13.45 level.
This target coincides with a well-defined demand zone, adding further confluence to the short thesis.
📉 Outlook: Favorable for short positions upon confirmation of breakdown.
— Thanks for reading.

ChainLink (LINK) Bulls Eye $18 as Supertrend Flips Green📈 Market Structure & Trend Overview
• Price is holding a clear ascending trendline, acting as dynamic support.
• The recent bounce from Support 1 at $14.93 indicates that bulls are defending this level aggressively.
• Price is now approaching the mid-zone between support and resistance with bullish momentum resuming.
🧠 Supertrend Indicator Analysis
• The Supertrend is flipping bullish, or recently has, placing the green band below the current price, which confirms the initiation of a buy signal.
• The last bearish wave was rejected near Support 1, and since the Supertrend held as support, it further validates a long bias.
• Supertrend aligning with the trendline and support level adds multi-layered confirmation to this setup.
✅ Trade Setup (Long)
• Entry: $15.96 (current market price at time of analysis)
• Stop Loss: $14.80 (just below Support 1 and trendline structure)
• Take Profit: $18.00 (previous swing high and resistance zone)
• Risk-to-Reward Ratio (RRR): ~1:1.54
• Time Horizon: 2 to 7 days for target to be achieved
📌 Key Technical Highlights
• Support 1 ($14.93): Tested and held multiple times, confirmed by Supertrend flip.
• Support 2 ($13.24): Deeper fallback zone; breach would invalidate bullish bias.
• Resistance ($18.00): Swing high and Fibonacci alignment, making it a strong TP zone.
• Supertrend: Currently bullish; enhances trade confidence with trend-following confirmation.

Chainlink Analysis for Intraday TradingWait for the entries to be filled from both side, I will prefer short entry here, Reason btc looks too weak now, USDT.D has reached the strong bullish zone and can hit 4.80-4.89% zone for correction. While I will short BTC from 105-106K SL if 4 candle closes above 107.8K, at the same time I will open short positions on ETH, and Link SL when BTC hits the SL.

Chainlink - 1W
Overview
Chainlink (LINK) is experiencing an interesting price movement on the weekly timeframe, forming a Symmetric Triangle pattern. This pattern is a strong technical formation that often precedes significant price movements upon breaking one of its sides. This analysis focuses on the pattern, key resistance and support levels, and price expectations if the resistance is broken.
Symmetric Triangle Pattern
Pattern Formation: The Symmetric Triangle forms as price volatility gradually contracts, creating two converging trendlines (a descending resistance line and an ascending support line). On Chainlink’s weekly timeframe, this pattern is clearly visible, indicating a consolidation period before a major price move.
Time Duration: The pattern has persisted for several weeks, enhancing its technical significance, as longer-term patterns are generally more reliable.
Trading Volume: A gradual decrease in trading volume is observed as the price approaches the triangle’s apex, a typical behavior reflecting traders’ anticipation of an imminent breakout.

Chainlink Set for 100% Surge Amidst Strategic Partnership The Price of Chainlink ( CRYPTOCAP:LINK ) is set for a comeback with a potential 100% surge in sight- amidst striking a potential partnership with the Abu Dhabi Global Market (ADGM).
The asset is currently depicting multiple signs of a bullish renaissance with the daily price chart hinting at a bullish symmetrical triangle. Similarly, the daily Relative Strength Index (RSI) is at 52 hinting at a potential bullish surge incoming coupled with the falling wedge depicted in the chart.
Chainlink ( CRYPTOCAP:LINK ) entered into a strategic partnership with the Abu Dhabi Global Market (ADGM) to promote tokenization in the UAE. As part of the collaboration, Chainlink and ADGM have signed an MoU to create a secure and legally sound environment for asset tokenization in financial markets.
Significantly, ADGM will provide regulatory guidance, frameworks for secure tokenization, and expertise in asset tokenization. At the same time, Chainlink will contribute its technical expertise, blockchain-based solutions, and tokenization infrastructure.
What Is Chainlink (LINK)?
Founded in 2017, Chainlink is a blockchain abstraction layer that enables universally connected smart contracts. Through a decentralized oracle network, Chainlink allows blockchains to securely interact with external data feeds, events and payment methods, providing the critical off-chain information needed by complex smart contracts to become the dominant form of digital agreement.
Chainlink Price Live Data
The live Chainlink price today is $15.47 USD with a 24-hour trading volume of $326,378,851 USD. Chainlink is up 2.47% in the last 24 hours, with a live market cap of $10,167,634,903 USD. It has a circulating supply of 657,099,970 LINK coins and the max. supply is not available.

My current LINK charts with estimated April 'flash crash' levelsHere is my current LINK chart, which I recently went over in detail. It assumes that the bottom isn't in on the 4th wave. If the bottom is in and price is moving into the 5th wave, you can simply adjust the 4th wave bottom to the previous low accordingly.
It also includes the likely level that would be hit during the April "flash crash" around the pattern’s 3rd support level line and FVG (fair value gap), as well as the likely areas above that it will need to break through in order to reach new all-time high territory—assuming that's even possible in this cycle.
Keep in mind that the "flash crash in April" is a theory of mine and may or may not come to fruition, or could be off in timing. And while these levels may be likely, they may not actually be the levels that get hit, even if the thesis itself is correct.
Good luck, and always use a stop loss!

The Bull Market Is Just Starting For Chainlink LINKHello, Skyrexians!
During this bull run the best performance has been showed by the old high cap coins, BINANCE:LINKUSDT is not an exception. It had a textbook accumulation and then growth for 5x+ from the bottom. Is it enough or the main gains ahead.
Let's take a look at the weekly time frame. The first wave from the bull run start we can count as a wave 1. Then retracement has happened in the wave 2 and currently asset is forming wave 3. Looks like now price is finishing the wave 2 inside the larger wave 3. It would be better to see the green dot on the Bullish/Bearish Reversal Bar Indicator like we have seen previously, but the zone is already great to buy this asset. Target is located between 1 and 1.61 Fibonacci extensions which corresponds the price range between $40 and $50.
Best regards,
Skyrexio Team
___________________________________________________________
Please, boost this article and subscribe our page if you like analysis!

LINK/USDT 1H: Accumulation in Discount Zone – Targeting $22 NextLINK/USDT 1H:Analysis
🚀 Follow me on TradingView if you respect our charts! 📈 Daily updates!
Confidence Level: 8/10
Current Market Structure:
Price consolidating at $18.89, positioned between the Fair Value Gap (FVG) at $20.00 and Previous Day Low (PDL) at $18.40.
RSI at 45, showing hidden bullish divergence, indicating potential upside.
Market Makers accumulating in the discount zone, preparing for a liquidity move higher.
Trade Setup:
Position: Long
Entry Zone: $18.80 - $18.90 (current equilibrium).
Targets:
T1: $20.00 (FVG fill).
T2: $22.00 (premium zone).
Stop Loss: Below $18.40 (key invalidation level).
Risk Score:
7/10 – Favorable risk-to-reward, but PDL must hold for confirmation.
Market Maker Intent:
Accumulation pattern visible in the discount zone, signaling potential upside.
Liquidity above $20.00 likely being targeted.
Strong support at $18.40 suggests a low-risk entry for longs.
Key Levels:
Resistance: $20.00, $22.00.
Support: $18.40, $17.50.
Fair Value Gap: $19.80 - $20.20.
Recommendation:
Long positions favorable with tight stops below $18.40.
Watch for confirmation at PDL—a strong bounce increases probability of upside.
Manage risk carefully and wait for price action above $19.50 for added confidence.
Confidence Level:
8/10 – Market Makers accumulating, but PDL must hold for bullish confirmation.
🚀 Follow me on TradingView if you respect our charts! 📈 Daily updates!

LINK/USDT 1H: Accumulation or More Downside? Watch $19.50!LINK/USDT 1H: Analysis
🚀 Follow me on TradingView if you respect our charts! 📈 Daily updates!
Current Market Structure:
Bearish trend intact, with price forming lower lows and lower highs, currently at $19.06.
RSI at 39.07 showing potential hidden bullish divergence, but still below neutral (50).
Key Levels:
Resistance: $20.00 (psychological barrier).
Support: $18.50 (previous reaction low).
Premium Zone: $26.00-$27.00.
Discount Zone: $15.00-$16.00.
Smart Money Analysis:
Market Makers likely accumulating at current levels, but no clear reversal yet.
Volume profile thinning, indicating potential for an impulse move soon.
Structural shift required before considering aggressive long positions.
Risk Score:
6/10 – Medium risk as market structure remains weak.
Recommendation:
Wait for confirmation. Current setup lacks confidence (below 7/10) for a full trade recommendation.
Look for bullish reversal candles above $19.50 before considering longs.
Patience is key—rushing in before confirmation could lead to unnecessary risk.
Confidence Level:
6/10 – Signs of accumulation, but structure remains bearish.
🚀 Follow me on TradingView if you respect our charts! 📈 Daily updates!

LINK/USDT 1H: Oversold & Accumulating – Ready for a Reversal?LINK/USDT 1H Chart Analysis
🚀 Follow me on TradingView if you respect our charts! 📈
Current Market Structure:
Bearish momentum continues after a recent breakdown.
RSI at 28.70, showing oversold conditions.
Hidden Bullish Divergence forming between RSI and price action.
Smart Money Activity:
Market Makers engineered a liquidity sweep below $20.50.
Accumulation likely occurring at the discount zone.
Premium zone identified between $25.50-$26.00.
Key Levels:
Entry Zone: $20.50 - $20.80 (discount zone).
Targets:
T1: $22.30 (FVG fill).
T2: $23.50 (Equilibrium zone).
Stop Loss: Below $19.80 (to protect downside risk).
Risk Score:
8/10 (High volatility – strong R:R setup).
Market Maker Intent:
Likely accumulating at current levels before the next leg up.
Liquidity grab appears complete, suggesting a potential reversal.
No short entries recommended due to oversold conditions.
Recommendation:
Long positions are favorable within the $20.50 - $20.80 range.
Wait for reversal confirmation before entering.
Monitor volume and price action near $22.30 resistance for breakout strength.
Confidence Level:
7/10 for potential bullish reversal.
🚀 Follow me on TradingView if you respect our charts! 📈

Chainlink Could Target $30 Once It Breaks Descending Triangle
Chainlink (LINK), the leading decentralized oracle network, has been consolidating within a descending triangle pattern on its price chart. This technical formation often signals a period of indecision among market participants, but it also carries the potential for a significant breakout. If LINK successfully breaks above the descending trendline, it could ignite a powerful rally, potentially propelling the price towards the $30 mark.
Understanding the Descending Triangle
A descending triangle is a bearish chart pattern characterized by a series of lower highs and relatively flat lows. It suggests that selling pressure is gradually increasing, while buying pressure remains relatively weak. However, the flat lows indicate that there is still significant support for the asset.
In the case of Chainlink, the price has been consolidating within this descending triangle for several weeks. This period of consolidation allows market participants to accumulate positions and prepare for a potential breakout.
Factors Fueling a Potential Rally
Several factors could contribute to a bullish breakout and propel Chainlink's price towards $30:
• Growing Adoption: Chainlink's technology continues to gain traction across various sectors, including DeFi, gaming, and enterprise applications. As more projects integrate Chainlink's oracles, the demand for LINK tokens is likely to increase.
• Technological Advancements: Chainlink is constantly evolving and improving its technology, enhancing its security, scalability, and interoperability. These advancements can attract new users and drive further adoption.
• Favorable Market Conditions: A broader bullish trend in the cryptocurrency market could provide a significant tailwind for Chainlink. If Bitcoin and other major cryptocurrencies experience a sustained rally, Chainlink could benefit from increased investor interest and capital inflows.
• Technical Breakout: A successful breakout above the descending trendline would be a strong technical signal, confirming the bullish sentiment and attracting more buyers to the market.
Technical Analysis
Technical analysis provides several clues about the potential for a bullish breakout.
• Volume: A surge in trading volume accompanying a breakout would significantly increase the likelihood of a sustained rally.
• Moving Averages: A move above key moving averages, such as the 50-day and 200-day moving averages, would further strengthen the bullish case.
• Relative Strength Index (RSI): The RSI is a momentum indicator that can help identify overbought or oversold conditions. A breakout accompanied by a rising RSI would suggest strong bullish momentum.
Potential Challenges and Risks
While the outlook for Chainlink appears promising, it is crucial to acknowledge potential challenges and risks:
• Competition: Chainlink faces competition from other decentralized oracle networks and emerging technologies.
• Regulatory Uncertainty: The regulatory landscape for cryptocurrencies remains uncertain, and any negative regulatory developments could impact Chainlink's price.
• Market Volatility: The cryptocurrency market is highly volatile, and sudden price swings can significantly impact Chainlink's price.
Investment Considerations
Investing in cryptocurrencies carries significant risks, including the risk of losing all or part of your investment.
• Conduct thorough research: Understand the technology behind Chainlink, its potential use cases, and the risks involved.
• Diversify your portfolio: Don't invest all your funds in a single cryptocurrency.
• Invest only what you can afford to lose: Avoid investing more than you can afford to lose financially.
• Stay informed: Keep abreast of the latest developments in the Chainlink ecosystem and the cryptocurrency market as a whole.
Conclusion
Chainlink has the potential to play a crucial role in the future of decentralized finance and blockchain technology.
• If it successfully breaks out of the descending triangle pattern and gains traction in the broader market, it could experience significant price appreciation.
• However, investors should carefully consider the risks involved and conduct thorough research before making any investment decisions.
Disclaimer: This article is for informational purposes only and does not1 constitute financial advice.
• Investing in cryptocurrencies2 involves significant risks, and you should carefully consider your investment objectives, financial situation, and risk tolerance before making any investment decisions.
Note: This article provides a general overview of Chainlink and its potential.
• The cryptocurrency market is dynamic and subject to rapid change.
• It is essential to conduct independent research and consult with a qualified financial advisor before making any investment decisions.
Disclaimer: This article is for informational purposes4 only and does not constitute financial advice.
• Investing in cryptocurrencies5 involves significant risks, and you should carefully consider your investment objectives, financial situation, and risk tolerance before making any investment decisions.6

Chainlink (LINK) Cup & Handle BULLISH!Chainlink (LINK) has formed a Cup & Handle pattern with a bullish scenario. The breakout has formed a bullish trend for the bulls creating pressure to push the price to the upside. In addition, the bears have pulled the price back down towards the neckline which acts as a previous Upper Resistance line.
Bid Zone= $19.27 - $22.87
Expect price to continue to the upside with followed buying momentum from the bulls. After this pullback, Chainlink will now retest previous "All-Time High" dated back from 2021.
Target= $52.28

LINK | ALTCOINS | Chainlink pushes towards 40$Link has seen some great increases after another bump on BTC.
It's likely that this will lead to another mini-cycle, and push the price of Chainlink even higher towards 40$ which is the next major resistance mark.
I'm especially optimistic for Link and other alts once Ethereum has made a new ATH. More on that thought here:
_____________________
BINANCE:LINKUSDT

Chainlink's Bullish Surge: A Potential Rally on the HorizonChainlink (LINK), the leading decentralized oracle network, has been making significant strides in the cryptocurrency market, captivating the attention of investors and analysts alike. The token's price has surged to a multi-year high, surpassing the $30 mark, as hopes for a substantial 80+% rally continue to gain momentum.
The Driving Forces Behind Chainlink's Rally
Several key factors have contributed to Chainlink's bullish momentum:
1. Increased Institutional Adoption:
o A growing number of institutional investors and financial institutions are recognizing the value of Chainlink's decentralized oracle network.
o This increased adoption has led to a surge in demand for LINK tokens, driving up the price.
2. Expanding Ecosystem:
o Chainlink's ecosystem continues to expand rapidly, with new projects and dApps integrating the oracle network.
o This growing ecosystem strengthens Chainlink's position as a critical infrastructure for the blockchain industry.
3. Positive Market Sentiment:
o The broader cryptocurrency market has been experiencing a period of positive sentiment, with many tokens seeing significant price gains.
o Chainlink has benefited from this overall market optimism, as investors seek out high-potential projects.
4. Technical Analysis:
o Technical analysts have identified bullish patterns on Chainlink's price charts, suggesting that the token could continue its upward trend.
o Key technical indicators, such as the Relative Strength Index (RSI) and Moving Averages, are signaling strong buying pressure.
The Potential for an 80+% Rally
While the cryptocurrency market is inherently volatile, many analysts believe that Chainlink has the potential to experience a significant price surge of up to 80+% from its current levels. This bullish outlook is based on several factors:
• Strong Fundamentals: Chainlink's robust technology, growing ecosystem, and increasing institutional adoption provide a solid foundation for future growth.
• Market Sentiment: The overall positive sentiment in the cryptocurrency market can further fuel Chainlink's rally.
• Technical Analysis: Bullish technical indicators suggest that Chainlink's price could continue to climb.
Cautious Optimism and Risk Management
While the potential for a substantial price increase is exciting, it's important to approach the cryptocurrency market with caution and practice sound risk management. Here are some key considerations for investors:
• Diversification: Diversifying your investment portfolio across various cryptocurrencies and other asset classes can help mitigate risk.
• Dollar-Cost Averaging (DCA): Investing a fixed amount of money in Chainlink at regular intervals can reduce the impact of market volatility.
• Risk Tolerance: Assess your risk tolerance and only invest an amount that you can afford to lose.
• Stay Informed: Keep up-to-date with the latest news and developments in the cryptocurrency market, especially regarding Chainlink.
In conclusion, Chainlink's recent price surge and the potential for an 80+% rally have generated significant excitement among investors. While the future of the cryptocurrency market is uncertain, Chainlink's strong fundamentals and growing adoption position it as a promising investment opportunity. However, it's crucial to conduct thorough research, exercise caution, and implement sound risk management strategies.

Chainlink Poised for a 20% Upswing This Weekend?
Chainlink (LINK), the leading decentralized oracle network, has been on a remarkable run in recent weeks. The cryptocurrency has outperformed the broader market, surging by over 22% in the past month. This impressive performance has sparked renewed interest in LINK, with many investors wondering if the token can reach new heights in the coming months.
What’s Behind Chainlink’s Strong Performance?
Several factors have contributed to Chainlink’s recent surge. Firstly, the increasing adoption of decentralized finance (DeFi) protocols has created a growing demand for reliable and secure oracle networks. Chainlink, with its robust infrastructure and proven track record, has emerged as the go-to solution for many DeFi projects.
Secondly, the rise of Web3 and the metaverse has also fueled demand for Chainlink’s services. As more and more applications are built on blockchain technology, the need for real-world data feeds becomes increasingly critical. Chainlink’s ability to provide accurate and timely data from off-chain sources has made it an indispensable tool for Web3 developers.
Finally, the overall bullish sentiment in the cryptocurrency market has also positively impacted Chainlink’s price. As Bitcoin and other major cryptocurrencies continue to rally, investors are looking for alternative investment opportunities, and Chainlink has emerged as a promising contender.
Will LINK Price Reach $50 in 2024?
While it’s difficult to predict the exact price of any cryptocurrency, many analysts believe that Chainlink has the potential to reach $50 in 2024. However, several factors will determine whether this target can be achieved.
First, the continued growth of the DeFi and Web3 ecosystems will be crucial. As more and more projects adopt Chainlink, the demand for the token will increase, driving its price higher.
Second, the overall market sentiment will play a significant role. If the broader cryptocurrency market remains bullish, Chainlink is likely to benefit from the positive sentiment. However, a market downturn could negatively impact the token’s price.
Third, Chainlink’s technical performance will be important. The network needs to maintain high uptime and low latency to ensure the reliability of its services. Any technical issues or security breaches could damage the token’s reputation and negatively impact its price.
Chainlink’s Technical Outlook
From a technical perspective, Chainlink appears to be in a strong uptrend. The token has broken above several key resistance levels, and the momentum indicators suggest that the bullish trend is likely to continue. However, it’s important to note that the cryptocurrency market is highly volatile, and prices can fluctuate rapidly.
Conclusion
Chainlink’s recent performance has been impressive, and the token has the potential to reach new heights in the coming months. However, investors should approach the cryptocurrency market with caution and be prepared for potential volatility. It’s important to conduct thorough research and only invest what you can afford to lose.
As always, it’s crucial to stay updated on the latest news and developments in the cryptocurrency market. By understanding the factors that drive Chainlink’s price, investors can make informed decisions and maximize their returns.

LINK Leap to 2021 Heights: Trump's World Liberty Fuels the Rally
Chainlink (LINK), the decentralized oracle network, has experienced a significant price surge, reaching levels not seen since 2021. This bullish momentum has been fueled by a combination of factors, including increased institutional adoption and a recent purchase by a notable entity.
A Bullish Surge
LINK's price has rallied to the $30 mark, a level that has not been breached in several years. This substantial price increase can be attributed to several key factors:
1. Institutional Adoption: Chainlink has gained significant traction among institutional investors and financial institutions. Its role in providing real-world data to smart contracts has made it a crucial component of various blockchain-based applications.
2. Growing DeFi Ecosystem: The decentralized finance (DeFi) sector continues to expand rapidly, and Chainlink plays a vital role in powering many DeFi applications. As more DeFi projects emerge, the demand for Chainlink's oracle services is expected to increase.
3. Strategic Partnerships: Chainlink has forged strategic partnerships with major players in the blockchain industry, further solidifying its position as a leading decentralized oracle network.
4. Positive Market Sentiment: The broader cryptocurrency market has been experiencing a period of bullish sentiment, with many digital assets witnessing significant price gains. This positive market mood has also benefited Chainlink.
Trump's World Liberty Adds to the Momentum
A recent development that has further fueled LINK's rally is the acquisition of Chainlink tokens by a prominent entity associated with a former US president. This move has sparked significant interest and speculation within the crypto community.
While the specific details of this purchase remain undisclosed, it highlights the growing appeal of Chainlink to high-profile investors. Such institutional investments can have a substantial impact on a cryptocurrency's price and market capitalization.
The Future of Chainlink
As Chainlink continues to innovate and expand its ecosystem, its potential for future growth remains promising. However, it is important to note that the cryptocurrency market is inherently volatile, and prices can fluctuate significantly.
Investors should conduct thorough research and consider their risk tolerance before investing in LINK or any other cryptocurrency. Diversification is also crucial to manage risk effectively.
While the recent price surge is undoubtedly exciting, it's essential to maintain a realistic perspective. Chainlink's long-term success will depend on its ability to deliver reliable and secure oracle services, adapt to evolving technological trends, and attract a wider range of users and developers.
As the blockchain industry continues to mature, Chainlink has the potential to play a pivotal role in shaping the future of decentralized applications.

Is Chainlink (LINK) the Next Big Investment Opportunity?Major Crypto Project's Strategic Move Fuels Chainlink's Rally
Chainlink (LINK), a leading decentralized oracle network, has experienced a significant surge in value following a strategic investment from Trump’s World Liberty cryptocurrency project. The investment announcement has ignited a wave of optimism within the crypto community, propelling LINK's price to a 15.9% increase since Wednesday.
The Power of Oracles
At the heart of Chainlink's success lies its role as a reliable bridge between the traditional financial world and the decentralized blockchain ecosystem. Oracles, such as Chainlink, provide real-world data to smart contracts, enabling them to execute complex financial transactions and trigger events based on external conditions.
By leveraging a decentralized network of nodes, Chainlink ensures data accuracy, security, and tamper-resistance. This has made it a crucial component for various decentralized applications (dApps), including DeFi protocols, insurance platforms, and gaming platforms.
The Impact of the Investment
This strategic move has had a ripple effect on the broader crypto market. As more and more high-profile projects adopt Chainlink, the demand for LINK tokens is likely to increase. This, in turn, could lead to further price appreciation and strengthen Chainlink's market dominance.
Technical Analysis: A Bullish Outlook
From a technical perspective, LINK's recent price action is encouraging. The 15.9% surge has broken through key resistance levels, indicating a strong bullish momentum. The Relative Strength Index (RSI) is currently in the overbought territory, suggesting that a short-term correction may be on the horizon. However, the overall trend remains bullish, with the potential for further upside in the coming weeks and months.
Key Takeaways:
• Chainlink's role as a reliable oracle network is crucial for the growth of the DeFi and dApp ecosystem.
• The recent investment from is a significant endorsement of Chainlink's technology and potential.
• LINK's price has surged 15.9% in the past few days, driven by bullish sentiment and technical factors.
• While a short-term correction may be possible, the overall trend for LINK remains bullish.
Conclusion
Chainlink's recent surge, fueled by a strategic investment from a prominent crypto project, highlights the growing importance of decentralized oracles in the blockchain industry. As the demand for reliable data feeds continues to rise, Chainlink is well-positioned to capitalize on this opportunity and further solidify its market leadership. Investors should closely monitor LINK's price action and consider its potential for long-term growth.
Disclaimer: This article is for informational purposes only and should not be construed as financial advice. Always do your own research and consult with a financial advisor before making investment decisions.

Is Chainlink Set to Reach a $30+ Target with t Lightchain AIChainlink's Recent Surge and Future Outlook
Chainlink (LINK), the leading decentralized oracle network, has been making significant strides in the cryptocurrency market. Recently, the LINK token recorded a 35-month high, sparking renewed interest and speculation about its future price trajectory. As the cryptocurrency market continues to evolve, analysts are optimistic about Chainlink's potential to reach new heights, with some predicting a price target of $30+ shortly.
The Power of Oracle Networks
To understand Chainlink's value proposition, it's essential to grasp the role of oracles in the blockchain ecosystem. Smart contracts, the backbone of decentralized applications (dApps), are self-executing contracts with the terms of the agreement directly written into code. However, smart contracts are limited to on-chain data, preventing them from accessing real-world information like stock prices, weather data, or sports scores.
Oracle networks bridge this gap by providing smart contracts with reliable and tamper-proof off-chain data. Chainlink stands out as a premier oracle network due to its decentralized nature, robust security, and extensive network of data providers.
Lightchain AI: A Catalyst for Chainlink's Growth
Lightchain AI, a cutting-edge blockchain platform, is poised to further enhance Chainlink's capabilities and drive its price appreciation. By leveraging advanced AI and machine learning techniques, Lightchain AI aims to revolutionize the way smart contracts interact with the real world.
Here's how Lightchain AI can benefit Chainlink:
• Enhanced Data Accuracy and Reliability: Lightchain AI can analyze vast amounts of data to identify patterns and anomalies, improving the accuracy and reliability of the data provided by Chainlink oracles.
• Advanced AI-Powered Oracles: By integrating AI into its oracle network, Chainlink can develop more sophisticated oracles capable of making complex decisions and predictions.
• Increased Adoption of Chainlink: As Lightchain AI gains traction, it will likely increase the demand for Chainlink's oracle services, driving the adoption of LINK tokens.
Chainlink Price Forecast for 2025
While predicting the exact price of a cryptocurrency is challenging, several factors suggest that Chainlink has the potential to reach significant price targets in 2025:
• Strong Fundamental Performance: Chainlink's robust technology, growing ecosystem, and increasing adoption by developers and enterprises solidify its position as a leading oracle network.
• Bullish Market Sentiment: A bullish market sentiment, fueled by factors like institutional adoption, regulatory clarity, and technological advancements, can significantly impact Chainlink's price.
• Lightchain AI's Synergistic Effect: The integration of Lightchain AI's advanced capabilities can further enhance Chainlink's value proposition and drive demand for LINK tokens.
Conclusion
Chainlink's recent price surge and the potential of Lightchain AI to revolutionize the blockchain industry make it an exciting investment opportunity. However, it's crucial to approach any investment with caution and conduct thorough research. As the cryptocurrency market continues to evolve, Chainlink and Lightchain AI are well-positioned to shape the future of decentralized applications and smart contracts.
Disclaimer: This article is not financial advice. Please do your own research before making any investment decisions.

LINKUSD looking greatHello fellow traders,
today we look at LINK.
LINK follows a clearly structured path:
Base -> Phase 1 (building strength) -> Phase 2 (testing previous ATH) -> Phase 3 (parabolic run with blow-off top)
Once the top is in, base is found at previous top.
We are currently in Phase 2.
If past is any indication, a run to ATH is likely, getting some resistance there and then breaking it, followed by a parabolic run and blow-off top.
This is not a financial advice, do your own research.
Good luck!

Chain Link BullishBased on the previous analysis, we were waiting for the coin to break out of the ranging market so that we can have a good entry position.
I do anticipate that the price will continue with the bullish momentum, considering that it has retested the upper trendline.
My entry position will be at 15.00, SL at 12 and target at 22

Analyzing the Long Link: 200-Day Moving Average and Bullish MomeChainlink (LINK) has been making waves in the cryptocurrency market, particularly after its recent price action. The token, which facilitates secure and reliable data exchange between smart contracts and real-world data sources, has shown promising signs of a bullish trend.
LINK's interaction with the 200-day Moving Average (MA) is a key indicator of this bullish momentum. This long-term moving average often is a significant support or resistance level for cryptocurrencies. When a cryptocurrency bounces back from this level after a correction, it can signal a strong bullish reversal.
In the case of LINK, the token experienced a notable correction earlier this year. However, it has since rebounded and successfully reclaimed the 200-day MA. This bullish signal has ignited optimism among traders and analysts alike.
Several factors contribute to the bullish sentiment surrounding LINK:
1. Strong Fundamentals: Chainlink's underlying technology and growing adoption within the DeFi ecosystem continue to drive its value. The platform's ability to provide reliable and tamper-proof data is essential for developing decentralized applications.
2. Institutional Interest: Institutional investors are increasingly recognizing the potential of blockchain technology, and Chainlink is emerging as a key player in this space. This growing institutional interest can lead to increased demand for LINK tokens.
3. Technical Analysis: Technical indicators suggest that LINK is poised for further upside. The Relative Strength Index (RSI) is currently in oversold territory, indicating potential buying opportunities. Additionally, the Moving Average Convergence Divergence (MACD) is crossing above its signal line, which is a bullish signal.
4. Market Sentiment: The overall market sentiment for cryptocurrencies has been positive recently, with Bitcoin and Ethereum leading the charge. This positive sentiment can spill over into other altcoins, including LINK.
While the bullish outlook for LINK is promising, it's important to remember that the cryptocurrency market is highly volatile. Traders should exercise caution and consider risk management strategies when investing in LINK or any other cryptocurrency.
Potential Upward Targets:
If LINK continues its bullish momentum and breaks above key resistance levels, it could potentially target the following price levels:
• Short-term target: $10
• Medium-term target: $15
• Long-term target: $20
Key Support Levels:
Traders should keep an eye on the following support levels:
• Immediate support: $7
• Strong support: $5
Conclusion:
LINK's recent bounce back from the 200-day MA, coupled with strong fundamentals and positive technical indicators, suggests a strong bullish trend. While the cryptocurrency market is inherently volatile, LINK's potential for growth makes it an attractive investment for both short-term traders and long-term investors.
Disclaimer:
This article is for informational purposes only and should not be construed as financial advice. It's essential to conduct thorough research and consider consulting with a financial advisor before making any investment decisions.
