AUD/USD potential bullish movePrice broke descending channel. It retested the last high and continued to go up. Then price formed bullish flag pattern and it is possible to see move up.
Channelbreak

AUDUSD to 0.60 in short orderThanks for viewing,
This is my tentative view on the AUDUSD pairing over the rest of the year.
FOREX loves to stay within a channel, this pairing is no exception. In my view the market weakness is about to steepen. What was trend-line support is now resistance.
Look there are a lot of pretty colours, so I must be right.
1. There is some weakness shown by the daily candle - doji with long wicks - its an indecision candle right at the 55EMA / upper trend-line of my new speculative channel (5 channel touches - the previous channel had 12 touches). A channel with less than 4 touches is speculative, this one is plausible.
2. I count wave 1 down (of wave (C)) - all five sub-divisions showing normal extensions and no overlap. Then there was another wave 1 and 2 (or (i) and (ii) to hunt all the stop-loss positions from people / organisations that were short. For the Elliot Wave viewpoint to hold this should result in even more volatile downward price movement (especially to stay within this much steeper channel) as wave 3 of wave (C) develops. Wave (iii) of wave 3 will be vertical and there will be a lot of gaps (that won't be filled for some time).
3 Since the start of 2021 everything above the 55EMA was over-valued (opaque red boxes) and most of the price action happened below the 55 EMA. Over the past 18 months, you would have been very profitable if you sold / shorted every time the price dropped below the 55EMA (eight out of 9 times at least). Now there is a good chance that the price won't be above the 55EMA for some months (traders catch on the the 55EMA upwards cross-over is a rally that should be sold into rather than bought).
4. There is precedent for this over years past. Once the price drops down below the channel, support becomes resistance and the price drop speeds up - making a new steeper channel. If this new channel is valid, the price will have to go almost vertical to stay within its bounds.
5. I put some support levels - based on previous price action - that if you don't believe in others do and will target to exit or reduce short positions / buy. I see a deep drop to 0.63-0.64 and the down to 0.6 or maybe a little bit further. This is based on
- channel support turned resistance,
- EMA resistance,
- 1.618 fib extensions of wave 1 and of wave (i) and (ii) of wave 3,
- Support swing lows,
- Channel support and resistance (from March to May 2020), and
- Elliot wave (wave (C) always has 5 sub-waves) and normally extends roughly 1:1 of wave (A) (sometimes less sometimes more).
So, what will I be looking for over the next days to a week?
1. Another indecision candle on below average or low volume, or an inverted hammer on low volume with a similar size wick to the upside. Followed by higher volume as the price drops from current levels. If you go short don't have the stop-loss too close to the swing high as professional traders will look to stop you out of the trade before resuming the down-trend.
2. My speculative channel to remain largely intact.
3. What is labelled as wave 1 swing low of 0.68290 to remain intact and to not be exceeded by subsequent pull-backs in price.
4. Watch out below.
Just look back in the past... In economic down-turns the money goes home (or goes to) to the US for safety. It doesn't stay in the AUD even though the bond return is marginally higher. I don't think this is a comment on the strength of the Aussie economy, it's just a flight to safety and away from uncertainty.
Protect those funds and happy trading. Anyone who is left at the end of my essay CHEERS. Hopefully, whether you follow EW, or channels, or fibonacci extensions, candle patterns, or support and resistance, or something else. I have still made a good case.

TTM: breaking out of bearish channelTTM ( Tata Motors , Indian conglomerate):
Nice set up here as we had a multi week bear channel and we're now breaking out of this channel, signalling a potential reversal to the upside.
To maintain this reversal, the price will need to remain above the line of the bear channel which is now acting as support. Note that price could go up a bit and retest the breakout point before really taking off.
I'm long with a stop at 26.19. All targets are on the chart. Two important targets are 29.13 which is the previous high, and 34.49.
Trade safe.

LKQ: breakout watchLKQ is currently at a resistance point of a downtrend channel that started back in December 2021.
Watch for LKQ to break that trend line. A break would mark a potential reversal of the downtrend.
I'll be entering a long position on the break, with a stop at 49.50.
The ideal situation is if we break 51.60/51.70, then maybe we can fill the small gap at 53/53.50.
Next targets are 56.48 and 60.14.
Trade safe

XMRUSDT retest the 0.618 Fibonacci level 🦐XMRUSDT on the 4h chart is trading inside an ascending channel.
The price after the yesterday's impulse is now trading in a choppy way with a retest of the 0.618 fibonacci support.
How can i approach this scenario?
I will wait for the EU market open and in the case that the price will break above the 4h resistance i will consider a long order according to the Plancton's strategy rules.
–––––
Keep in mind.
🟣 Purple structure -> Monthly structure.
🔴 Red structure -> Weekly structure.
🔵 Blue structure -> Daily structure.
🟡 Yellow structure -> 4h structure.
–––––
Follow the Shrimp 🦐

Usoil longsAm set to long oil as economic environment and the potential dollar devaluation may cause a spike in stocks, oil and crypto.
2.95R total of 3.95R if potential scale-in works as planned.
Like and Subscribe.

Eurnzd risky longsI will be going long on this risky setup for 3.14R or 4.14R at scale-in.....
Like and Subscribe

Federal Bank Channel Pattern near breakout on Daily TFFederal bank moving under channel pattern near to the breakout on a daily time frame if breaks good sign to go long

Gbaud two scenarios.... Choose one.If the bullish BREAKOUT occurs for an average 1:3.29 R I will long....if the bearish BREAKOUT occurs I will post my setup for that.
Like and Subscribe.

Usdcad looking for longs....Am looking at this setup to go long for a quick 1:2.90R....
Like and Subscribe.

DAX 40 Descending Channel On The Daily Hi Traders,
Having a look a the DAX today on the daily and 4 hours.
I have highlighted the descending channel that we have been in since mid-June. Descending channels are a great pattern and can usually present a great setup with a high risk to reward as the targets for the channel entries are usually up where the channel began.
We can classify this as a channel as we have a minimum of two taps on either side and if we adjust slightly to cover the wicks then we can say we have three taps on either side. I have shown these taps on the chart with small arrows indicating where the rice has touched the top and bottom of the channel.
I have added a line that cuts through the channel In a horizontal fashion. This line indicated previous support flipped resistance and we can see that price has respected this line. It was supported and when it flipped to the resistance we had a nice short bounce off of it. We need to see a break above this resistance to confirm bullish action.
Looking at the MACD below, we have divergence across the histogram. As the price continued to make lower lows, the histogram was trending upwards which indicated to us that the sellers have been weakening. This is usually a good sign when looking at descending channels in any time frame because once we see this partial divergence we can start waiting patiently for a break of the channel top.
Let's move on to the volume. Notice how the volume has decreased dramatically since we began the descending channel. If we see a break above the channel top, we need to see accompanying strong bullish volume.
THE SETUP
Usually, the way I would wait for a setup is, that we need to see the price break above the channel top as this is descending resistance. Once we see this impulsive break, we need to see the price close above the channel top confirming that this channel is indeed broken. As I am a patient break and retest trader and as this is on the daily time frame, I would wait for the price to come back down and retest the channel top as support before triggering a long position and trading the DAX to the upside. Targets would be around the 13700 level. This is a psychological whole number that adds confluence to the target as well as it being the price where the descending channel began.
This would be a long-term swing trade as this could take time to play out. Until we see that break, there is no point in even looking for a retest or long position in this time frame.
Until then, let's keep watching and keep our eyes open.
Hope you all have a wonderful Thursday.
See you all on the next one.
The Vortex Trader.

#USDCHF short, #forex4h time-frame:
price retraced to 0.786 of the previous fall.
1h time-frame:
during this correction movement, a channel formed.
A head and shoulder pattern shaped at top of the channel.
Breaking down the channel and the pattern in 1h time-frame convince me to start down-trend in 4h time frame.

Filusdt looking for longs.....If this setup plays out as shown, I will be going long after Brk and Retest for aa average 1:2.9.
Like and Subscribe.

Runeusdt waiting for this setup--LONG!IF this setup occurs I will be going long after the BREAKOUT & RETEST!
Like & Subscribe.

Waiting for this EURJPY setup!!!Am waiting for this setup to play out to take this good 1:4.18RR if the scale-in plays out as expected I will be looking at 1:5.18RR.
Like & Subscribe.

Am already SCALING- IN here....GBPJPY!!Guys am sorry, I couldn't post this trade yesterday when I entered cause I reached the limit for number of public posts in a day which is 10.
Though u can still enter as if the scale-in is ur new entry.....I advise u wait for another opportunity as there will be many more to cone if you are subscribed.
Am looking to get 1:4RR and this goes up to about 1:5if u add the scale-in
Like and Subscribe.

#usdcad longin daily time-frame there is a resistance area.
in 1h time-frame after a heavy up-trend, price created a down-trend channel.
if the down-trend channel breaks up, we can go long after pull-back and wait for breaking up the daily resistance area.
1st TP and stop loss shown on chart.

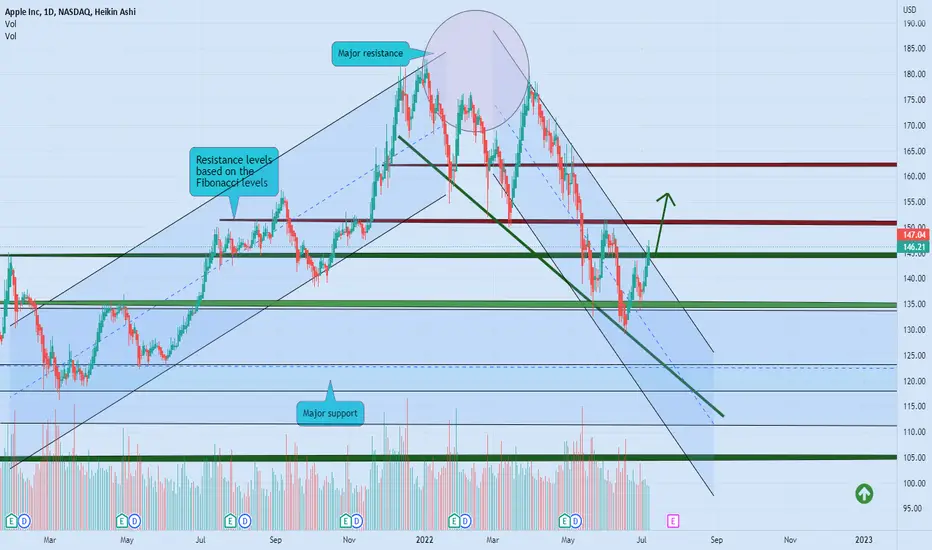
APPLE more gain 💡🚀Hello 🐋
Based on the chart after a long time, correction to the downside the price breaks the descending channel and many resistance areas to the upside, and we can see appropriate amount of volume for the price ✔️
if
the price doesn't break the major support area to the downside, we will see more gain 💡🚀
Please, feel free to share your point of view, write it in the comments below, thanks 🐋
Is INTC getting ready to break its channel?As with most stocks, INTC has been in a bearish trend beginning this year. Recently it has entered into a neat downward channel. Following the last test of the channel upper bound (denoted by the blue flag), a substantial decline occurred. This decline ended with a volume spike against the lower bound.
The last test of the lower bound (denoted by the green flag) is strikingly different than the previous. It lacked a volume spike and did not push the Stoch or MACD to new lows. In fact, during the latest retracement up, both indicators flashed signals of a bullish divergence.
It seems likely that this retracement following the latest lower bound will take us at least to the upper bound, if not break the channel.

Nzdusd---FAKEOUT or BREAKOUT??????NEITHER!.
Am not going to try to PREDICT where the market will go, only GOD can do that.
Am just going to wait for price to choose a direction and REACT to that.....
Am seeing that the fakeout option offers a high RR of 1:4, so am praying for that direction as I get to make more money.
Targets and stop on the chart, if am wrong I lose 1R, if am right I get 4R, and there is a 50:50 chance......so worth the risk!.
Like & Subscribe..... Let's SWING it, guys....

MANA/USDT : Moving into two channels BINANCE:MANAUSDT
Hello everyone 😃
Before we start to discuss, I'll be so glad if you share your opinion on this post's comment section and hit the like button if you enjoyed it!
$MANA is moving into double ascending channels and so, the lower trendline should be acting strong enough.
In terms of this, I'll be managing to locate my Longs in two separate strategies.
- Taking partial Long based on active stop-loss at $0.88 with a stop-loss at $0.83 as 4H close below.
- Taking Long based on invalidation when it gets the hold above the marked red zone.
So it's your choice, You know your risks better...
Hope you enjoyed the content I created, You can support us with your likes and comments!
Attention: this isn't financial advice we are just trying to help people with their vision.
Have a good day!
@Helical_Trades

Eurgbp----BREAKOUT----SELL!!!!!!A bearish breakout has been confirmed on the daily, swing traders can now jump on the highly probable downside continuation.
Targets on the chart.....
Pls Like & Subscribe to support my work, Thank you!.

2906 GBPJPY broken channel for sellers with RR>4Hello traders,
GJ is looking good to sell again on 4h chart with such broken channel.
Dowd to 162.3 as 1st TP.
161 as 2nd TP.
Good luck!!!
LESS IS MORE!
