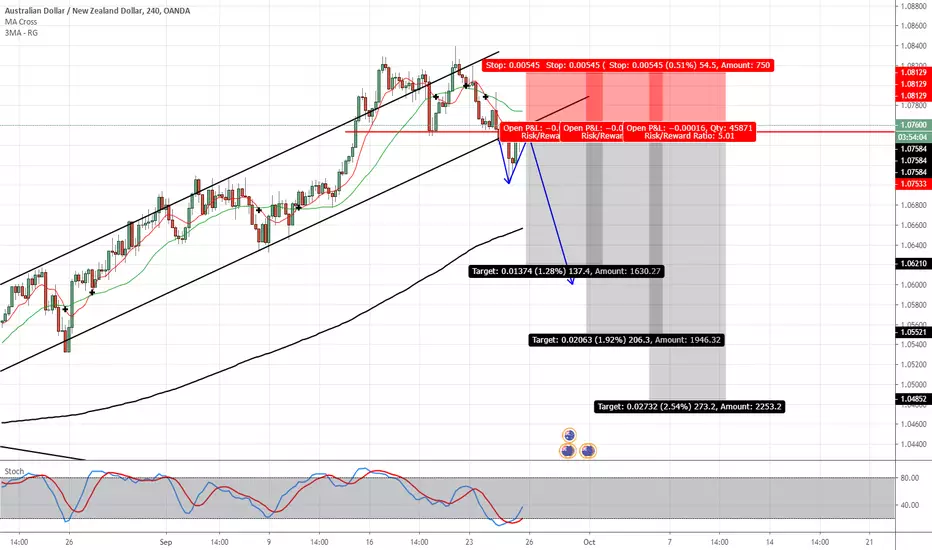
AUDNZD #Forex #ForexTrader #ForexTrading #ForexChartPossible AUDNZD shorting opportunity.
Broke diagonal channel and has come up to re-test previous support.
Using Fib levels as TP's
Any questions feel free to ask
Ben
#PipGainFx
Channelbreak
EURGBP - Potential Breakout and Trend REVERSALHi Traders!
The market was moving since very long in a healthy downtrend.
Now it broke the upper trendline and the 50 EMA too.
The market is out of the channel.
If it is a trend reversal, we're looking forward to buy the swing until the resistance at 0.89700.
If not, then it'll continue its trend.
Thanks and good luck :)!


USDCAD Weekly Showing Strong Bearish SignsDollarCad Weekly Formed A Bearish Engulfing CandleStick Formation after breaking out of its long term channel,
USDCAD already retraced back up creating a lower high and now we have this bearish candlestick formation with a counter trend line break.
the daily seems to be a little low already and might retrace, I don't plan getting out since its the beginning of the move from the weekly, what Im planing to do though if it retaraces on the daily I might look to add to my position.
if you not in yet I would say probably the best thing to do is to wait for a pullback, Risk Disclaimer I'm not telling you what to do im just saying what I would do.
I Wish You To Make Lots Of Money


LTCUSD 1D bULLISH CHANNEL BREAKOUTPrice has been in a descending channel chart pattern
Option #1 Entry on a Daily Close above Channel Top
Option #2 Entry after Break-Hook-Go pattern completes
3 different Take Profits at resistance levels
Stop loss below swing low

USDCAD Channel Breakout USD/CAD Weekly and Daily time frame broke out from its long term channel and making lower lows and lower highs, we already have a pull back after the breakout, you can spread your down fibonacci to get a clearer picture of the lower lows and lower highs,
if you spread your fibs on the Daily you will notice that we have a 0.618 pull back with a counter trend line break,
having all this facts makes it enough big of a case to consider looking for short trades.
now if you go down even further to the 4 hour chart, you will notice a volume spike with a small body candle and a long wick, which that indicates that a bog fight was happening at that level which adds more confirmation for a short trade.
In conclusion:
We Have
1)Weekly/Daily Channel Break
2)Lower Lows & Lower Highs
3)Daily 0.618 Pullback
4)Counter Trend Line Break
5)Volume Spike On The 4 Hr
P.s if you look at the monthly you will also notice that we have there a bearish candlestick formation and this was the test of the candle.
if you see anything different then what I saw please comment and let me know what is it that you see that I missed...
Thank You
Easy Trading To You All!!!


Tata Elxsi Trade Setup for 24 Aug 2019Reason(s) for Trade:
Stock was moving in a channel range
RSI Positive Divergence
Channel Breakout with Average+ volume is seen
Trade Setup:
Buy if goes above 654.00
For more study & analysis update, join ProfitPattern over telegram - t.me
Disclaimer:
ProfitPattern is a purely educational Research unit and not a SEBI registered analyst/adviser. Please be noted that Risks/losses are associated with stocks trading; and it's all your acts & liability.

LTCUSD 4H DESCENDING CHANNEL TRADESRanges, Descending Triangles, Triangles, & Ascending Triangle are repeatable trading chart patterns.
Triangles and ranges are consolidation chart patterns that can breakout either direction.
Ascending and descending chart patterns will have a directional bias depending on the previous incoming trend.
Each chart pattern will have defining trendlines of the support/resistance levels creating the pattern.
What ever time frame you are trading this chart pattern, wait for a candle close outside of the trendline in the direction of the breakout candle. (Our time frame preference is the Daily chart ).
Add volume indicator - Volume is the amount of $ that went into a particular candle or in Forex the # of trades that took place.
Add ATR indicator - Volatility is the amount of price movement that occurred. Use the ATR to measure the price movement.
When you see descending volume bars and descending atr line (which indicates volatility ) this shows
a dis-interest in traders to invest in this pair creating consolidation which creates the chart pattern.
Trade Management after there is a breakout candle close.
1 - Position size (compare volume bar to volume ma line).
a - Breakout candle must be 100% of average volume for a full position size.
b - If 75% of average volume then ½ position size.
2 - Enter two trades.
3 - SL for both trades will be 1.5 x ATR.
4 - 1st trade TP will be 1 x ATR.
5 - No TP on 2nd trade – letting profit run and adjusting SL to follow price.
6 - When 1st TP hit – move 2nd trade SL to breakeven.
7 - Adjust the 2nd trade SL to follow price.
*8 - When breakout candle is more than 1 ATR from breakout candle open.
a - Enter 1st trade at candle close with ½ position size.
b - Enter 2nd trade with a pending limit order that is 1 ATR of breakout candle open.
c – Price should pullback to that pending limit order for 2nd trade.
d – If Price returns back into chart pattern close trade before SL is hit.

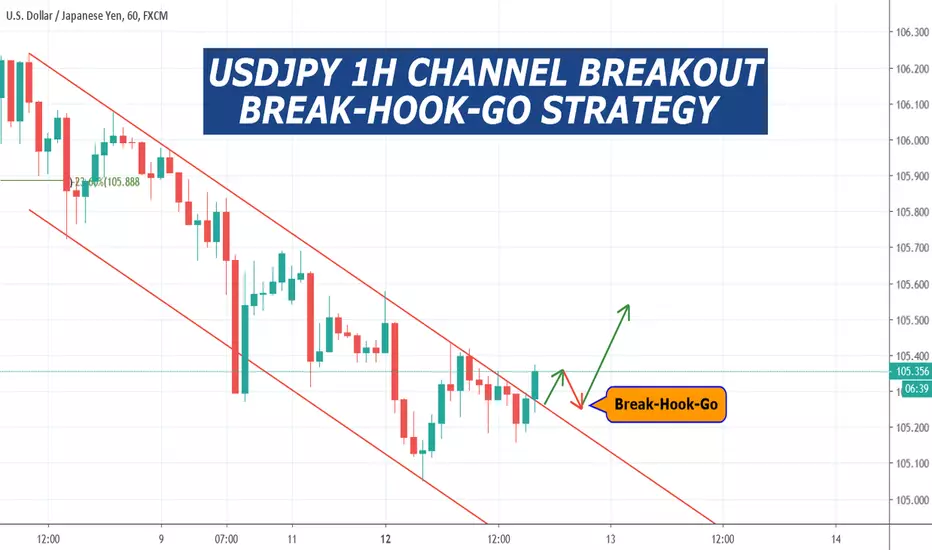
USDJPY 1H CHANNEL BREAKOUT - BREAK HOOK GO STRATEGYPrice is in a descending channel pattern
Price has broken out of the top of the channel
Wait for a Break-Hook-Go price pattern
You can watch for this BHG pattern on a 15m chart
After a Bearish Pullback Hook move then enter after 2 green 15m candles
Let us know what you determine your TP & SL is.
EURGBP 1H/15M RABBIT TRADING STRATEGYStep 1 on a 1H chart find a channel
Step 2 Find a breakout of channel
Step 3 on a 15m chart find a bullish pullback
Step 4 Wait for 2 bearish candles to close then ENTER
Step 5 Place your TP 50 pips away
Step 6 Place SL above the last resistance point
Rabbit Trail Channel Trading Strategy Link
tradingstrategyguides.com

AUDNZD 1D DESCENDING CHANNEL BREAKOUT TRADESDescending Channel is a range chart pattern
Descending Triangles, Triangles, Ascending Triangle and Ranges are repeatable trading chart patterns.
Triangles and ranges are consolidation chart patterns that can breakout either direction.
Ascending and descending chart patterns will have a directional bias depending on the previous incoming trend.
Each chart pattern will have defining trendlines of the support/resistance levels creating the pattern.
What ever time frame you are trading this chart pattern, wait for a candle close outside of the trendline in the direction of the breakout candle. (Our time frame preference is the Daily chart).
Add volume indicator - Volume is the amount of $ that went into a particular candle or in Forex the # of trades that took place.
Add ATR indicator - Volatility is the amount of price movement that occurred. Use the ATR to measure the price movement.
When you see descending volume bars and descending atr line (which indicates volatility) this shows
a dis-interest in traders to invest in this pair creating consolidation which creates the chart pattern.
Trade Management after there is a breakout candle close.
1 - Position size (compare volume bar to volume ma line).
a - Breakout candle must be 100% of average volume for a full position size.
b - If 75% of average volume then ½ position size.
2 - Enter two trades.
3 - SL for both trades will be 1.5 x ATR.
4 - 1st trade TP will be 1 x ATR.
5 - No TP on 2nd trade – letting profit run and adjusting SL to follow price.
6 - When 1st TP hit – move 2nd trade SL to breakeven.
7 - Adjust the 2nd trade SL to follow price.
*8 - When breakout candle is more than 1 ATR from breakout candle open.
a - Enter 1st trade at candle close with ½ position size.
b - Enter 2nd trade with a pending limit order that is 1 ATR of breakout candle open.
c – Price should pullback to that pending limit order for 2nd trade.
d – If Price returns back into chart pattern close trade before SL is hit.

BTCUSD 1D BULLISH FLAG CHART PATTERNBull Flag chart pattern is a type of range parallel channel. Long bias
Descending Triangles, Triangles, Ascending Triangle and Ranges are repeatable trading chart patterns.
Triangles and ranges are consolidation chart patterns that can breakout either direction.
Ascending and descending chart patterns will have a directional bias depending on the previous incoming trend.
Each chart pattern will have defining trendlines of the support/resistance levels creating the pattern.
What ever time frame you are trading this chart pattern, wait for a candle close outside of the trendline in the direction of the breakout candle. (Our time frame preference is the Daily chart).
Add volume indicator - Volume is the amount of $ that went into a particular candle or in Forex the # of trades that took place.
Add ATR indicator - Volatility is the amount of price movement that occurred. Use the ATR to measure the price movement.
When you see descending volume bars and descending atr line (which indicates volatility) this shows
a dis-interest in traders to invest in this pair creating consolidation which creates the chart pattern.
Trade Management after there is a breakout candle close.
1 - Position size (compare volume bar to volume ma line).
a - Breakout candle must be 100% of average volume for a full position size.
b - If 75% of average volume then ½ position size.
2 - Enter two trades.
3 - SL for both trades will be 1.5 x ATR.
4 - 1st trade TP will be 1 x ATR.
5 - No TP on 2nd trade – letting profit run and adjusting SL to follow price.
6 - When 1st TP hit – move 2nd trade SL to breakeven.
7 - Adjust the 2nd trade SL to follow price.
*8 - When breakout candle is more than 1 ATR from breakout candle open.
a - Enter 1st trade at candle close with ½ position size.
b - Enter 2nd trade with a pending limit order that is 1 ATR of breakout candle open.
c – Price should pullback to that pending limit order for 2nd trade.
d – If Price returns back into chart pattern close trade before SL is hit.

EURUSD, Buy on H4Note : channel ---> breakout structure ---> pullback ---> BUY ON DIP
**Disclaimer** the content on this analysis is subject to change at any time without notice, and is provided for the sole purpose of assisting traders to make independent investment decisions, -


AUDUSD,Close to BUY ZONE!It's huge possibility that AUD will bounce from Key Level 0.69106.
Also it will be lower border of channel.
We can open BUY after fake broke of Key Level.

EURCHF Parallel ChannelEntry at the D1 Chart Horizontal Support Resistance Level
Trade Strategy: Channel Break

NZDCAD Entry Near The Price Level 0.87333 NZDCAD Parallel Channel
Action Steps:
Draw Support Resistance Line
Wait for the Market to Break and Retest Support Resistance Line


