Channelbreak


USDCAD waiting for Short positiondaily channel has been broken.
waiting for pullback then continuation of downtrend

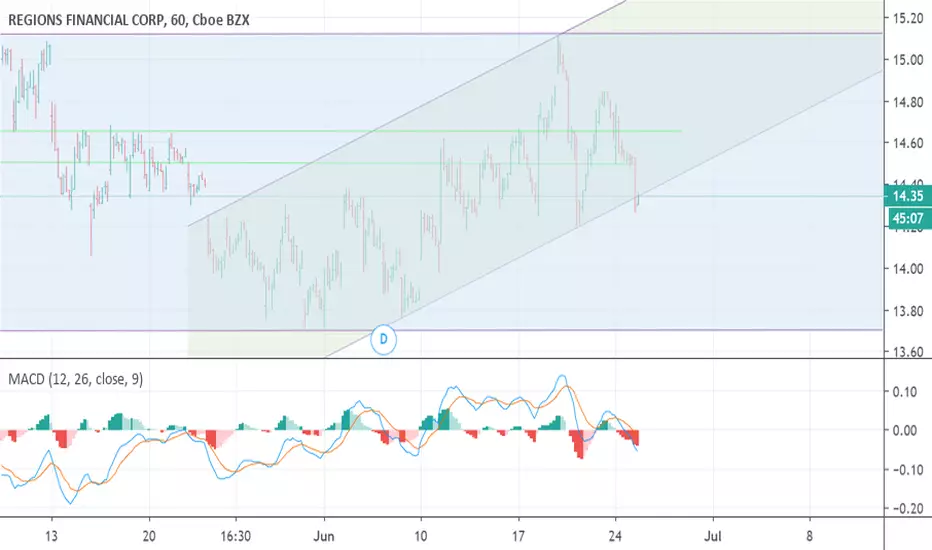
RF downward channel breakoutI've liquidated my long position in Regions Financial after this morning's downward channel breach. RF is still in its horizontal channel, so in the medium term this stock is looking neutral. In the short term, it may head to channel bottom.
BKH held trendline supportAfter falling out of its channel the other day, Black Hills Corp. hit critical trendline support and held it pretty decisively. It's looking like a long from here.

[GBPUSD] CHANNEL BREAKOUT [SHORT | 1H]As you can see on the 1 hour chart, price has broken out of channel and dropped to pivot. We can see a bullish engulfment candle at the pivot suggesting price may be moving up to retest the channel. I am hoping to get a rejection at the 0.382 fib level as that is a demand zone. I will be waiting for price to see if it could move up to my demand zone and see if we see a rejection of that price level to enter the trade for a short position.

CERN triangle breakout coming -- bullishCERN has been forming a triangle as it decides between two different parallel channels. I expect the longer-term upward channel to prevail on the strength of impressive analyst ratings and the overall strength of the healthcare sector. Look for an entry below 71.63 in the next week, with stops below the triangle.

MBUU upside breakout possibleMalibu Boats just got some big analyst upgrades on the strength of upward earnings revisions. It's been in a gentle upward channel, but I actually think it could break out and establish a steeper upward channel leading up to earnings in September. Watch for the upside channel breakout and then buy the pullback.
As always, this does not constitute investment advice, just an idea as to how the market will move. Full disclosure: I know the founder of this company.

Ringcentral bearish - target 101-104Ringcentral has moved decisively out of its upward channel and begun to form a downward-sloping one (charted here in a very preliminary way). It's a fairly solid stock, and it should find some support in the 101-104 range. That'll be your buying opportunity for a long play.

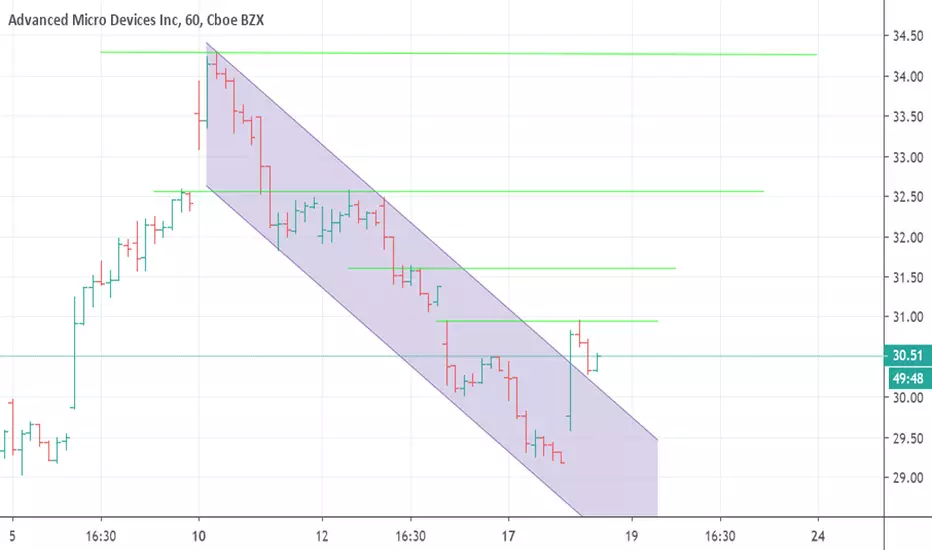
AMD downward channel breakAMD has been trying to turn negative for a few days, and it just got there. Likely to fall from here. It's got poor analyst ratings, so there's reason for the channel break.

AMD forming upward channelAfter breaking out of its downward parallel channel, AMD is now forming a longer-term upward channel. It's near the bottom of the channel, so it's a good time to buy.
This does not constitute investment advice, just an idea about how the market will move.

Tesla-- bullish above the trend lineTesla has formed an upward sloping trend channel and is currently at the bottom of the channel.
It's currently at a minor resistance level, so it could break the channel Monday. If it does, look for breach of the 203-205 support zone to confirm an oscillation down to support at 188, forming a triangle chart pattern.
Alternatively, we could bounce off the bottom of the channel toward a stronger resistance zone at 220-223. This resistance zone repulsed Tesla's attempted move higher on June 11-12, so I'd expect a channel break here. The highest I think we go before breaking the channel is resistance at 230.
Tesla is on track to deliver a record number of vehicles in June, which could work as a catalyst in its favor. On the other hand, it has massively negative earnings and horrible analyst ratings headed into a market downturn. Yesterday the US government denied its application for tariff relief, and this has been a year of bad personal publicity for Elon Musk. Personally I wouldn't buy Tesla; I'd just look for the optimal time to short.

This is why you suck at identifying Elliott Wave channelsIf you have read the holy bible of elliott waves, you would know that Elliott wave guidelines suggest that you:
1. draw a straight line from end of wave 1 to end of wave 3
2. draw a parallel line from the end of wave 2 (parallel to the line we made in 1.)
3.if end of wave 4 is not on this line, adjust projection for wave 5 by drawing a parallel line to the line connecting end of wave 4 to end of wave 2, at end of wave 3.
4. Extended may break the channel :)
Note: there is no mention that the smaller waves within these waves have to be inside the channel. only the starting point and ending point are considered.

WATCH FOR THE SILVER LINING IN THE CHNA-US TRADE WARCNN Business - The World is on a brink of a Trade War
US impose tariffs on $50 Billion worth of Chinese Exports
Chinese quickly outlined new import taxes on US Products worth $3 Billion
Result is a drop in the Dollar Index
Benefit of this is when Dollar drops precious metal pop
Gold broke bullish out of descending wedge but too late to enter
Silver has given us a candle close above this descending channel with increased volume
Traders were bored with this descending channel chart pattern with decreasing volume bars
Decreased ATR from smaller sized candle bars dropped volatility
Trade War news brought bullish momentum to have a breakout candle close above channel trendline
XAGUSD BUY STOP @ 14.77
Enter two orders
Both SL at 1.5xATR
1st Trade TP 1xATR
2nd Trade no TP
When 1st trade hits its TP move 2nd trades SL to breakeven
Follow Price on 2nd trade with SL to let profits run

USD/JPY - Speculating a Breakout and an Idea of an Ideal trade.Currency Pair: USD/JPY
Date: May 03, 2019
This is an application of the few rules I have learned about trading forex.
- Support and Resistance
- Pattern Trading
- Price Action
- Trends
Some thought on this pair:
The pair is kind of wedging up. It is creating a point of pressure in that price will have to either do one of three things.
(1) Bounce
(2) Break
(3) Float
These three things could happen in a combination kind of like a boxing combo. Or as simple as one. These 3 principles are relevant to price action at its current price and range. Keep a lookout for this pair. Whether I am correct or not I think in the next 140 days you will either catch a lot of pips trading a up/down - trend. Once the trend is established I know I will be on a lookout. Wish you luck in the ability to catch the opportunities while you can.
Change the different timeframes to see the full technical analysis.
Trading Journal Entry: 1
By: Austin S.

Woolworths has 10% upside from here - Bottom of uptrend Channel.High to medium probability that WOW trades back up into middle of uptrend channel and tests recent highs.

BTC Breakdown AttemptBTC crossing our bottom channel line, waiting for volume to come in before making a decision.

EURNZD Battling Support And Resistance LevelsWith EURNZD Breaking out of a channel after hitting a double Bottom we can see that it has stalled on rather strong support turned to resistance levels.
Feel free to watch our quick 60 second video where we break down the chart here : twitter.com

GOOG is going to break down an uptrend channelThe magnet price is 1147. This is the level where I will be buing. Profit target at 1187.

USDJPY SWING SELLAnother trade ive entered - JUST PATIENCE NOW - ALWAYS LEARNING
FOLLOW ME FOR MORE CONTENT !1!
K - KEEP
I - IT
S- SUPER
S - SIMPLE
ALWAYS KEEP FX SIMPLE - TO DO THIS KEEP LEARNING AND PRACTICE

BTC/USD: Swing-Setup! Chance to SELL the BREAKOUT and DT!Hey tradomaniacs,
welcome to another free signal!
Important: Market still a MESS. make sure to reduce your risk as good as possible!
-----------------------------
Type: Swingtrade
Sell-Stop : 4043,3
Stop-Loss: 4100
Target 1: 3944,9
Target 2: 3922,7
Targt 3: 116.495
-----------------------------
LEAVE A LIKE AND A COMMENT - I appreciate every support! =)
Peace and good trades
Irasor
Wanna see more? Don`t forget to follow me.
Any questions? PM me. :-)

GBP/CHFmarket is hovering at the top of the decending channel. looking for a break of this structure and looking to take profit around the top of the channel which is almost at the daily trendline. R/R 3:1 risking 1%.
