USD/CHFUchf is making a tight candlestick channel made up of diagonal after diagonal. It will go up. It is at the 800 Ma on the daily. However the 200 on the weekly is lining up with that fib level below and in this scenario I prefer to see it break out the bottom of the channel. The last wave diagonal it is in can do one more overlap and down. Rather than trying to explain I will just do a quick live stream on my channel. See link below.
Channelbreak

SMG Short following break down from channelSMG has recently broken down from monthly trendlines. We will wait for it to recover to volume node and then enter a short position, risking off the 78% fib retracement, which is unlikely to occur. Do not enter position until signs of weakness or target is reached.

GBPNZD : SHORT POTENTAIL Setting UP !!We see the GBPNZD & EURNZD having a near SIMILAR formation currently!
We Favors a POTENTIAL SHORT Position soon, as Price Action is currentlt taking place !
SHORT
GBPNZD
WEEKLY CHART : In a Upwards Channel. Previous week Price BAR - BULLISH Bear Bar !
DAILY CHART : Smaller CHANNEL Within (WEEKLY CHANNEL) shows price Break Down
@ Channel Lower Lines.(Channel Break) Also A Lower Low is notice. (Signalling Potential Downwards Move)
A: SUMMARY – We see a Potential Push of Lower Low, and Lower High formation.
Therrfore a SHORT Position!
POTENTAL 300- 400PIPS Move downward !!
B: This Coming WEEK Analysis:
>H4/H1 Entry , look for Candle formation OR a pull Back , which is in process now !!
CHEERS .. Stay Nimble-TRADE SAFE !!
Let the Market Do, WHAT It is suppose to do !!
Act & Trigger as and when Market Dictate, ie your SHORT ENTRY !!

BTC FINAL ACT TO BEGIN NEW UPTRENDit is common for a trend break, channel break, to be followed by one last test of the down channel line.
this can translate into a new bull trend, or it could trade sideways for a time.
if it gets back below the down channel line then the bear market will likely continue.
I think a successful retest is more likely.

nice zone to go short in GBPAUDResistence zone, 61.8% of the wave and false brekout of the channel. Divergence in OSMA, RSI overbought.
Trade under your own risk.

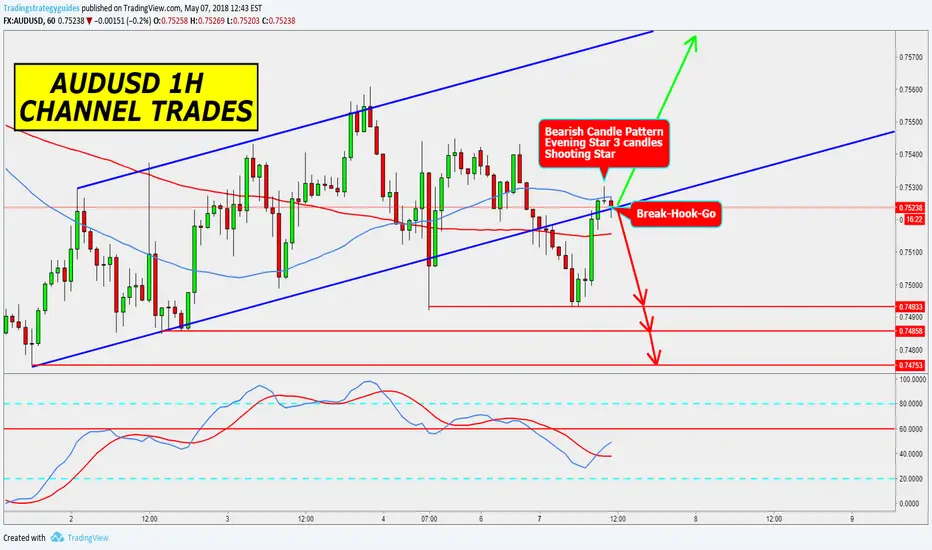
AUDUSD 1H CHANNEL TRADESAscending Channel breakout
Price returned into channel
Bearish candle patterns developing
Break-Hook-Go candle pattern completing
Watch that breakout fails again
Then price will continue back to top of channel
Take Profits shown
USDJPY 4H CHANNEL TRADESPrice is in an ascending channel
Bullish bias price moving to top of channel
Possible bearish breakout of channel bottom
Buy Stops and Sell Stops shown
Take Profits are shown

FDC - Downward channel breakout Long from $18.43 to $20.76 FDC was mentioned in our last trading room discussion on May 3rd. Earnings are already reported & it jumped up with the earnings and broke above its downward channel formation. We discussed it will be a possible long if it breaks above $18.43 & it did break that on Friday & looking great so far. We think it will continue upward.
* Trade Criteria *
Date First Found- May 3, 2018
Pattern/Why-Downward channel breakout long
Entry Criteria- $18.43
Exit Criteria- 1st Target $20.76, 2nd Target- Momentum
Stop Loss Criteria- $17.43
Indicator Notes- Strong Twiggs money flow index
Please check back for Trade updates. (Note: Trade update is little delayed here.)

NEO - Possible Breakdown to $80 before rallyHow's it going fellow crypto heads!
Today were going to take a rather quick look at NEO and a few of the technical aspects along with a quick snipit on the fundamentals on why I've remained bullish on the project for quite some time.
Technicals
Semi long term trend established april 6th, return to trend likely by May 5th
Whether we break through the bottom of the current minor channel towards the ATH 23.6% retrace or not will be important to judging its path
Convergence galore around may 5th (long term trend, cycle end, 38% ATH retrace)
Break down to the lower support seems likely based on current path and the prior retrace that broke down out of the channel
MACD, RSI, STOCHASTIC, and STOCHASTIC RSI totally bottomed
Fundamentals
I'm not going to bore the non crypto folks with the story of NEO and all that, but i must mention the smart contracts.
Essentially the driving thing to me that keeps me so bullish on NEO is its presentation of an alternative and possibly more effective smart contract ecosystem than the current ethereum network allows for.
For those unaware, as the smart contract system grows ETH faces continuous scaling issues, many of which NEO attempts to address.
My take on the next week
Likely break down to the $82-$80 range, at which point we'll hopefully see a bounce and consolidation to the $86-$88 range before rallying back into the prior trend channels.
And for the cro-magnon when moon lambo-ers: just HODL, NEO is a solid project lol
--------------------------------------------------------------------------
DISCLOSURE:
This analysis is meant for educational purposes only. You trade at your own risk!
Austin Doyle
CTO

(ETH/USD) Potential Intraday Short - CHANNEL & GANN basicsHappy Monday Fellow Traders!
***excuse the balloon overlaps, TV loves to rescale my charts
**The strategy results should be ignored, I built the MASIC-N indicator ages ago and use it as a baseline, not to trade on!!!
Today I had a friend approach me about her selling her ETH at $515 and feeling frustrated that she was missing the rally. This left me feeling inspired, so in today's chart dive we'll be covering four things
The basics of my channel trade method
The basics of trading Gann fan angles
The basics of Fib levels
A potential intraday short utilizing fib ratios & Gann angles
1. CHANNELS
***Note that theres many ways to trade channels, this is my method; everyone changes things to work for them, this is good! Adapt what you learn and make it work for you!
Major channel range is Major peak to Major low
Minor channel range is Minor peak to Minor Low
Break out range is simply:
Major channel-Minor channel for Long Entry
Minor channel-Major channel for Short Entry
The breakout level is taken from the breakout range added or subtracted from the major channel for long/short respectively
Entry is initiated at the close of the second candle outside of this breakout level
Stop Losses are placed at major channel peak or low for long/short
Move stop to break even after price move equal to 50% of breakout range
2. GANN FANS (these rules are absolutely imperative!!!)
***These are constantly misused on TradingView, lets set the record straight!
**I've only listed the 1/2, 1/1, and 2/1 angles to simplify things as these are all thats needed for a baseline "loose" Gann fantrade
price/bar scale MUST BE 1/1!!!!!
(seriously, if its not 1/1 then you're just drawing lines, not doing a gann analysis)
Pick a Major high or Major Low
Use the trend angle tool to draw 45 deg. angle in direction of trend.
Overlay gan fan with 1/1 line locked to 45 deg. angle
Watch for 1/1 crossover against trend direction
Buy/Sell after close of second candle breaking out from 2/1 line
3. FIBONACCI Retraces.
I see people argue about the efficacy of fib levels all the time, stating the ever present "draw enough lines and something will correlate" argument.
So I'll make this one easy:
These are simply guides NOT guarantees!
lol
4. THE TRADE!!!!
WHY:
Unsuccesful breakout of 1.618 fib line
Possibly about to close the first bar below Gann fan
RSI below 50 & falling
MACD Bearish Divergence
BTC (used as crypto index) testing 48 EMA
Stochastic RSI below 50%
SETUP:
Enter Short after second bar closes below Gann 2/1
Target 1 @ 1.414 fib level ($623.60)
Move S/L to $625 at breakout below
Will update depending on trend continuation
***I really will do my best to update this as i trade ETH daily and will be paying attention to the price moves.
Happy trading folks!
--------------------------------------------------------------------------
DISCLOSURE:
This analysis is meant for educational purposes only. You trade at your own risk!
Austin Doyle
CTO

GJ continuing upwardSo as we see GJ has started it's pull back and I believe it will come down to the 61.8/daily resistance level before continuing upwards. We that GJ has also broken out of it's smaller time frame channel and could potential be headed for the top of the channel on the higher time frames now. If look at RSI there is also a strong possibility we will have divergence when price reaches entry.

GBPHCHF Channel breakout Price has appeared to broken out of the recent ascending channel, we have highlighted where we think price will retrace to.

USDJPY CHANNEL BREAKOUT. TENTATIVE LONG POSITION As I mentioned yesterday, I am keeping a close eye on growing signs of YEN weakness. As stated in that published idea , a break below the current uptrending channel is just one sign of possible trend change. Since this has been a strongly trending market, a trend change will likely look more like a range, the duration of which is still to be determined. I placed LONG orders on the AUDJPY as well as the USDJPY yesterday and currently +65 pips on each.
As for the USDJPY, the trend is still down and this NOT a contrarian trade, meaning that most retail traders are LONG on net, which is often indicative of trend continuation rather than reversal. My LONG trade, therefore, has a rathrr conservative target set @ 1.635. Moving into next week, if the YEN continues to decline against the Dollar than I will adjust my target to a 2:1 ratio and possibly add in one or two more lots.

BTC Bulls Breaking Out of the Downtrend ChannelBTC has successfully broken out of the downtrend channel by breaching (and closing above) the major downtrend line.
When these breakouts happen, usually the price retests the newly broken resistance to try it as a support.
-
Either it doesn't hold, then it turns into a fakeout and price goes back to revisit the lows, or...
The new support holds, then it creates a nice structure to build upon when going for the new highs (in our situation it looks like we've got this scenario, which is a very good sign)
First target: 11790 (previous local top)
11790 is also a starting point for a stronger resistance zone (11790-12376), and it's likely that a retrace might happen from somewhere within that resistance zone.
Once (and if) that resistance zone gets cleared, and BTC manages to go through it, we can look up to higher targets.


XRP CHANNEL REJECTION AND CRITICAL SUPPORTin a very short time we shall see if XRP holds critical support.
next hurdle is a break of the MA lines and on to new highs.
the channel rejection looks like a positive sign.
the moment of truth is at hand.

BCHUSD 1H CHANNEL TRADESThis trade is from our free pdf "CHANNEL CHART PATTERN STRATEGY" PM me if you have any questions, I will be happy to help.


BTCUSD 1H ANDREWS PITCHFORK CHART PATTERN STRATEGYThis trade is from our free pdf "Andrews Pitchfork Trading Strategy"
PM me if you have any questions about this strategy or our many more free trading strategies, I will be happy to help.

USDJPY DESCENDING CHANNEL TRADESPair is in a descending channel
Bullish entry channel break out
Bearish entry range bound sell stops
Take profit levels listed on chart
Watch for Macd for direction

AUDUSD 4H GUMBO SOUP SHORT TRADEPair was in an ascending channel
channel breakout into consolidation
range bound consolidation
range breakout for bearish ENTRY
take profit previous support
watch Macd for bearish confirmation and direction

#VIBE fractal concept, 100% short-term earnings potential#VIBE is looking ultra bullish and will definitely achieve some targets. Stoch is below oversold. In addition, we found a fractal concept. The blue boxes indicate a decline followed by a fast uptrend and then some consolidation. After the consolidation we make another leg up and find ourself in a wedge/channel. Once #VIBE broke out of that wedge it went straight to the moon, lets see if it happens again.

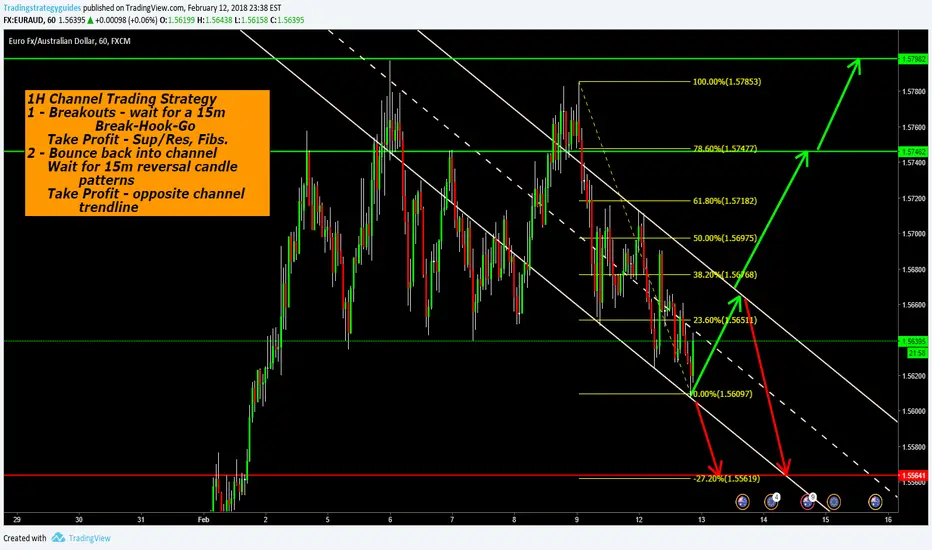
EURAUD 1H Channel Trading StrategyChannels are a common chart pattern
EURAUD is at the channel bottom.
If it is a bearish channel breakout, you are a seller.
Wait for a 15m Break, Hook, and make your entry!
If it returns into the channel as a bullish continuation, you are a buyer.
Wait for a 15m bullish continuation candle pattern, and make your entry.
Thanks everyone, have a great week and let us know below how you trade channels. :)