Channelbreak


AUDUSD Channel BreakTrend continuation trade setup after channel breakout to downside, will go short if price breaks mini-trendline of retest.

CADJPY - SHORT breakout at 0.382 Fib retracementSHORT breakout at 0.382 Fib retracement from previous move down.
CADJPY

CADJPY Looking Higher After Complex CorrectionFX:CADJPY found support at 89.00 and made impulsive rally last week after long one month complex correction. So, we see five waves up with Bullish Market Truncation in fifth wave, broken channel resistance and three waves down correction, which is our signal for longs. We expect a bounce in days ahead into third wave up back to new highs. FX:CADJPY is bullish as long as 89.00 invalidation level holds.

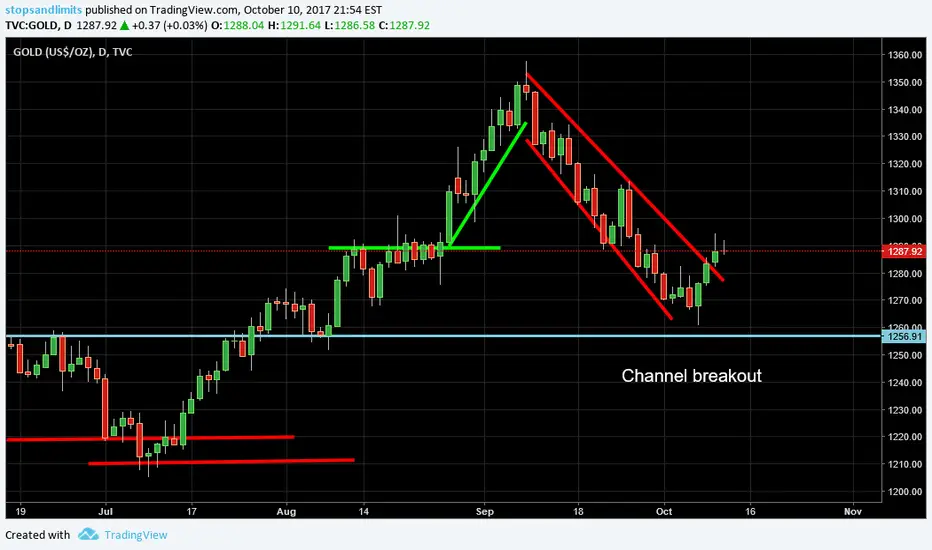
double top and channel break outGot a double top, RSI over bought on the first test.
Consolidation at previous structure
expecting a break out to the down side atleast an equal measured move
strong confluence of fib inversion and fib extension
previous major structure

Ethereum - ETH USD - Descending ChannelAccidentally posted a private idea several days ago. This follows on from that -
Ethereum broke out of an ascending channel it had been in since late September after forming a head and shoulders pattern and a break of the neckline.
It is now in a narrow descending channel with a potential downside of around $250 levels. If it breaks up, out of the channel I would expect the neckline of the H&S to act as resistance.
I will be refraining from entering an ETH trade at this stage until the market settles down around this first BTC fork at least.

GBP/USD Ideawell similar to my gold idea
2 plans for GU
1- if the channel and 38.2 fib hold im gona buy
2- if channel broke i ll short it till cypher pattern complete and ill buy the cypher pattern

GOLD ideai have 2 plans for Gold
1-If 61.8 fib lvl and channel hold the price i ll go long
2-if channel broke i ll short it till cypher pattern complete and ill buy the cypher pattern

EURUSD 4H Channel TradePair is at the top of the channel. It will either break-hook-go long to the 100 sma. Or it will bounce short off channel top trendline and go short to support @ 1.1700.

EURJPY 4H Channel FailurePair is possibly starting Bullish 5th wave up back into the channel. Could place pending orders of buy limit and buy stop or wait for bounce from sup/res level and double 00 at 132.00. If failure happens RSI should cross and stay above the 50 level line.

NATU3 - Possible Breakout to the upsideNATU3 has currently consolidated between 27,90 reais and 30,40 reais.
It almost broke out to the upside on last candle of last week's trade.
Let's see if price breaks and closes above 30,40 reais. If it does, we will be looking for a buy.
Stop Loss at 29,11 reais
Profit at 33,73 reais (just below an important level of resistance looking at the weekly chart)

USD/CAD - BULLISH BIAS BUILDING UPWe can see that the pair is at the bottom of the channel, and both from the Price Action and the Bullish Divergence (on 12H, DAILY AND WEEKLY TFs) itself we can easily assume that bullish momentum is building up which is why I'd be considering a long position to the top of the channel and when and if the price reaches that point we can then start looking into the next possible move.
Trade safe and do your own due diligence before executing a trade.
For further details join us at:
www.valuedbusinessconsulting.com

Bitcoin short opportunity after trend breakout We can see a really strong trend on BTC also trading against the trend is very riskful so I will wait for channel breakout and a bearish reversal bar.
Then probably the price will reach with an ABC (2 part) correction price zone 3928 (38.2% fib abolition, 4 Elliott wave end). The other zones are much more doubtful.

USDJPY 1H Channel Breakout ShortPair is in a bearish channel. Price is due a pullback. Retrace range 38.3% fib @ 108.10 to 61.8% fib @ 108.59.
Entries
1st at 23.6% fib @ 107.80
2nd at break of bottom channel trendline
3rd at 0% fib @ 107.31
TP at -27.2 fib @ 106.75
My TP will be @ 106.80

BCH Key Levels to Watch For a Long Setup - 4HBCH just broke out of an established bearish channel but has reversed at a key resistance level, ~$652, which can be identified matching the tops from the previous bearish channel with a Fib retracement. Note the Stoch crossover and reversal as well.
I think we will reverse and break this barrier soon (if the new bullish channel holds, the price shouldn't be able to dip too much below $598). A bullish Kumo twist is developing, which is a good sign for the Long setup. Two key levels to watch: the 652 resistance and then the 730 resistance. If we break 730, we may see bullish action all the way to 861.

NEO Bearish Channel BrokenNEOUSDT has broken through the boundaries of its recent bearish channel. We notice the price finds support along the boldest line. We should expect to see more upward movement throughout the day in response to this breakout as long as the price is able to break the $42 resistance level. Neo has a lot of potential and I believe now would be a good time to enter for both short term and long term trading. GOOD LUCK EVERYONE!

AUDUSD waiting the Breakout The pair broke descending channel and it about to close above MA100 which paves the way to buy it next week if it holds above 0.7900 targeting 0.7940 then we will watch the dollar index to decide which way it will take later.

Just an Idea for the Aggresive Traders EUR/NZD 15mThis seems to be a setup with crazy R:R. Willing to risk 30 pips for 90 pips on the upside. Not gonna bore you with the exact numbers on this minor pair but i definitely would say take a look for a possible trade! As always tell me what are your thoughts! Happy Trading!

USDZAR Long Term Bullish breakTechnically: I see a long term channel break, cypher and head and shoulders pattern, all bullish.
Fundamentally: South Africa's president just survived another vote of no confidence. This will long term be negative for the South African economy

Break Up the channelBearish channel broke up strongly, perhaps we will have good gains in long positions

GBPUSD Channel Trend ContinuationDescending channel/Megaphone Breakout and retest of EMA.
Trend continuation Setup= Retest of channel, Break of trend line
