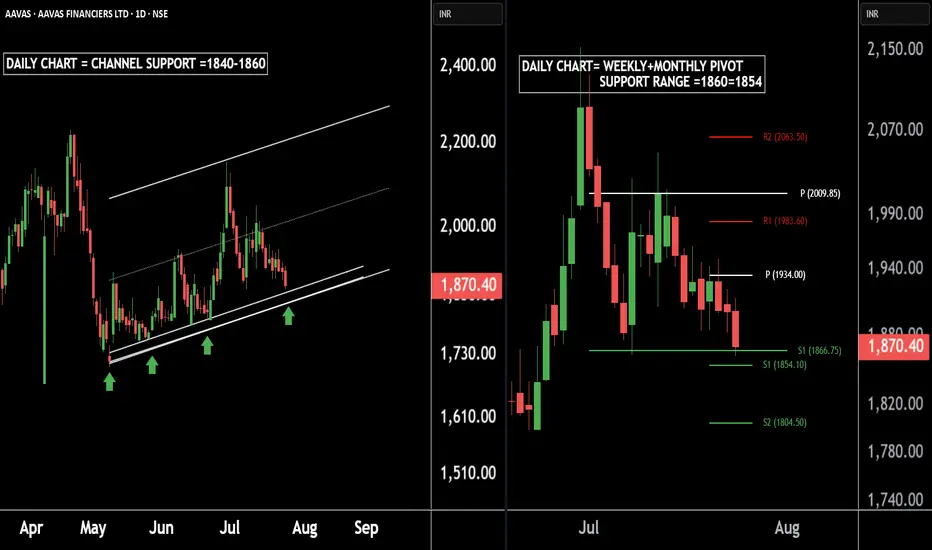
AAVAS Housing – A Hidden Gem for Medium-Term InvestorsThere are two charts of AAVAS FINANCIERS.
On the first chart AAVAS FINANCIERS is moving in a well defined parallel channel with support near at 1840-1860.
On the second chart AAVAS FINANCIERS is taking Weekly + Monthly support near at 1866-1854.
If this level is sustain ,then we may see higher prices in AAVAS FINANCIERS LTD.
Thank You !!
Channeltrend
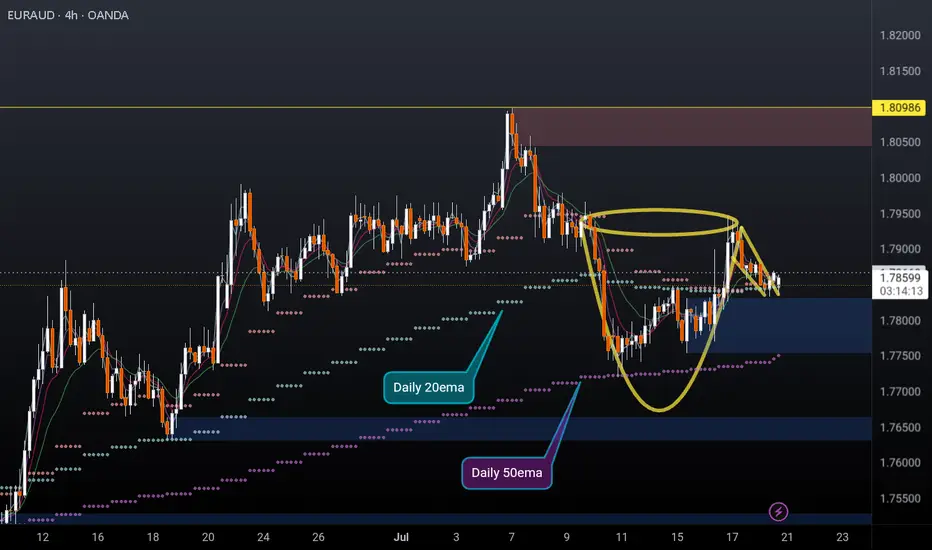
EURAUD 4H cup and handleEURAUD 4H cup and handle formed and possibly breaking out to the upside. Price recently found support off the daily 50ema (overlayed on this 4h chart) and is holding above the daily 10 & 20EMAs (overlayed).
I'm a cat not a financial advisor.
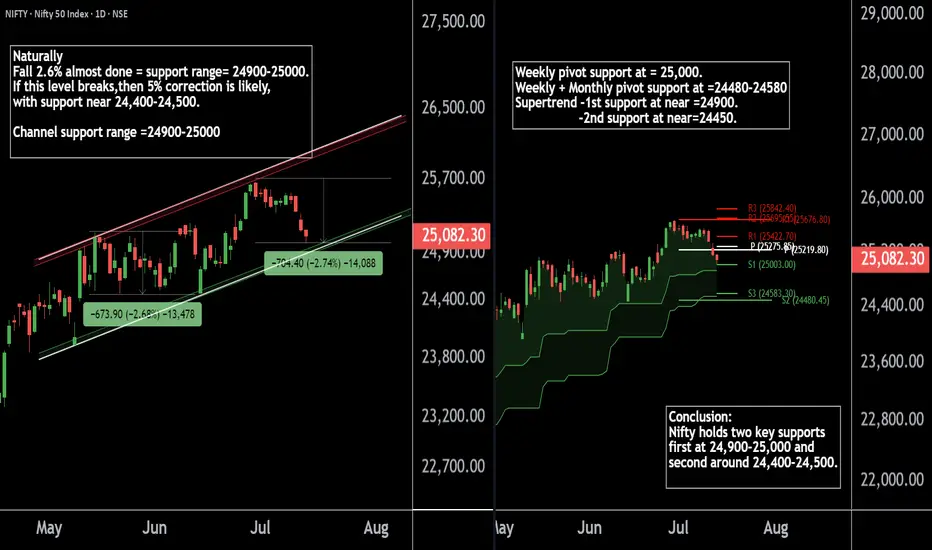
Nifty50's Key Level !! Keep an eye on these levels.Here are two Nifty charts, both on the daily timeframe.
Current Correction:
Nifty has naturally corrected by 2.7%, currently trading in the 24,900-25,000 range.
Weekly Pivot:
The weekly pivot support is positioned at 25,000, providing immediate support.
Support Levels:
First Support: 24,900-25,000 zone.
Second Support: If this level breaks, Nifty may see a 5% correction, with the next support around 24,400-24,500.
If this level sustain we may see higher prices in Nifty 50.
Thank You !!
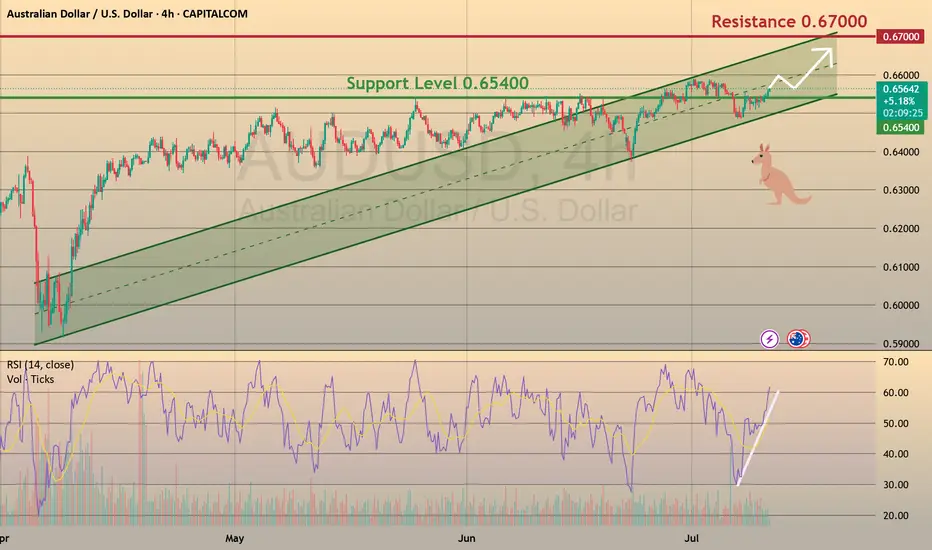
Aussie: Still Growing!
CAPITALCOM:AUDUSD
The bullish momentum continues after our last successful AUDUSD setup, and a move toward the 0.65900 resistance area looks probable now.
🪙 My Trading Plan:
🔼 BUY Stop: 0.65648
❌ Stop Loss: 0.65320
✅ Take Profit: 0.65965
💡 Why am I buying here?
✅ Price broke recent resistance at 0.65500, activating buy trades.
✅ RSI confirm ongoing bullish momentum 📊.
📰 Fundamental Situation:
🏦 RBA Rate Decision Supports AUD
The Reserve Bank of Australia (RBA) surprised markets by holding rates steady at 3.85% 🏛️, diverging from expectations of a cut. This cautious stance reflects the RBA’s preference to wait for clearer signs of slowing inflation 📉 before adjusting policy further.
Governor Michele Bullock emphasized that inflation risks remain persistent ⚠️, driven by high labor costs and weak productivity, possibly requiring a longer period of restrictive policy ⏳. Deputy Governor Andrew Hauser noted the bank is closely monitoring global risks 🌐, especially US tariff developments, underscoring sensitivity to global headwinds that could impact trade and growth 📦.
🌎 Trade Tensions in Focus:
President Trump ruled out extending tariff deadlines beyond August 1 ⛔, announcing new duties:
🔹 50% on copper 🪙
🔹 Potential 200% on pharmaceuticals 💊
🔹 10% on goods from BRICS 🌐
These moves are likely to intensify global trade tensions ⚔️, potentially impacting commodity flows and inflation, which the RBA and markets will continue to monitor closely.
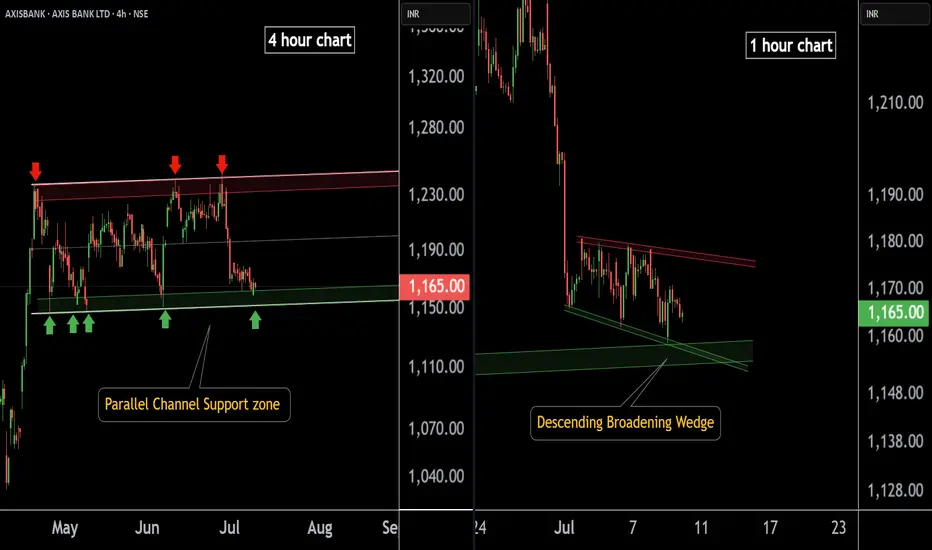
AXIS BANK at Best Support !!Here are two charts of Axis Bank — one in the 4-hour timeframe and the other in the 1-hour timeframe.
4-Hour Timeframe Chart:
In this chart, Axis Bank is moving within a parallel channel, with the support zone lying in the 1150–1160 range.
1-Hour Timeframe Chart:
Axis Bank is forming a descending broadening wedge pattern, with support near the 1150–1155 zone.
If this level is sustain ,then we may see higher prices in Axis Bank.
Thank You !!
EURNZD: Steep Channel continuation setupEURNZD continues to rise within a steep ascending channel, maintaining a well-structured sequence. No signs of exhaustion are evident yet, as bullish momentum remains strong and price action continues to respect both the midline and lower boundary of the channel.
This ongoing strength suggests that buyers remain in control, and unless we see a clear shift in structure, such as a break below channel support or loss of momentum, the trend remains intact.
🟢 Trend Bias: I remain bullish on EURNZD while price stays within this channel. Any pullbacks toward the lower channel boundary or previous breakout zones may offer continuation opportunities.
🎯 Target: My upside target is 1.983 , which aligns with the projected upper boundary of the ascending channel and makes a good technical target if the structure continues to hold.
🟥 Invalidation: A confirmed breakdown below the channel with follow-through would challenge this bias and signal the possibility of a deeper corrective move.
For now, the structure favors trend continuation over reversal.
Just sharing my thoughts on support and resistance, this isn’t financial advice. Always confirm your setups and manage your risk properly.
Disclosure: I am part of Trade Nation's Influencer program and receive a monthly fee for using their TradingView charts in my analysis.

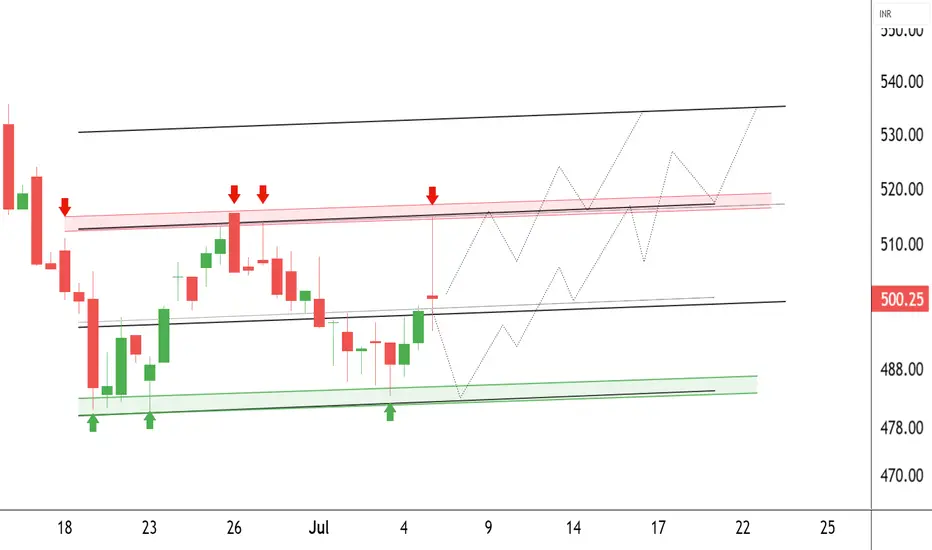
Avadh Sugar & Energy Limited at Best Support !! Breakout This is the 1 hour chart of Avadh Sugar & Energy Limited .
AVADHSUGAR is trading within a well-defined parallel channel and is currently positioned near its L.O.P boundary support zone around ₹495–₹500.
The lower boundary of the channel is 480-490 level and The upper boundary of the channel is positioned near ₹515 and 535, offering a favorable risk-reward setup.
Thank You !!
Are we still in an oscillator?Been over a month in this channel now. Now clear signs of breaking up or down. We are likely headed back to the 30 day SMA, and from there who knows. I tend to like the upside here being above the SMA, but we all know it can crack down and retest the lows yet again. I'm saying we retest the highs first.

NATURALGAS1! 's key Level |This is the 4 hour chart of NATURALGAS1!
NATURALGAS1! has once again started sustaining above
its LOP (Law of Polarity) zone near at 290-295
If This level is sustain then ,we may see higher prices again in NATURALGAS1!.
Thank You !!

The Right Bitcoin ChannelHello TV Community,
I am back with this and more insightful charts coming soon.
This chart was first published back in 2020 (linked below) and this is an update to BTC's trajectory over the past few years.
This chart demonstrates that BTC's price action has been steadily following the mid 50% of my "right" channel (see idea linked below to understand what I mean by "right channel"). The last time BTC's price broke out of the mid 50% range was back in December 2017's high.
The most up to date volume profile indicates that the majority of the trading volume was pre-2017. The MACD indicator is a great example of BTC's highly volatillity since the Dec 2017 high.
If BTC's price breaks into the bottom 25% of the channel, I would expect a touch of the lower end of this channel. If the price bounces off the lower end of the mid 50% of this channel, we can expect higher highs in the not too distant future.
'Til next time.
__________________________________
I let my charts do the talkin'.

Top-Down Analysis in Action – Live Trade: Where I Enter and WhyIn this video, I walk you through my full trading process – starting with a clean top-down analysis.
I begin on the daily chart to spot key market structure and levels, then zoom in to the 1-hour chart for confirmation, and finally execute my trade on the 5-minute chart.
You’ll see:
✔️ How I define my zones and structure
✔️ Why I wait for confluence across timeframes
✔️ Exactly where and why I enter the trade
Just real analysis and real trades.
If you’re looking to improve your entries and learn how to align multiple timeframes, this one’s for you.
🔔 Don’t forget to like, comment & subscribe for more real-time trading content!
NASDAQ:AMZN
NYSE:ANET
NASDAQ:CSCO
NASDAQ:CZR
NASDAQ:GOOG
NYSE:IONQ
NASDAQ:MRVL
NASDAQ:MSFT
NASDAQ:MU
NYSE:NKE
NASDAQ:NVDA
NASDAQ:ON
NASDAQ:SBUX
NASDAQ:SHOP
NASDAQ:SMCI
NYSE:TSM
NYSE:XOM

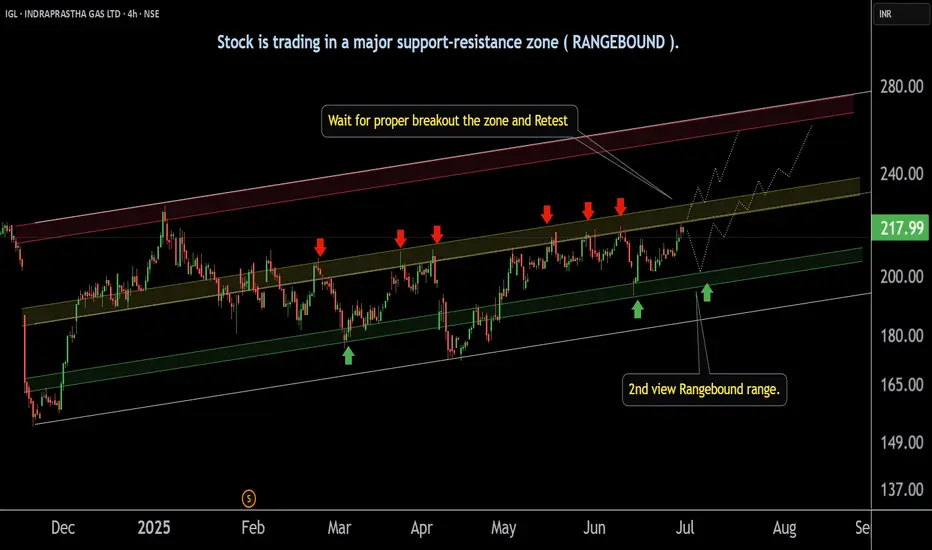
INDRAPRASTHA GAS ' s Support zone | Breakout level |This is the 4 hour chart of INDRAPRASTHA GAS .
IGL is moving in a well defined parallel channel with support range near at 195-200 level.
Igl having good law of polarity at 230 range if Igl give breakout this level and sustain above this level next resistance is near 260 and 280 .
Thank you !!
NATURALGAS at Best Support Zone This is the 4 hour chart of Natural Gas.
Natural Gas having a good Support Zone at 290-295 range.
Natural Gas has shown a reversal from its support zone.
Natural Gas is trading within a parallel channel support at 293 level Natural Gas.
Thank You !!

RELIANCE INDUSTRIES at Key Zone !!This is the 1 hour Chart of RELIANCE INDUSTRIES.
Stock has formed a large Broadening Wedge pattern, with a projected target around the 1560 range.
Stock has formed a ascending triangle patterrn with a projected target around the 1560 range.
stock has given a breakout at 1460 range. If it successfully retests and holds this level as support , then we may see higher prices in RELIANCE INDUSTRIES.
Thank you !!

There is a possibility of a decline and a return to the channelIn compressed channels
The price can hardly pass it
Therefore, the downward trend is expected to continue
In this time form.
The details of the deal have been specified.
good luck. BLACKBULL:US30 BLACKBULL:US30

Nvidia - 100% new all time highs!Nvidia - NASDAQ:NVDA - is just too bullish now:
(click chart above to see the in depth analysis👆🏻)
Honestly it was not unexpected that Nvidia is now the most valuable company in the world. The chart is just so strong and perfectly following structure; it seems to be just a matter of days until Nvidia will create a new all time high. If this happens, a breakout rally will follow.
Levels to watch: $150
Keep your long term vision!
Philip (BasicTrading)

SAIL at Best Support !!This is the 4 hour Chart of STEEL AUTHORITY OF INDIA .
SAIL having a good law of polarity at 125 range .
SAIL has formed a broadening pattern indicating the uptrend.
if this level is sustain then we may see higher prices in SAIL.
Thank You !!

NIFTY at Best Resistance !!This is the 1 hour Chart of NIFTY 50.
NIFTY 50 is trading near it's Resistance zone at 24400 range.
NIFTY 50 is forming a broadening pattern; resistance lies near 24,500.
Nifty 50 is forming parallel channel inside the pattern ; resistance lies near 24350.
If this level is sustain, then we may see Lower prices in Nifty 50.
Thank You !!

STATE BANK OF INDIA at Best Support !!This is the 4 hour Chart of STATE BANK OF INDIA.
SBIN is having good Support at 770 range.
SBIN is moving within an ascending channel, with a support zone in the range of 770–780.
If this level is Sustain ,then we may see higher prics in SBIN.
Thank You !!

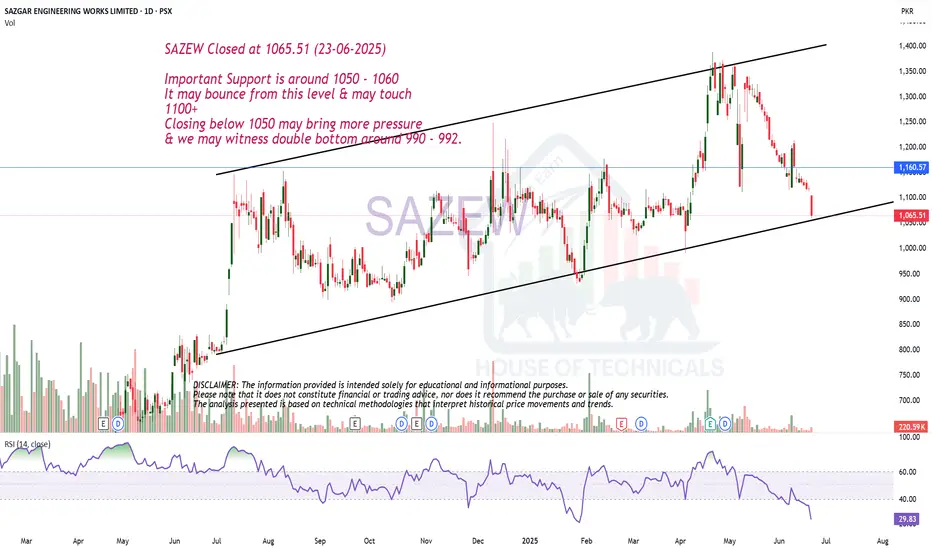
Channel Support SAZEW Closed at 1065.51 (23-06-2025)
Important Support is around 1050 - 1060
It may bounce from this level & may touch
1100+
Closing below 1050 may bring more pressure
& we may witness double bottom around 990 - 992.
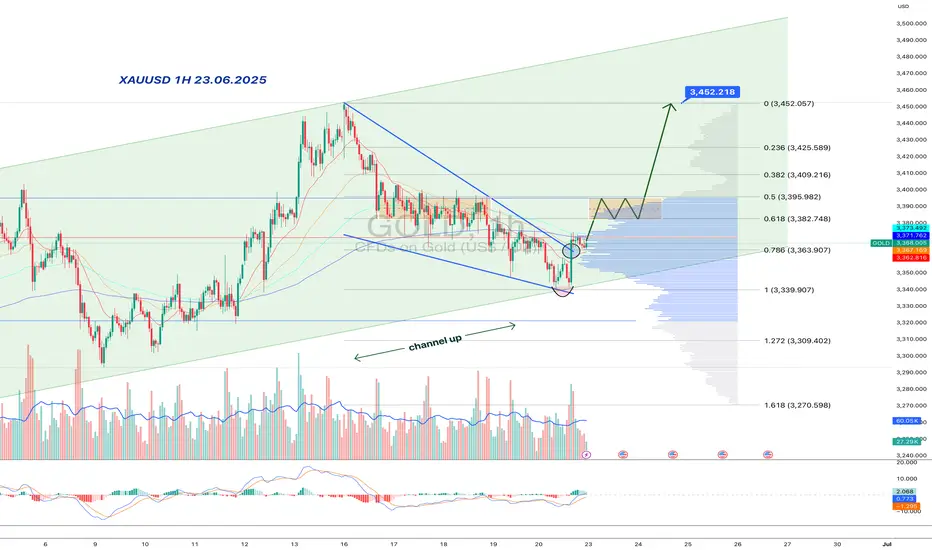
Gold:bullish wedge inside a rising channel-double trap for bearsInside the major upward channel, gold formed a falling wedge — and, of course, faked a breakdown. But the move reversed quickly: price reclaimed the wedge, surged on volume, and held above the key 3363–3368 area. This isn't just a bounce — it's a structural reclaim in line with the broader trend.
Price is now in the upper part of the rising channel and has broken a local downtrend line, reinforcing the bullish signal. Consolidation around 3380–3395 might be the last pause before acceleration. Above that lies a volume gap — no resistance until 3452.
MACD is flipping bullish, RSI turning upward, and volume confirms smart money presence. Classic: trap below, breakout above. As long as 3363 holds — longs remain in control.
ETHEREUM for $750?In this chart, I am showing you the worst possible scenario. If we compare this cycle to the past, we see some very similar things on the weekly chart:
- Weekly RSI divergence
- Testing the 50-level RSI and the trend line from the bottom to the top
- Correction to the 0.5 fibbonacci level.
- Last time we had a war between Ukraine and Russia and now we have a war between Israel and Iran
- Last time everyone on X(twitter) was talking and cheering about Alt-Seoson and ToTheMoon and now we have the same situation, DYOR, check X
$750-800 for Ethereum are the lows of the two global channels. So it's a logical bottom. And after the price reaches the bottom, we can reach the top of the channel.
Hence after this mega-dump we will see #ETH at $18000-20000.
What do you think about this scenario?

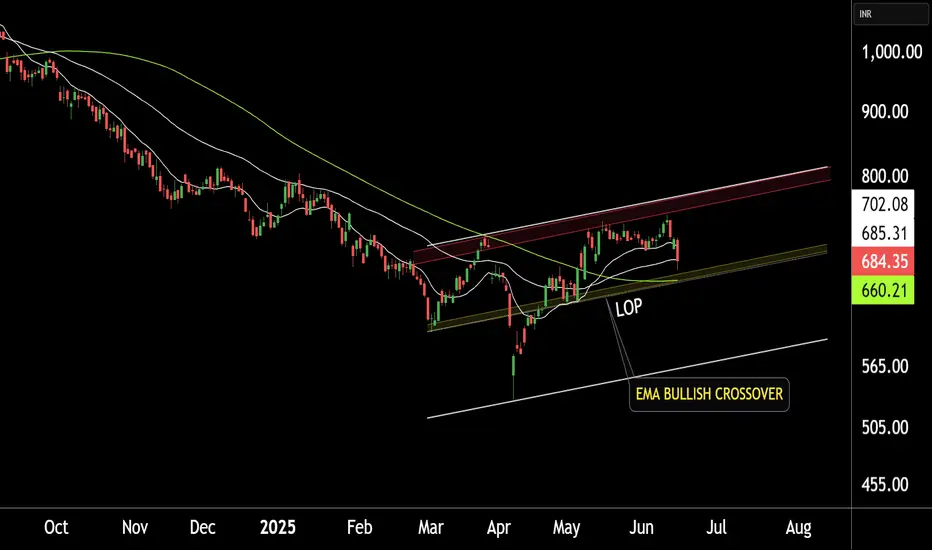
TATA MOTORS LTD at BEST SUPPORT !!This is the Daily chart of TATA MOTORS LTD.
TATA MOTORS having good law of polarity at 660 range.
TATAMOTORS has given a positive EMA crossover, with its support range lying around 660-680.
If this level is sustain , then We may see higher price in TATAMOTORS.
Thank you !!