Charging up for $20?$BLNK seems to be in downtrend, and there is a high possibility of channel bounce as we have hit the channel boundary. Currently oversold as the market goes beyond the channel boundary.
Trade idea 💡
Entry: "Only" after stock goes back in the channel and confirms upward momentum ($16.25+)
Exit: Between $19-20 as market reaches channel boundary and resistance
Disclaimer: This is not financial advice. Please make your own decisions while making an investment.
Channeltrend

Next move on SPXUnfortunately the market sentiment is very negative, SPX can break the down channel either down or up. Watch the VIX for more anticipation - it is nearing its 2SD where we could see some reactions as it acts as resistance. In case it goes up towards 45, we will see SPX dropping to 3200 area, in case VIX would cool down to its average values, there could be a 30 - 40 days rally..

V daily bullish hammerOrder BUY V NYSE Stop 180.58 LMT 180.58 will be automatically canceled at 20230101 00:00:00 EST
V daily bullish hammer in oversold area if hold within a channel will move up.

C98 - Bullish ChannelC98 seems to have entered a bullish channel on the 2H timeframe and it is currently flirting with its lower bound.
Would open a call with tight stop loss at the intersection with the lower bound, which, if get broken, will trigger a dump in price.

$SILVER bouncing from 2 year downtrend channel supportDowntrending channels are powerful
indicators. Watch silver to see if this pattern continues.
$SILVER will probably bounce back towards middle of channel
(dashed line) 21.40

#XRP Still CozyFailed the first attempt at breaking .49
I think she gears up to try again
Looking for a long entry at around .44-.45

VIX Feels Like a Smoldering Volcano 🌋 Post-2020 Parabolic MoveThe consolidation pattern in the $VIX goes back to June 2020 after the initial COVID flash-crash scenario.
From June '21 to November '21, you started to see a bottoming formation turning into a new uptrend , subtle as might've been. The uptrend has chopped around in this rising channel since the end of 2021 up until the recent false breakdown during August 2022.
This head fake has allowed the $VIX to retake the bottom of the channel and continue up and up after every headline the market fears. Despite the approach of overbought levels, the bear market rally on Wednesday, September 28 gave volatility room to run.
It appears probable a consolidation pattern around 36-38 will level off the relative strength as of late, occurring for the month of October when the market could stage a short-term rally. Coincidentally, this will set up the $VIX right into the midterm elections...
To be clear, sirens won't start popping off on $SPY $QQQ and $DIA until a decisive, sustained move over 36.79 occurs. If that happens, a move to 47.20 seems like a no-brainer.
Notably, that is a test of the top of the rising channel , confirming 2 technical scenarios with the midterm elections as the catalyst for the next leg.
Keep your head on a swivel and keep an eye on the volatility of $VIX $TLT and $DXY for directional signposts in the broader market. Also, it's important to remember Jerome Powell and other Fed officials, Russian tensions, Europe energy or monetary headlines, and CPI could all eliminate this hypothesis.

VIX Feels Like a Smoldering Volcano 🌋 Post-2020 Parabolic MoveThe consolidation pattern in the TVC:VIX VIX goes back to June 2020 after the initial COVID flash-crash scenario.
From June '21 to November '21, you started to see a bottoming formation turning into a new uptrend , subtle as might've been. The uptrend has chopped around in this rising channel since the end of 2021 up until the recent false breakdown during August 2022.
This head fake has allowed the TVC:VIX to retake the bottom of the channel and continue up and up after every headline the market fears. Despite the approach of overbought levels, the bear market rally on Wednesday, September 28 gave volatility room to run.
It appears probable a consolidation pattern around 36-38 will level off the relative strength as of late, occurring for the month of October when the market could stage a short-term rally. Coincidentally, this will set up the TVC:VIX right into the #MidTerms...
To be clear, sirens won't start popping off on AMEX:SPY , NASDAQ:QQQ , and AMEX:DIA until a decisive, sustained move over 36.79 occurs. If that happens, a move to 47.20 seems like a no-brainer.
Notably, that is a test of the top of the rising channel , confirming 2 technical scenarios with the midterm elections as the catalyst for the next leg.
Keep your head on a swivel and keep an eye on volatility of TVC:VIX , NASDAQ:TLT , and TVC:DXY for directional signposts in the broader market. Also, it's important to remember Jerome Powell and other Fed officials, Russian tensions, Europe energy or monetary headlines, and CPI could all eliminate this hypothesis.


Potential Oil Buys Potential buy from support/HTF channel bottom, will be entering with a break of that TL and the previous swing high, once I have that confirmation ill be pulling the trigger!
Let me know your thoughts!

XAUUSD LongI long xauusd at 1668
stop loss at 1652
and take profit at 1711
best tips of trade is partial entry and partial exit.
my risk per trade is 1 - 3 %.

EURNZD Pullback and Move Up to ResistanceWelcome back! Let me know your thoughts in the comments!
**EURNZD - Listen to video!
We recommend that you keep this pair on your watchlist and enter when the entry criteria of your strategy is met.
Please support this idea with a LIKE and COMMENT if you find it useful and Click "Follow" on our profile if you'd like these trade ideas delivered straight to your email in the future.
Thanks for your continued support!
Brian & Kenya Horton, BK Forex Academy

ETHUSD - Fib Channel and 20K Since BTC hit 20k in 2017 its only appropriate that ETH goes for 20K following 2022
Situations in Green boxes are very similar
The first box however is a lot more aggressive growth than I expect

LUNA is Ready For Long PositionLUNA /USDT is Going to get a good setup for Long POSITION
you can get this position with LEV10 X
Good Luck & dont forget to set SL & TP

TRIDENT Daily Time FramTrident give a nice channel breakout but its now consolidated with same range its only strong above 42.5 level then only we can expect some good amount of target

long position is EURGBPAccording to the strategy that I use based on it, the overlap of support has been attractively formed in the weekly time. The roof of the channel is also authentically broken.
On the other hand, in the monthly time, the rsi oscillator trend line is also broken, which can be considered as a confirmation.
With all these conditions, it is logical to enter a long position.

Long Term Channel Up - Near ProtocolLong term channel up --
Weekly Double Potentially forming
Swing to top of channel

AUDCAD it will rise to the middle of the channel
Welcome back! Let me know your thoughts in the comments!
**AUDCAD - Listen to video!
We recommend that you keep this pair on your watchlist and enter when the entry criteria of your strategy is met.
Please support this idea with a LIKE and COMMENT if you find it useful and Click "Follow" on our profile if you'd like these trade ideas delivered straight to your email in the future.
Thanks for your continued support!
Brian & Kenya Horton, BK Forex Academy

$CRWD H&S Bear Pennant Breakdown$CRWD is breaking down through channel support and top formation.
Patience.

GBPUSD - LONGConsider the formation of North Impulse from Major Resistance Level. Buy on a false breakout! The target is next Supply Zone.
GBPUSD - LONG
ENTRY PRICE - 1.14450
SL - 1.13700
TP - 1.18000
Always follow the 6 Golden Rules of Money Management:
1. Protect your gains and never enter into a position without setting a stop loss.
2. Always trade with a Risk-Reward Ratio of 1 to 1.5 or better.
3. Never over-leverage your account.
4. Accept your losses, move on to the next trade and trust the software.
5. Make realistic goals that can be achieved within reason.
6. Always trade with money you can afford to lose.
Please leave your comment and support me with like if you agree with my idea. If you have a different view, please also share with me your idea in the comments.
Have a nice day!

XAU/USD Rebounds Again!• On the H1 chart, you can see that XAU/USD found support just beneath the downside line of the channel. Only a false breakdown and an upside turn were registered. It tested the S1 (1,706) static resistance (support turned into resistance).
• It has formed a flag pattern in the near term, which is considered a bearish formation. Major uphill challenges are represented by 1,711 and the downtrend line.
• "Keep it Simple", Good Luck!

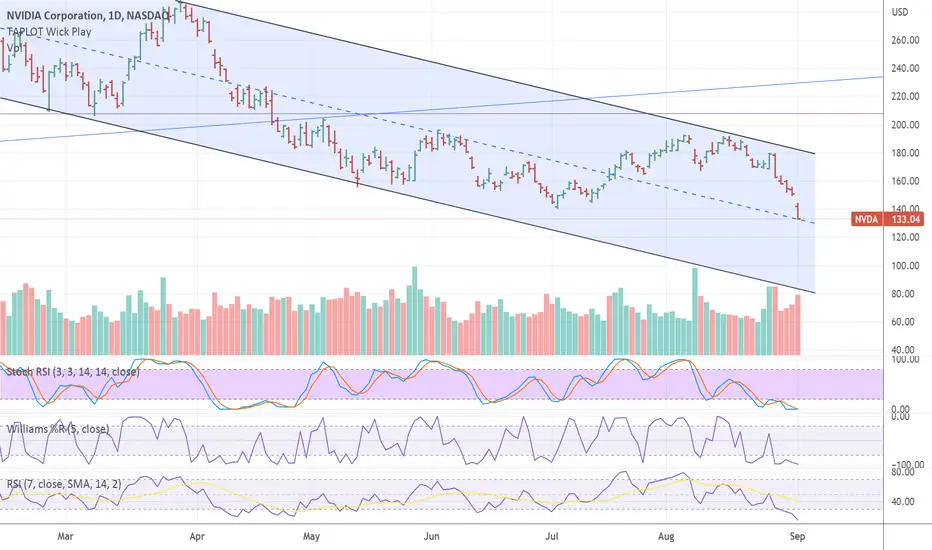
$NVDA downtrending channelWill $NVDA get support from dashed mid-line of down trending channel?
This dashed line was resistance before. $NVDA is a nice technical
chart to watch. Lots of professional engineers, who now trade, like to trade
$NVDA which makes it great for technical analysis.
EURCHF 4 Hr. Intraday Short Set Up!Welcome back! Let me know your thoughts in the comments!
**EURCHF - Listen to video!
We recommend that you keep this pair on your watchlist and enter when the entry criteria of your strategy is met.
Please support this idea with a LIKE and COMMENT if you find it useful and Click "Follow" on our profile if you'd like these trade ideas delivered straight to your email in the future.
Thanks for your continued support!
Brian & Kenya Horton, BK Forex Academy
