CADJPY Swing Upwards +100 PipsWelcome back! Let me know your thoughts in the comments!
**CADJPY - Listen to video!
We recommend that you keep this pair on your watchlist and enter when the entry criteria of your strategy is met.
Please support this idea with a LIKE and COMMENT if you find it useful and Click "Follow" on our profile if you'd like these trade ideas delivered straight to your email in the future.
Thanks for your continued support!
Brian & Kenya Horton, BK Forex Academy
Channeltrend

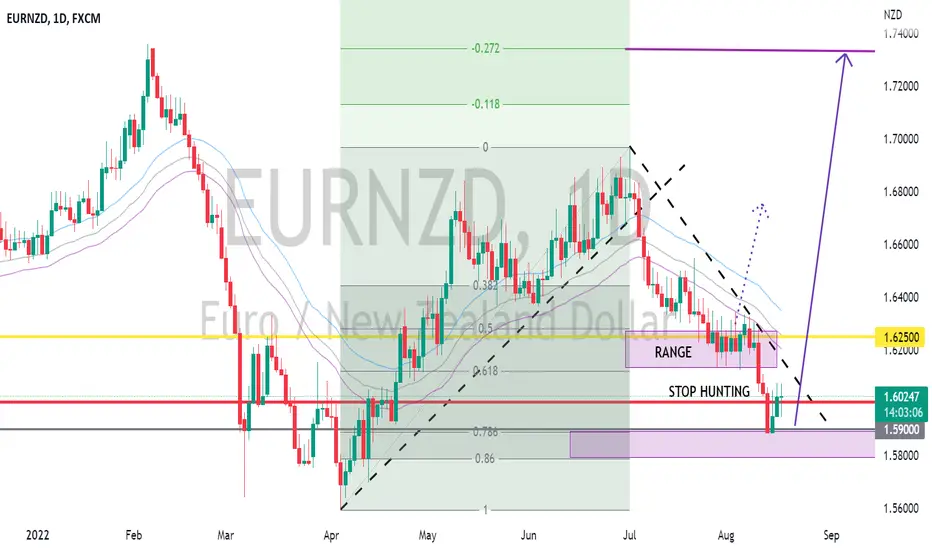
EURNZD LONG OVERVIEW AFTER WHAT LOOKS LIKE STOP HUNTINGPrice stayed for awhile tanging around 1.62000. Also 61.8 retracement level which would have induced retail traders to take long swing positions. The fast drop for 3 days looks like it was a STOP HUNTING Party. We are now Looking to trade it SWING LONG to 1.27 Fib Extension. Our Final TP. Taking smaller positions above the channel as we head to 1.27 Fib LEvel.
APLAPOLLO TUBES STOCK CAN TAKE BUYWeekly time frame it is in channel so we can take buy now and do a swing trade

HDFCLIFE is testing the trendline HDFCLIFE is testing the trendline u can go LONG (BUY) and do swing trade...and stoploss at ₹547 target at ₹617

GBPJPY Intraday SHORT Opportunity Welcome back! Let me know your thoughts in the comments!
**GBPJPY - Listen to video!
We recommend that you keep this pair on your watchlist and enter when the entry criteria of your strategy is met.
Please support this idea with a LIKE and COMMENT if you find it useful and Click "Follow" on our profile if you'd like these trade ideas delivered straight to your email in the future.
Thanks for your continued support!
Brian & Kenya Horton, BK Forex Academy

XAUUSD BreakoutHi Friends
Gold has broken the bearish channel. now we are looking for a buying opportunity. I have analysis as my best. if you like my analysis then follow, like, and comment Please

long position is more logical than shortConsidering the overlap of support and trend line, it is expected that MACD divergence will work and usdchf currency pair will get a good buying position in these areas towards the high targets.

NIFTYHello and welcome to this analysis on NIFTY
From the high's of 18600 made in October 2021, every pullback leg of Nifty has been approx 88%
18350 on 18 Jan 2022 was 88% of the decline from 18600 to 16410
18115 on 4 April 2022 was 88% of the decline from 18350 to 15670
The current rally is at 78% of the decline from 18115 to 15185.
So what lies ahead, lets try to decipher probable scenarios
1. 88% retracement is near 17765 that coincides with the falling trend line - History repeats itself, rally ends near it, "tata, bye-bye, see you Longs."
2. It will breach above the falling trendline and continue its rally towards 18400 at least - Bull party continues, almost everything from A to Z eventually moves up, everyone (except those looking for a pullback and/or short) are happy!
3. It has completed its pullback and will do a pullback/resume downtrend, earliest confirmation as of today would come once it starts sustaining below 17375. - Just when everyone was hopeful that stocks are coming closer to their purchase cost, those stocks which have made us FII - "Full Invested Indians", because we bought them at very high levels and exiting in decline would have cost a huge loss, so holding onto these till .... ! PS This is not for Investors, this is for traders who become forceful investors in stocks where exit did not happen.
Until then
Happy Investing & Safe Trading


DLB Short-> DLB has been ranging in this sideways channel
-> past two earnings have hammered the stock down to the bottom of the channel
-> short and simple (short from the top, take profits at the bottom)
-S/L @ ~$80
Just my opinion/not financial advice, cheers!

Potential Selling opportunity on NAS100The NAS100 is currently trading around 13340, which is the 3rd touch on the trendline that started on December 2021,
We can a trend resistance at that point, so i expect a bearish reversal from 13349
Market has been overbought and RSI, Stochastic and CCI
i will be waiting for a bearish confirmation to enter the market
This is my analysis
whats your take on this traders
!!! Trade with care

EURUSD Possible bullish channel...watch outhere is my channel for EURUSD for these days...hope to traders to use this at their trades.

btc following this channel btc following this channel and made a head and shoulders , now we can see 21500 and if it broken down line we will see 20000 and less down

Exide: Nothing exciting anymore - SELLThe NP run rate of 200 after the one off profits in March quarter. Stock in a downward channel since Jan 2021.

btc 4H channel structureBest Trader ,
as you see the btc inside a channel , until yet i dont have any price action for confirming (short or long ) , if you see this structure on 1H you will find the RSI on bottom thats why i,m afraid to go short , i will wait maybe for a trap with price action so i have more confirmation
thanks

Stocks Markets Breakout or Reversal ? [Arabic Language]S&P500 gains a lot in the past week, is this the end or the downtrend? is it the bottom?
We should monitor the main levels here at $4200, it will tell us!

Gold/Silver Fibonacci ChannelSince the beginning of 2021 Gold/Silver parity making an obvious channel. $87 - $85 area is important support and $100 is the target. Even if parity decreases till $80 we're gonna be still in the channel and we still have chance to go to $100.

GOLD - Sell IdeaSell Idea on GOLD .
GOLD is in a down channel making Lower Lows and Lower Highs and is currently at a Resistance Level off the daily time frame.
We anticipate the market to fall to 1614.7/1598.4 mark as we making new Lows .
TP 1 - 1614.7
TP 2 - 1598.4
SL - 1887.2

NQ - Tweezer BottomI posted on 7th July that there was a potential bullish divergene on the monthly chart of Nasdaq, and it has since come true. What is interesting is that we are now seeing a potential "tweezer bottom" on the monthly as well (both bullish).
The daily chart has been trading within a rising channel. With FOMC out of the way, there is a good chance for NQ to reach 13000 in the near future. Has the market turned the corner for good after hitting a low of 11,000 on 16 June? We won't know for sure but I would be a bull rather than a bear in the near term. Watch for market reactions to earnings of the big boys (namely FAANG stocks and take the cue from there.
Disclaimer: Just my 2 cents and not a trade advice. Kindly do your own due diligence and trade according to your own risk tolerance and don't forget that money management is important! Take care and Good Luck!

EURUSD AnalysisCurrently, the EURUSD is in a downward channel in the daily time frame, and if it breaks this channel upwards, the first resistance zone it has is the range of 1.06710 to 1.07930 .
if it breaks the channel from the bottom, the first support zone is the range of 0.97509 to 0.96.
You can also switch between channels !

shortGBP/USD just tested the descending channel and above we have a psychological level we expect a short time sell to the zone down before moving upwards

eursud 1D channel priceBest Traders ,trend
on 1D there is a big channel price broke out down , i zoomed in 4H timeframe there is correction small up trend broke out down also and the price retest now the small trend , if this is real broke than we wait for good price action to take short .
thanks
