THETA curved channel with supports and resistancesMAGENTA CHANNEL
This is a curved projection channel created upon a bounding box. The chart is presented over a LOG price scale. For its creation we use 3 "curved line boundaries" that cover the center, upper and lower limits for potential movement. Even if this not an attempt to forecast a trend or future scenario, it allows to have an easy to read view of probable limits and oscillation parameters.
Just sharing my personal charts for learning purposes only. This is not an investment recommendation.
Channeltrend

GBP/USD Possible Long-Term SellingGBP/USD possible short-setup as price on 4hr creates a legit head & shoulders. Price still may hit level before showing in bearish candle play for selling. Keep in mind price can still also push above resistance level, be careful how you play this. I'll be watching candle play as well as my ema's as price reacts to resistance line and trendline. What are your thoughts?

AUDCAD - A pitstop before further fall?
In our previous idea we predicted a drop after bouncing off the upper channel line, which we've seen the beginnings of.
AUDCAD still appears bearish, but we are entering a Demand Zone that could create a bounce or choppiness, which might give those who didn't get short the chance to do so at a better price, if they also believe that price is likely to head toward the bottom of the channel, in line with the overall bearish trend on the higher timeframes.
Those already short may choose to take some profit off the table to reduce risk, with a plan to re-enter at a better price.

CTK curved channel with supports and resistancesMAGENTA CHANNEL
This is a curved projection channel created upon a bounding box. The chart is presented over a LOG price scale. For its creation we use 3 "curved line boundaries" that cover the center, upper and lower limits for potential movement. Even if this not an attempt to forecast a trend or future scenario, it allows to have an easy to read view of probable limits and oscillation parameters.
Just sharing my personal charts for learning purposes only. This is not an investment recommendation.

MIR curved channel and arcsYELLOW ARCS
General price trajectory floor.
MAGENTA CHANNEL
This is a curved projection channel created upon a bounding box. The chart is presented over a LOG price scale. For its creation we use 3 "curved line boundaries" that cover the center, upper and lower limits for potential movement. Even if this not an attempt to forecast a trend or future scenario, it allows to have an easy to read view of probable limits and oscillation parameters.
Just sharing my personal charts for learning purposes only. This is not an investment recommendation.

BOSON curved channel and arcsYELLOW ARCS
General price trajectory floor.
MAGENTA CHANNEL
This is a curved projection channel created upon a bounding box. The chart is presented over a LOG price scale. For its creation we use 3 "curved line boundaries" that cover the center, upper and lower limits for potential movement. Even if this not an attempt to forecast a trend or future scenario, it allows to have an easy to read view of probable limits and oscillation parameters.
Just sharing my personal charts for learning purposes only. This is not an investment recommendation.

VET curved channel with supports and resistancesMAGENTA CHANNEL
This is a curved projection channel created upon a bounding box. The chart is presented over a LOG price scale. For its creation we use 3 "curved line boundaries" that cover the center, upper and lower limits for potential movement. Even if this not an attempt to forecast a trend or future scenario, it allows to have an easy to read view of probable limits and oscillation parameters.
Just sharing my personal charts for learning purposes only. This is not an investment recommendation.

BTC pattern replicationBTC channel updated with added found pattern
It looks like there is an imminent correction before the next BTC bull run
So this points to a SHORT before the LONG
Target date points to mid January and price could be around 43k
MAGENTA CHANNEL
This is a curved projection channel created upon a bounding box. The chart is presented over a LOG price scale. For its creation we use 3 "curved line boundaries" that cover the center, upper and lower limits for potential movement. Even if this not an attempt to forecast a trend or future scenario, it allows to have an easy to read view of probable limits and oscillation parameters.
Just sharing my personal charts for learning purposes only. This is not an investment recommendation.

AUD/USD Price Bearish ImpulseCan price continue this strong impulse. If price breaks 4hr support, I will be looking for the retest and bearish candle play before entry. If price resist 4hr support I will be looking for bullish candle play for entry. Let me know your thoughts and analysis on this play!

Channel your inner CHILIZCHZ is trading near the bottom of this channel where there is long-term support. For it to move upward it needs to clear the key resistance levels marked by the fibs (mainly the 38.2 and 61.8) and the upper channel trend line.
Please note I am not a financial advisor and this is not financial advice. All charts are for educational purposes only! :)

BTC channel with probable limits and momentumBTC channel updated .
The blue arcs show the lowest dynamic limits and are the most important indicators on this chart. The magenta channel attempts to find the outer scope limits.
The probable movements should happen between the blue arc and the roof of the magenta channel.
MAGENTA CHANNEL
This is a curved projection channel created upon a bounding box. The chart is presented over a LOG price scale. For its creation we use 3 "curved line boundaries" that cover the center, upper and lower limits for potential movement. Even if this not an attempt to forecast a trend or future scenario, it allows to have an easy to read view of probable limits and oscillation parameters.
Just sharing my personal charts for learning purposes only. This is not an investment recommendation.

USDCHF at bottom of rising channelUSDCHF could be set to have it's first positive day since 21st December as it sits within the lower boundary of a rising channel.
We also have a recent supply zone directly below the channel boundary offering additional support.
This looks like a potentially high risk reward trading opportunity, market structure is bullish and we have seen a strong serious of higher lows - I don't expect structure to break here so a bounce before the bottom of the supply is my expectation.
This is not financial advice, you are responsible for your own trading decisions.
*** PLEASE LEAVE A LIKE AND FOLLOW TO SHOW YOUR SUPPORT ***
Any questions or comments I'd be happy to discuss below.

COLPALColgate broke out of descending channel on 30 mins chart.
Could b bought with mentioned sloss & tgts.


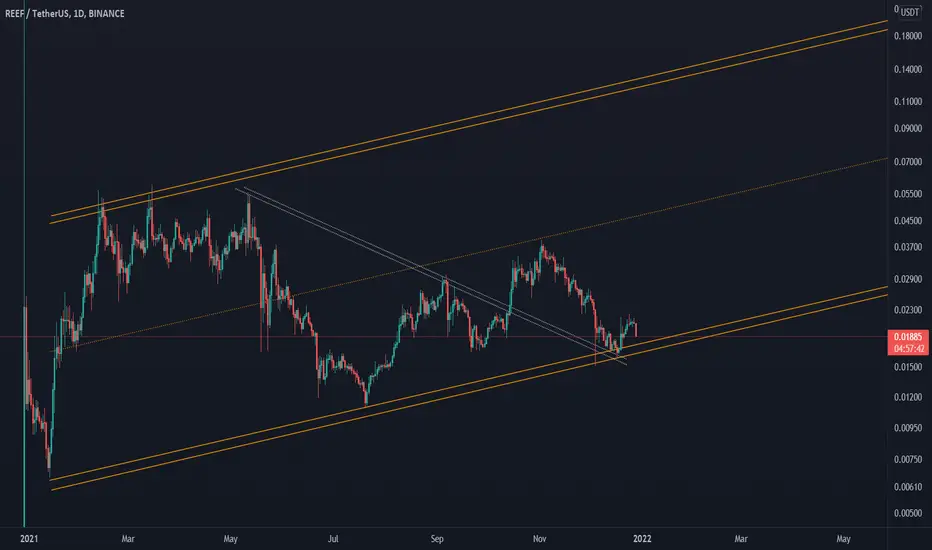
reefIt is on the bottom of the ascending channel and Trigger Price Action has activated itself
It can go down to the bottom of the canal, but overall it is a long-term uptrend.
BITCOIN FALLING CHANNEL 2HBITCOIN is moving on falling channel in 2h timeframe, the target of the breakout is 51k+, and the target of the breakdown is 41k+, this is not financial advice, Thank you!!

BTC channel with probable limits and momentumBTC channel updated.
The cyan arcs show the curved limit trajectories. Middle cyan arc is tested at this moment for a break into BEAR or BULL market.
MAGENTA CHANNEL
This is a curved projection channel created upon a bounding box. The chart is presented over a LOG price scale. For its creation we use 3 "curved line boundaries" that cover the center, upper and lower limits for potential movement. Even if this not an attempt to forecast a trend or future scenario, it allows to have an easy to read view of probable limits and oscillation parameters.
Just sharing my personal charts for learning purposes only. This is not an investment recommendation.

XELA channels and divergencies asking for reversalRSI , MACD vs channel divergency , double bottom ... Seems like a step before trend reversal .

$F - Walking up the ChannelFord has been an awesome name to trade recently.
You can consistently enter a trade when we're at the bottom of the trade, and wait to catch a rip to the top.
Even on a volatile day like today, we were safely given an opportunity to enter the channel and ride it back up to the top.
I'll be looking to exit my position around 21.2!

ASUR may be coming up for a range play.$ASUR may be coming up for a range play. Expecting +/- 2.5% downside before a reverse to the upside.
Possible trade play:
~3.3 risk ratio by looking to open a position around $8.5.
SL at 8.05 for a 5% draw down.
Looking to get out around 9.95 for a ~17% gain.
CFO & CEO bought 10,000 shares each at $8.75 on the 12th of November
Current analist price target is $13.

USDT.D curved channel and resistance pointsThis is a curved projection channel created upon a bounding box. The chart is presented over a LOG price scale. For its creation we use 3 "curved line boundaries" that cover the center, upper and lower limits for potential movement. Even if this not an attempt to forecast a trend or future scenario, it allows to have an easy to read view of probable limits and oscillation parameters.
Just sharing my personal charts for learning purposes only. This is not an investment recommendation.

$TSM - Weekly Swing Candidate!I am a huge fan of this $TSM chart! We've been consolidating for a while now, and have finally started putting in higher lows!
Will be looking to play a break of the 124 level, likely with 12/17 130Cs.

BTC curved channel and arcsBTC channel updated.
The yellow arcs show the internal followed cycles.
MAGENTA CHANNEL
This is a curved projection channel created upon a bounding box. The chart is presented over a LOG price scale. For its creation we use 3 "curved line boundaries" that cover the center, upper and lower limits for potential movement. Even if this not an attempt to forecast a trend or future scenario, it allows to have an easy to read view of probable limits and oscillation parameters.
Just sharing my personal charts for learning purposes only. This is not an investment recommendation.
