Silver Gains on Tensions, Eyes on FedFriday’s strong U.S. data may support the dollar, as the University of Michigan’s Consumer Sentiment Index rose to 60.5 in June from 52.2, beating forecasts of 53.5 and marking the first gain in six months.
Geopolitical tensions continue to drive safe-haven demand, especially for silver. Israel struck Iranian nuclear and missile sites Friday, killing military officials. On Sunday, Iran began its fourth phase of response, warning of firm retaliation to further Israeli actions.
Markets now turn to Wednesday’s Fed meeting. While rates are expected to stay unchanged, futures still price in two cuts this year, possibly starting in September, supported by last week’s soft inflation data.
Resistance is set at 36.90, while support stands at 35.40.
Chartanalysis

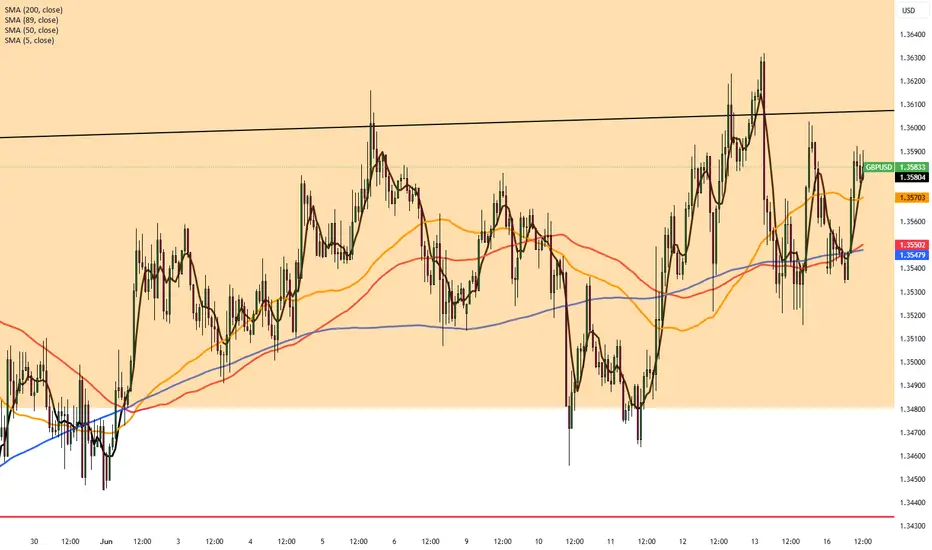
Pound Stable as Markets Eye BoE, Fed MovesGBP/USD remains below Friday’s three-year high, trading around the mid-1.3500s in a narrow range during Monday’s Asian session. The pair shows limited downside as traders await a busy week of key data and central bank decisions.
Markets are watching the UK CPI on Wednesday and the Bank of England’s policy announcement on Thursday, both crucial for the Pound. The US Federal Reserve will also decide on rates Wednesday, likely guiding the dollar’s short-term path.
Friday’s UK GDP showed a 0.3% contraction in April, increasing bets on faster BoE rate cuts. The USD is supported by safe-haven flows due to Middle East tensions, though soft US inflation data has raised expectations for Fed cuts by September. A broadly positive global risk mood is offering some support to GBP/USD.
Resistance is at 1.3600, with support around 1.3425.
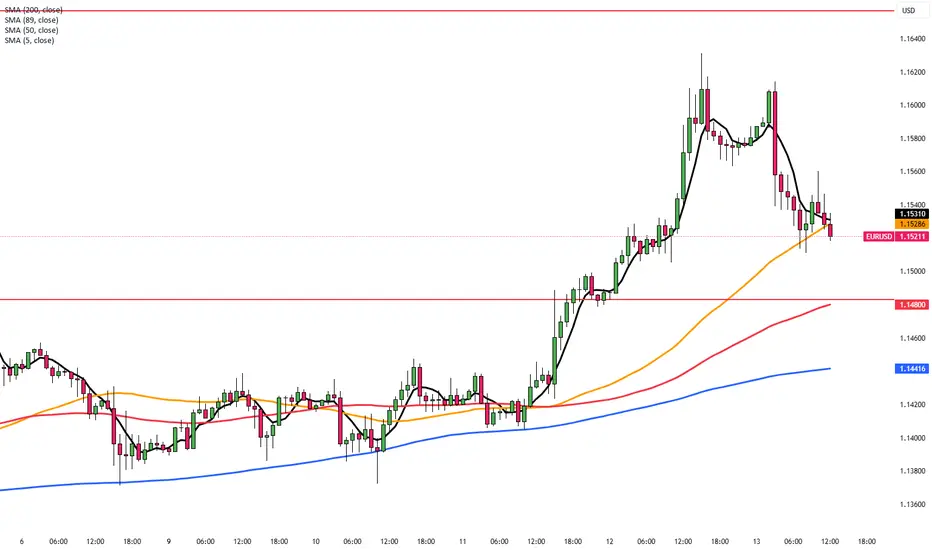
ECB’s De Guindos Sees Balanced Inflation RisksEuropean Central Bank Vice President Luis de Guindos said Monday that the EUR/USD at 1.15 does not hinder the ECB’s inflation goal, noting the euro’s gradual rise and stable volatility.
He stated inflation risks are balanced, with little chance of falling short of the target, and that markets have clearly understood the ECB’s recent policy signals. De Guindos reaffirmed the ECB is close to its inflation objective
Looking ahead, he warned that tariffs could slow growth and inflation in the medium term but expressed confidence in the Fed maintaining swap line arrangements. He also confirmed there have been no discussions about repatriating gold reserves from New York.
At the time, EUR/USD was down 0.09%, trading near 1.1537.
Resistance is located at 1.1580, while support is seen at 1.1460.

XRp/USDTFor Ripple, according to the chart, we are in a wide trading range, and according to the lines I drew, I am waiting for a reaction to them. I have a rule: if I don't understand a part of the chart, I won't enter. Tell me your opinion, be sure.

ETH/USDTWe have talked about Ethereum many times and said that the main goal of Ethereum is 3000. Ethereum has had an upward movement and is now in a channel. The last movement it had led to a failure and it went back inside. I think Ethereum is bullish. Comment your opinion.

BTC/USDTWhenever Bitcoin goes above 106k, we can enter a long position at the target I specified on the chart. What do you think? Tell me.

Monthly Closing above 122000 will be a +ve sign.KSE100 Closed at 122143.57 on 13-06-2025
Monthly Closing above 122000 will be a +ve sign.
However, if the Index Stays above 122700, we may
witness upside again.
Breaking 118600 would bring more selling pressure.
& then Important Support would be around 112000 - 113000
and then around 110000.

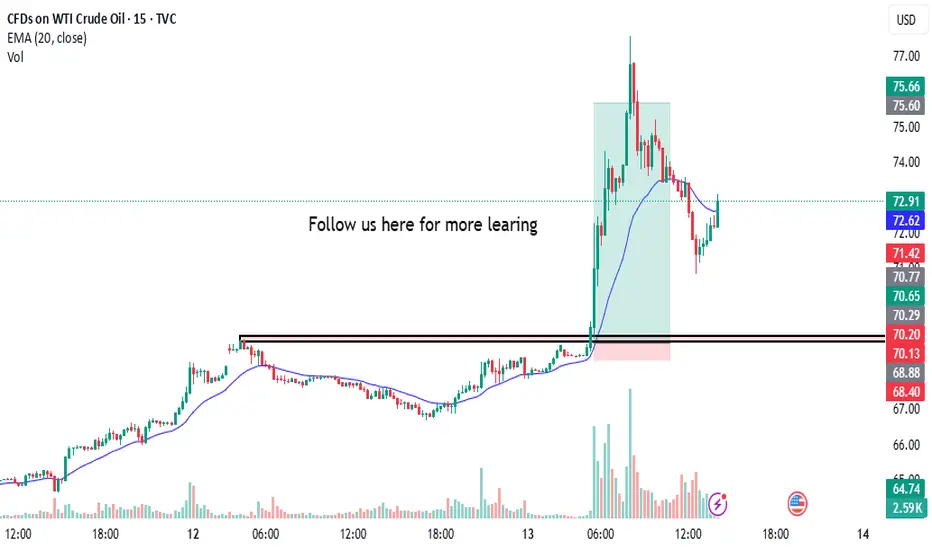
Captures 1:15 in US OIL Today i captures 1:15 in us oil
the annalysis was simple and clean as always i took trade on breakout of zone with proper research & annalysis and booom, as always we got our profit
follow us for more learing here
NAVA LIMITED – Bullish breakout in 1d soonNAVA Limited is currently exhibiting strong bullish momentum, supported by both technical indicators and improving fundamentals. The stock has shown a sustained uptrend with higher highs and strong volumes, indicating buyer dominance.
✅ Key Bullish Factors:
📊 Strong Fundamentals: Consistent profitability with solid EBITDA margins and minimal debt. Recent buyback reflects management's confidence in the company.
💡 Technicals in Favor: Price trading above key moving averages (20/50/100 EMA), showing strong trend continuation.
🔄 Breakout Confirmation: Stock recently broke past a key resistance zone and is now forming a new base, suggesting potential for the next leg up.
📈 Momentum Indicators: RSI above 60, MACD showing bullish crossover, and volume buildup on green candles.
🏭 Diversified Business: Exposure to energy, ferro alloys, and mining – adding stability and growth potential.
🎯 Potential Upside Levels:
Immediate Target: ₹658
🔒 Stop-Loss: ₹419 (Below key support or recent swing low)
📌 Strategy: Ideal for swing or positional traders looking for high-probability setups with risk-reward in favor.
🧠 Disclaimer: This is not investment advice. Please conduct your own analysis or consult a financial advisor before making any trading decisions.

₿ Bitcoin: SlippedAfter holding steady for two days, Bitcoin broke lower yesterday, confirming a setback within green wave B. This countertrend move delays the anticipated climb, which we still expect to reach its peak in the upper blue Target Zone (coordinates: $117,553 – $130,891). From there, bearish wave C should take over. The upper blue zone remains a tactical area for partial profit-taking or hedging long positions with shorts. Wave C is expected to drive the price sharply lower into the blue Target Zone (coordinates: $62,395 – $51,323), where we anticipate the completion of orange wave a. Orange wave b may trigger a corrective bounce, but ultimately, renewed downside should wrap up the intermediate correction of blue wave (ii). Still, there’s a 30% chance that Bitcoin forms a higher high as part of blue wave alt.(i)—temporarily breaching the upper blue zone.
📈 Over 190 precise analyses, clear entry points, and defined Target Zones - that's what we do.

Spotify: Target Zone AheadSpotify has already come quite close to our turquoise Short Target Zone (coordinates: $725.67–$829.30). In our primary scenario, we continue to expect further upside in the near term, as the projected peak of wave B should materialize within this zone—a range that could present opportunities to lock in long-side gains or initiate short positions. Once the top is in place, we anticipate a more pronounced downward move. The focus then shifts to the magenta Target Zone (coordinates: $452.69–$390.93), which we consider a potential accumulation range for new long positions. That said, we’re also monitoring an alternative path, currently assigned a 36% probability. In that scenario, magenta wave alt.(5) would already be underway—meaning prices would bypass the magenta zone altogether.
📈 Over 190 precise analyses, clear entry points, and defined Target Zones - that's what we do.

PVR INOX LTD at Support Zone.This is the 4 hours Chart of PVRINOX.
PVRINOX having good law of Polarity at 930 range.
If this level is sustain , then we may see higher prices in PVRINOX.
Thank You !!

Gold Surges Amid Middle East TensionsGold surged more than 1% to exceed $3,440, approaching record levels amid a sharp rise in safe-haven demand. The gains came after Israel's strike on Iran’s nuclear facilities, fueling concerns over a wider regional conflict. Uncertainty surrounding potential US tariffs added to market jitters. Additionally, softer US inflation data increased expectations for Federal Reserve rate cuts, enhancing gold's appeal as a non-yielding asset.
Resistance is seen at $3,430, while support holds at $3,350.
Weaker PPI Caps Dollar Strength in GBP/USDGBP/USD fell to around 1.3530 early Friday as escalating tensions in the Middle East supported demand for the US Dollar. Israel’s preemptive strike on Iran raised fears of retaliation, with Iranian officials warning of severe consequences for both the US and Israel, pressuring risk-linked currencies like the Pound. However, weaker US PPI data limited further USD strength. May’s PPI increased just 0.1%, below the 0.2% forecast, while the core PPI also came in softer. Attention now turns to the upcoming Michigan consumer sentiment report.
Resistance is at 1.3600, with support around 1.3425.

EUR/USD Slips on Geopolitical TensionsEUR/USD dropped to around 1.1530 on Friday, ending a four-day rally, as safe-haven demand lifted the US Dollar amid rising Middle East tensions.
Israel struck Iranian targets to weaken its nuclear program, prompting emergency measures. The US denied involvement but warned Iran not to target its assets.
Trump’s plan to expand steel tariffs from June 23 added trade uncertainty, while soft US inflation data kept Fed rate cut hopes alive.
Markets now await the US Michigan Sentiment report for further signals.
Resistance is located at 1.1580, while support is seen at 1.1460.
Yen Rallies as Risk Aversion ReturnsThe Japanese yen strengthened to approximately 143 per dollar, marking a third consecutive day of gains as investors turned to safe-haven assets following Israel’s preemptive strike on Iran. The operation, aimed at nuclear facilities, heightened global risk aversion. Adding to market uncertainty were renewed U.S. tariff threats by Trump. Meanwhile, BoJ Governor Ueda reiterated the bank’s readiness to raise interest rates if inflation nears the 2% target.
Resistance is at 145.30, while support stands near 142.50.

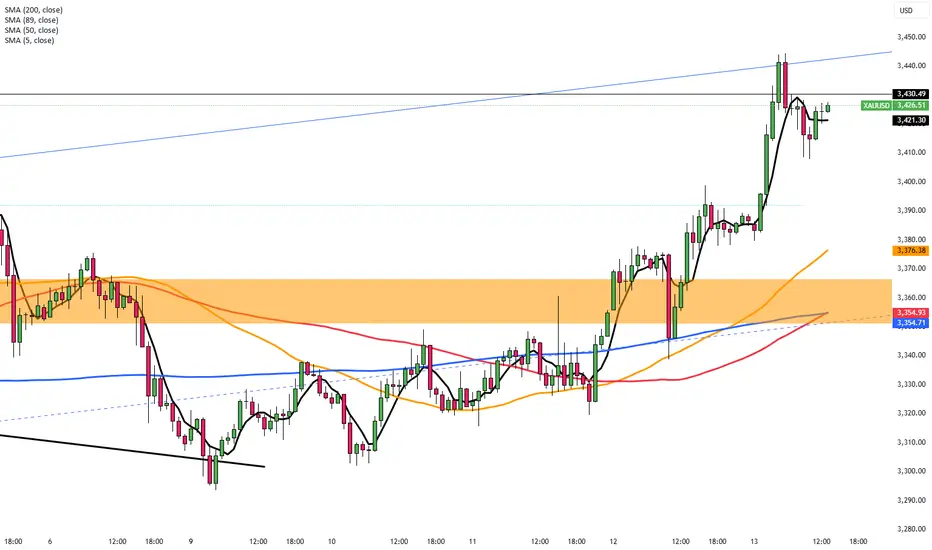
Gold (XAUUSD) Technical Breakdown : Structure Shifting + Target📍 Overview:
Gold (XAUUSD) has been displaying a classic technical development that traders need to pay close attention to. What initially looked like a smooth parabolic rally has now transitioned into a clear structure shift, as evidenced by the breakdown of a rounded support curve and rejection from a major resistance zone. The market is signaling a bearish retracement or even a deeper correction, and this setup offers potential trading opportunities both for short-term scalpers and swing traders.
📊 Chart Breakdown:
🔸 1. The Rounded Support Curve (Black Mind Curve):
The curve outlines a strong upward acceleration phase starting from the June 9 low.
This curve often acts like a dynamic support — similar to a parabolic trendline.
As long as price stays above it, the momentum remains intact.
In this case, Gold broke below the curve, which is a sign of exhaustion and potential bearish control.
🔸 2. Major Resistance Zone (~$3,417 – $3,427):
This level has acted as a ceiling multiple times in the past, visible in earlier highs from June 5 and 6.
Upon re-approaching this zone, price showed aggressive wicks to the upside followed by strong bearish candles — signaling institutional selling and profit-taking.
This triple rejection reinforced the resistance’s significance.
🔸 3. Structure Mapping and Transition:
After the breakdown, we observed a clean market structure shift: the formation of lower highs and lower lows, a key sign of bearish trend development.
The current price action is flowing downward in an organized pattern, suggesting further downside unless a strong reversal or bullish engulfing setup occurs.
🔸 4. Next Reversal Zone (~$3,360):
This area is identified as a high-probability support zone based on:
Past price reaction.
Previous accumulation zone from June 10–11.
Psychological round number proximity (e.g., $3,350 – $3,360).
Traders should monitor this level for potential reversal setups such as bullish engulfing candles, pin bars, or RSI divergence.
🧠 Market Psychology:
This pattern reflects a classic distribution phase at resistance after an emotionally driven uptrend:
Retail traders jump in late as the price approaches highs.
Institutions begin distributing (selling into strength).
Support breaks down as retail stops get triggered.
Price drops into a demand zone where accumulation may begin again.
Understanding this psychological cycle helps traders align with the smart money rather than chasing price action blindly.
🛠️ Potential Trading Plans:
✅ Scenario 1: Bearish Continuation
Wait for a retest of the broken structure (~$3,390 – $3,400).
Look for rejection patterns (e.g., bearish engulfing, shooting star).
Entry: ~$3,395–$3,400 | Target: ~$3,360 | SL: Above $3,420.
✅ Scenario 2: Bullish Reversal from Support
Monitor price action around $3,360 zone.
Look for bullish structure forming: higher lows, reversal candles, divergence.
Entry: On confirmation (e.g., bullish pin bar on 1H or 4H).
Target: Back to structure at ~$3,400–$3,410.
⚠️ Risk Considerations:
Avoid entering in the middle of the range.
Use proper stop-loss positioning to manage volatility.
Keep an eye on macro catalysts like:
US inflation reports
Fed commentary or interest rate decisions
Geopolitical tensions that can spike gold
🧭 Summary:
The market is unfolding a textbook technical setup:
Resistance rejection
Rounded support breakdown
Bearish structure
Approaching a high-probability support zone
Patience is key — let price come to your level. Watch the $3,360 zone for potential reversal, and use structure to guide entries and exits.
📌 Final Note:
This analysis is part of the MMC Methodology (Market Mapping Cycle), which focuses on identifying macro structure, confirming micro structure, and mapping turning points with precision.
Let the market reveal itself. Don't chase — plan and execute with clarity.

Nifty 23500 Either buying opportunity or just short covering !today on 13 June nifty again support on 23500 which is talking by us very important support level, look at here ultra-high volume appear on 9.15 candle, and we are seeing bounce back from here. it could become a good opportunity buy on dips but if really smart money pending order near 23500 so why this bounce back come with falling volume, I cleared on chart it might be just short covering. what is your opinion comment please.

GBPCAD SHORT FORECAST Q2 W24 D13 Y25GBPCAD SHORT FORECAST Q2 W24 D13 Y25
Professional Risk Managers👋
Welcome back to another FRGNT chart update📈
Diving into some Forex setups using predominantly higher time frame order blocks alongside intraday confirmation breaks of structure.
💡Here are some trade confluences📝
✅Weekly highs POI
✅1H order block rejection
✅4H order block rejection
✅15’ order block identification
🔑 Remember, to participate in trading comes always with a degree of risk, therefore as professional risk managers it remains vital that we stick to our risk management plan as well as our trading strategies.
📈The rest, we leave to the balance of probabilities.
💡Fail to plan. Plan to fail.
🏆It has always been that simple.
❤️Good luck with your trading journey, I shall see you at the very top.
🎯Trade consistent, FRGNT X

BEST XAUUSD M30 BUY SETUP FOR TODAYGold (XAU/USD) is showcasing strong bullish momentum after breaking above the key resistance zone near $3,404, now acting as fresh support. 🔄 The price formed a bullish structure with clean higher highs and higher lows on the 30-minute chart, confirming buying strength. 🟣 The marked demand zone around $3,392–$3,404 is critical—if price retests and holds this level, we can expect a continuation toward $3,420 and beyond. 🚀📌 Traders should watch for bullish confirmations on pullbacks to this zone for potential long setups. 🧠⚡

BTC/USDTDo you think Bitcoin has just formed a double top, or is it showing a different pattern? Personally, I think we might range a bit from here and then possibly continue the uptrend. I'm not really into pattern trading—so you tell me, are we bullish or bearish?"

Visa: Resistance ApproachingThe next key step for Visa should be overcoming resistance at $394.49 during magenta wave . However, if support at $339.61 fails to hold, our alternative scenario (33% probability) will be activated—suggesting the recent high already marked the end of the corrective wave alt. in magenta. In that case, a renewed decline below the $299 mark would be likely, aiming to complete the alternative turquoise wave alt.4 on a larger scale.
📈 Over 190 precise analyses, clear entry points, and defined Target Zones - that's what we do.

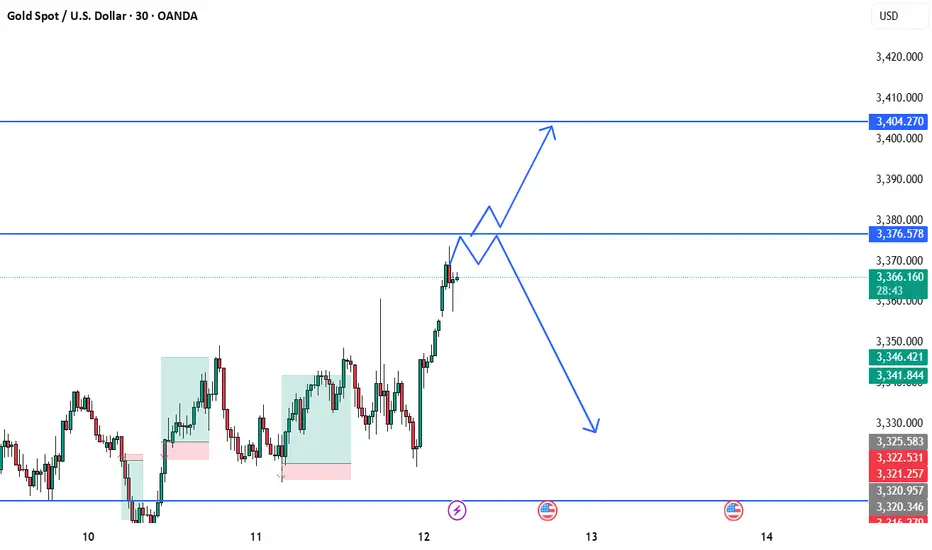
BEST XAUUSD M30 BUY AND SELL SETUP FOR TODAY Gold has shown a strong bullish push, breaking above recent consolidation and approaching a key resistance zone around $3,376. ⚔️ This area will be decisive — if price holds above it and confirms support, we could see a further rally toward $3,404. 📈✨ However, failure to sustain above this level could trigger a bearish rejection, pulling the market back toward the $3,330–$3,340 range. 📉🔄 Traders should wait for clear price action confirmation before entering. React, don’t predict! 🎯🧠