Analysis for SOL/BTC Pair:Current Market Structure:
The chart illustrates a clear range-bound structure with defined support and resistance levels.
The price has been oscillating within the horizontal range marked by:
Support: ~0.0018052 BTC
Resistance: ~0.0029090 BTC
Key Levels to Watch:
Support Zone (0.0018052 BTC):
This level has previously acted as a strong demand zone, and the price may attempt to rebound if it revisits this area.
Resistance Zone (0.0029090 BTC):
The price has failed multiple times to break above this level, as marked by points B, D, and F.
Potential Scenarios:
Bullish Case:
A successful breakout above 0.0029090 BTC could confirm a bullish wave (W3), pushing the price toward higher targets.
The next potential target beyond the range would be around 0.0045000 BTC, aligning with previous highs and psychological levels.
Bearish Case:
If the price breaks below the support zone at 0.0018052 BTC, a deeper correction could occur, leading to lower levels.
Traders should monitor for potential bearish continuation patterns below this level.
Elliott Wave Perspective:
The chart highlights the possibility of an Elliott Wave pattern forming.
The price might currently be completing wave E, preparing for a bullish wave W3 upward.
Market Sentiment:
The chart suggests indecision, with the price consolidating within the range.
A breakout on either side of the range could determine the next directional move.
Conclusion:
Bullish Breakout Confirmation: Look for a break and close above 0.0029090 BTC with high volume.
Bearish Breakdown Confirmation: Watch for sustained trading below 0.0018052 BTC.
Stay cautious of false breakouts and monitor overall market conditions for confirmation.
Chartanalysis

EUR/GBP: PAT + VPA 11/2/2024Good morning,
I will be closely observing the EUR/GBP currency pair on a daily basis, as I expect a bullish pullback or reversal to materialize in the forthcoming weeks.
- 1W / Weekly Analysis: The market has recently dipped to a low of 0.839, with current support established at 0.832. The price has tested the 0.832 level multiple times without breaching it, suggesting a diminished appetite for selling at this juncture. Additionally, the presence of significant wicks accompanied by relatively smaller bodies may indicate a potential selling climax.
- 1D / Daily Analysis: The daily time frame reveals the formation of a double bottom pattern at the weekly support level of 0.0832. Presently, the price is retesting the recent swing high of 0.84, which represents the latest peak. The price has demonstrated its capacity to remain above the 0.84 threshold, and I anticipate a continued upward movement towards 0.846 in the upcoming weeks.
OANDA:EURGBP
XETR:DAX
TVC:BXY
ThePipAssassin

Bitcoin struggles to break through Dec 17 daily close. In this video I discuss how Bitcoin could not break through the high from Dec 17 close ($106,187), and how that has been a significant resistance level even though Bitcoin has traded higher intraday, it has not been able to close above that level.

PNUTUSDT: Near Its Critical Pivot – Will the Market Make Its MovPNUTUSDT is sitting on the edge of a key threshold at $0.3188, just a breath away from its absolute low of $0.3044, set today. With an 87% plunge from its all-time high of $2.5084, the asset is signaling a potential turning point. RSI at 41.17 indicates a mildly oversold condition, setting the stage for either a rebound or a deeper dive.
Recent patterns, including VSA Buy signals and volume surges, suggest that bullish energy might be brewing just under the surface. Yet, the heavy resistance levels above at $0.3668 and $0.4176 could act as significant tests for any upward momentum. With macroeconomic factors steady but market sentiment edgy, PNUTUSDT traders face the pressing question: is this the bottom, or could another leg down be imminent?
This is a critical moment for both short-term traders eyeing quick reversals and long-term investors evaluating the larger picture. Will you seize the potential rebound or wait for clearer confirmation? Stay tuned – the next move could define the trend for weeks to come!
PNUTUSDT Roadmap: Patterns That Defined the Price Action
PNUTUSDT has been a rollercoaster for traders recently, with distinct patterns revealing the market’s intentions. Let’s dive into the key candle patterns and how they played out, separating the noise from actionable moves.
1. The "Increased Sell Volumes" Pattern (January 25, 2025)
Direction: Sell
Price opened at $0.3182 and closed at $0.3051. This bearish setup pushed the price near the asset's absolute low of $0.3044. The sell-off was decisive, as subsequent price action confirmed the direction with a continuation towards the $0.3044 low, validating the main direction of the pattern.
2. "VSA Buy Pattern Extra 1st" (January 24, 2025)
Direction: Buy
Opening at $0.3239, the price moved higher briefly but closed at $0.3182. While the main direction indicated a buy opportunity, the following sell-off undermined its potential, indicating this pattern failed to confirm its trigger.
3. "Increased Sell Volumes" (January 23, 2025)
Direction: Sell
Opening at $0.3561 and closing at $0.3527, the pattern confirmed its sell bias as the price dipped further in subsequent candles, aligning with the bearish sentiment. This gave traders an ideal short entry opportunity.
4. "Buy Volumes Takeover" (January 23, 2025)
Direction: Buy
Despite the bullish direction, this pattern struggled for validation as sell-side pressure dominated immediately afterward. This pattern underperformed, marking a skip in actionable moves.
5. "VSA Manipulation Buy Pattern 4th" (January 22, 2025)
Direction: Buy
This was the turning point. The price moved higher, confirming its trigger by closing above the previous resistance level and aligning with the predicted bullish move. Traders who caught this shift enjoyed a strong recovery rally.
Key Takeaways from the Roadmap:
"Increased Sell Volumes" patterns have consistently delivered, highlighting a reliable bearish trigger.
"Buy Volumes Takeover" patterns often need clearer confirmation to provide actionable trades.
"VSA Manipulation Buy Patterns" showed strength in directional accuracy, offering robust opportunities when validated.
This roadmap emphasizes how selective trading, focused on validated patterns, helps cut through the market's noise and capture meaningful moves. For traders, knowing when to act—and when to stay out—is the game changer.
Technical & Price Action Analysis: Key Levels to Watch
The PNUTUSDT market is heating up, and every trader knows that nailing the key levels can make or break your strategy. Here’s a breakdown of the most critical support and resistance zones on the radar right now. If these levels don’t hold, expect them to flip and act as barriers for price action—classic support-turns-resistance and vice versa.
Support Levels
First Support: $0.3044 — The absolute low and a key battleground. If buyers fail to defend this level, the bears might take full control. Second Support: $0.3668 — A short-term cushion for buyers to regroup. Losing this zone signals trouble for the bulls.
Resistance Levels
First Resistance: $0.3668 — If price fails to reclaim this level, it’ll act as a headwind for bullish momentum.
Second Resistance: $0.4176 — A crucial ceiling for bulls. Breakout above could open doors to new highs. Third Resistance: $0.4513 — A make-or-break zone for major trend shifts. Fourth Resistance: $0.5165 — Only serious bullish strength can push past this level. Fifth Resistance: $0.6692 — The long-term target for any meaningful upside.
Powerful Support Levels
Critical Zone: $0.6521 — This level must hold if the bulls want to regain control of the narrative. If breached, expect a deeper pullback.
Powerful Resistance Levels
Currently Undefined — Keep an eye on momentum and price reaction at the aforementioned resistance zones.
As always, respect these levels and watch for confirmations—breakouts need follow-through, and false moves can wreck your game. Trade smart, manage risk, and don’t chase—let the market come to you!
Trading Strategies Using Fibonacci Rays
Understanding the "Rays from the Beginning of Movement" concept allows traders to harness the natural dynamics of Fibonacci proportions and geometric levels. These rays provide a dynamic framework to identify key zones for price interactions, predicting possible reversals or continuations with precision. Let’s explore how to use these rays for your trading strategy.
Concept of Rays
Rays are constructed from the beginning of a movement pattern, providing dynamic levels that adapt as the market evolves. They rely on Fibonacci angles to establish critical zones where price interaction is likely to occur. Key insights include:
Price Interaction: Signals either reversal or continuation but requires confirmation from dynamic factors, such as patterns or volume shifts.
Adaptability: Rays adjust as new patterns emerge, creating a flexible approach to identifying key movement boundaries.
Complementary Analysis: Crossing points with moving averages (MA50, MA100, MA200, etc.) strengthen the significance of ray zones.
Two Scenarios: Optimistic and Pessimistic
Optimistic Scenario
Interaction with $0.3668 (Resistance Level): If price breaks this ray and confirms with volume and pattern, we could see a continuation to $0.4176 (next ray).
Interaction with MA100 at $0.3557: A confirmed close above this moving average signals a bullish trend with the potential to aim for $0.4513.
Final Target: $0.5165 as a long-term ray and Fibonacci convergence zone.
Pessimistic Scenario
Failure at $0.3668 Resistance: Price interaction signals rejection and a probable pullback to $0.3044 (Support Level).
Interaction with MA200 at $0.4328: A failure to break above could lead to a deeper sell-off to retest $0.3044.
Break Below $0.3044: A move below this level indicates strong bearish momentum, with $0.6521 becoming the next significant resistance as the price reverses.
Suggested Trades
Trade 1: Buy Breakout at $0.3668
Target 1: $0.4176
Target 2: $0.4513
Comment: Wait for a confirmed breakout with volume above the ray.
Trade 2: Short at Rejection Near $0.4176
Target 1: $0.3668
Target 2: $0.3044
Comment: Watch for bearish patterns or volume declines to confirm entry.
Trade 3: Buy Near $0.3044 Support Zone
Target 1: $0.3668
Target 2: $0.4176
Comment: Confirm with interaction at the ray and a bullish reversal pattern.
Trade 4: Short After MA200 Failure at $0.4328
Target 1: $0.3668
Target 2: $0.3044
Comment: Momentum loss and price rejection confirm bearish continuation.
Key Takeaway:
Trade between rays like stepping stones, moving from one target to the next. Confirm entries after interaction with rays and dynamic factors like volume or MA crossings. Each ray represents not just a technical level but a gateway to the next movement zone. Use this framework to navigate the market with confidence and precision!
Let’s Stay Connected and Trade Smarter Together!
Got questions or thoughts about the analysis? Drop them in the comments below—I’m always happy to chat and help clarify anything! Your feedback and discussions are what keep this trading journey exciting and collaborative.
If you found this idea useful, don’t forget to hit Boost and save it to track how the price moves along these mapped-out levels. Understanding the points where trades make sense is key to growing as a trader, so let’s watch the market evolve together.
By the way, the rays and levels in this strategy are drawn automatically using my custom indicator—it’s available privately. If you’re interested in using it, feel free to message me directly for details. I also offer analysis on any asset you’d like, whether it’s a free post here or a personal, private breakdown for your unique ideas.
The beauty of this strategy is its versatility—it works across all assets, and price always respects these dynamic rays. If you have a specific asset you’d like analyzed, hit Boost, leave a comment, and I’ll do my best to prioritize it.
Make sure to follow me here on TradingView to stay updated with my latest ideas and strategies. This is where I post regularly, so don’t miss out on the tools and insights that can give your trading the edge it deserves. Let’s grow and trade together! 🚀

Btc/usdt analysis chartwe haven't seen a #BTC daily candle close above $106.5k despite multiple attempts.
A daily candle closing above $107k (approx) would be bullish; otherwise,be prepared for another pullback.

Apple: As Expected…Apple has made progress as part of our primary scenario, gradually edging lower toward our magenta Target Zone between $209.57 and $196.05. In this price range, we anticipate the low of the magenta wave (2) and, subsequently, a reversal to the upside. On the other hand, we consider it 37% (previously 40%) likely that AAPL will stage an immediate breakout above the resistance at $260.10 without first reaching our Target Zone.

Decentraland: WeakSince the low of the blue wave (ii), Decentraland’s MANA has been dragging itself through a sideways consolidation just above the support at $0.41. Soon, however, new buying pressure should arise and push the price well above the resistance at $0.85 during the current impulsive wave (iii) in blue. If MANA instead drops below the support at $0.41, the magenta correction wave alt. will reach a new low, and the blue upward five-wave movement will only start thereafter (35% likely).

Necklace Pattern- DCMShriramIs this getting ready for some move?
DCM Shriram
Can this rally, take it up?
DCM Shriram is all set, isnt it?

Technical Analysis: SOL/USDT (1D Chart)
Technical Analysis: SOL/USDT (1D Chart)
Analysis Overview:
The chart depicts a potential bullish scenario for SOL/USDT, highlighting key entry zones and price action structure. Here's the breakdown:
Entry Zones:
Entry 1 (Immediate Support Zone):
Zone: Around the $210-$220 range.
This area marks the first potential buying opportunity, where price has shown prior support and could bounce if retested.
Ideal for aggressive buyers seeking to capitalize on the current bullish momentum.
Entry 2 (Deeper Retracement Zone):
Zone: Around the $180-$190 range.
This zone represents a stronger support level, aligning with historical price action. It's suitable for conservative buyers awaiting deeper corrections.
Price Action and Path Projection:
A bullish continuation is expected if the price holds above the support zones.
Scenario 1: Price could bounce from Entry 1, consolidate slightly, and break higher, targeting levels beyond $280.
Scenario 2: If Entry 1 fails, the price might retest Entry 2 before forming a double-bottom pattern and resuming its upward trend.
Key Technical Indicators:
Moving Average (MA): The price is trading above a key moving average, reinforcing the bullish bias.
Buy and Sell Signals: Recent buy signals indicate renewed bullish pressure.
Volume: (Add volume analysis if relevant, e.g., increasing volume during breakouts.)
Targets:
Target 1: $300 – Based on the previous high.
Target 2: $350 – Major resistance from historical levels.
Risk Management:
Place stop-losses just below the support zones:
Entry 1: Stop-loss at $200.
Entry 2: Stop-loss at $170.
Use position sizing appropriate to your risk tolerance.

$CRM $340 lagger in AIHello, I like this name for a pickup speed off the new presidency, CEO love and support for Trump and I personally like the technical setup here. $340c short term, 1/31 or out further.
In $2.07.
WALL ST. LOSER

Nvidia: FluctuationOver the past two weeks, NVDA has exhibited increased fluctuation within the boundaries of the current key levels: the resistance at $152.89 and the support at $126.34. Initially, the price seemed to favor our alternative scenario, but it managed to reverse just in time. Following a dip to $129, the stock rebounded swiftly. Our primary assumption remains that the beige wave III should eventually break above the $152.89 resistance. However, there is still a 33% chance that the expected rises will be delayed by a new low of the blue wave alt.(IV). This alternative scenario will prevail if the stock falls below the $126.34 support level.

Example of explanation of chart analysis and trading strategy
Hello, traders.
If you "Follow", you can always get new information quickly.
Please click "Boost" as well.
Have a nice day today.
-------------------------------------
There was an inquiry asking for detailed information on how to analyze charts and create trading strategies accordingly, so I will take the time to explain it.
Before reading this article, you need a basic understanding of charts.
That is, you need to understand candles and price moving averages.
If you study this first and then read this content, I think you will have some understanding of trading.
---------------------------------------
Whether you are trading spot or futures, marking support and resistance points according to the arrangement of candles on the 1M, 1W, and 1D charts is the first task you need to do before trading.
To do this, you need to understand the arrangement of candles.
Therefore, before using my indicator, it is better to study candles first and understand the arrangement of candles.
When studying candles, it is better not to try to memorize the names or shapes of various patterns.
This is because the overall understanding of candles is important, not the various patterns of candles.
If you study with a book or video, you will be able to understand candles after reading or watching them at least 3 times.
We study charts to trade, not to analyze charts and teach them to others, so we need to study efficiently and save time.
-
If you study candles, you will naturally understand the price moving average.
The indicator corresponding to the price moving average is the MS-Signal indicator.
This MS-Signal indicator consists of the M-Signal indicator and the S-Signal indicator, and the main indicator is the M-Signal indicator.
Therefore, we added the M-Signal indicator of the 1W chart and the M-Signal indicator of the 1M chart to the 1D chart so that we can see the overall trend.
-
You can see the arrangement of the MS-Signal (M-Signal of 1M, 1W, 1D charts) indicators in the example chart.
Currently, since the M-Signal of the 1M chart > the M-Signal of the 1W chart, we can see that it is a reverse array.
If you understand the price moving average, you will understand that we should not trade when it is a reverse array, but when it is a regular array.
Therefore, since the current state of the example chart is a reverse array, it is not suitable for trading.
However, the reason we brought this chart in this state is because the M-Signal indicators of the 1M and 1W charts are converging.
As convergence progresses, it will eventually diverge.
Therefore, since the possibility of price volatility increases, the possibility of capturing the timing for trading increases depending on whether there is support at the support and resistance points.
-
The indicators included in the example chart are drawn as horizontal lines to indicate support and resistance points.
This work performs the same role as the support and resistance points drawn on the 1M, 1W, and 1D charts according to the arrangement of the candles mentioned above.
Therefore, on the 1M, 1W, and 1D charts, horizontal lines are drawn on the indicators to indicate support and resistance points.
You can draw horizontal lines on indicators that are horizontal for at least 3 candles, and if possible, 5 candles.
-
Among the HA-MS indicators, the important indicators are the HA-Low and HA-High indicators.
The HA-Low and HA-High indicators are indicators created for trading on the Heikin-Ashi chart.
Therefore, it is the next most important indicator after the MS-Signal (M-Signal on 1M, 1W, 1D charts) indicator that can tell the trend.
You can create a trading strategy depending on whether there is support near the HA-Low, HA-High indicators.
-
The next most important indicator is the BW(0), BW(100) indicator.
When this indicator is created or touched, it is time to respond in detail.
That is, when you are trading with a trading strategy created from the HA-Low, HA-High indicators, when the BW(0), BW(100) indicators are created or touched, you can choose whether to proceed with a split transaction.
In addition, you can understand the OBV, +100, -100 indicators as response points for split transactions.
Therefore, you do not need to indicate support and resistance points for the OBV, +100, -100 indicators.
However, it is recommended to mark support and resistance points for the HA-Low, HA-High, BW(0), BW(100) indicators.
-
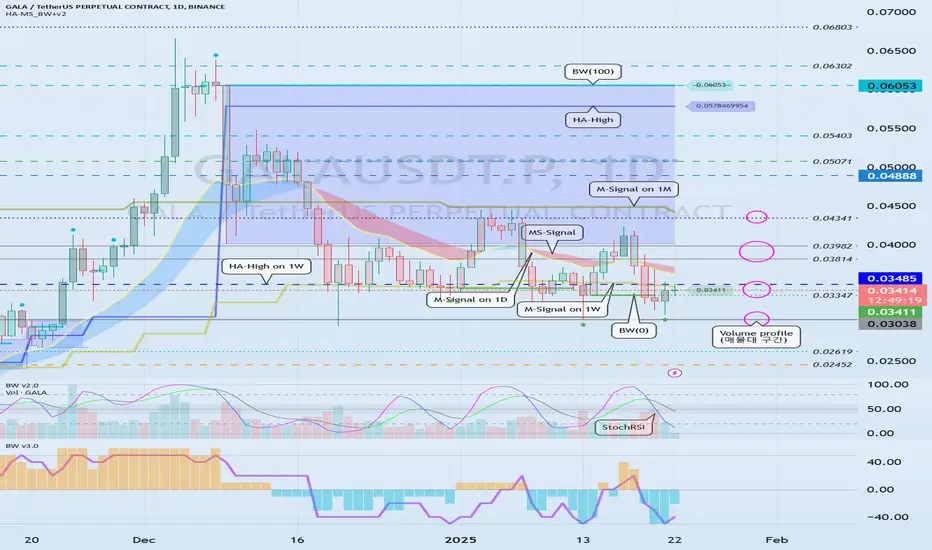
If you look at the price position in the example chart, you can see that it is located in the 0.03347-0.03485 range.
And, the M-Signal indicator of the 1W chart is passing through this range, and the HA-High indicator of the 1W chart is acting as support and resistance.
Therefore, whether there is support near 0.03485 is an important key point.
If support is confirmed near 0.03485, it is a time to buy.
However, since the MS-Signal (M-Signal on the 1D chart) indicator is passing between 0.03485-0.03814, the point to watch is whether the MS-Signal (M-Signal on the 1D chart) indicator can break through upward.
As I mentioned earlier, if the MS-Signal indicator passes, a trend change will occur, so it is significant.
Therefore, in order to turn into a short-term uptrend, it is likely to be supported around 0.03814-0.03982.
Therefore, the first split selling section will be around 0.03814-0.03982.
At this time, whether to sell or hold depends on your investment style and investment period.
-
Since the M-Signal indicator on the 1M chart is passing around 0.04341, it is likely to start when the price is maintained above the M-Signal indicator on the 1M chart in order to turn into a long-term uptrend.
Therefore, the second split selling period will be around the M-Signal indicator on the 1M chart.
This is also something you can choose.
-
An important volume profile section is formed around 0.03038.
Therefore, the 0.03038 point corresponds to a strong support section.
-
(30m chart)
When the time frame chart you are trading is below the 1D chart, it is recommended to activate the 5EMA indicator on the 1D chart.
(I just used the 30m chart as an example. The same principle applies to any time frame chart you usually use.)
This is because there is a high possibility of volatility when the 5EMA of the 1D chart and the M-Signal indicator of the 1M, 1W, and 1D charts are touched.
In other words, you can understand that it plays a certain role of support and resistance.
If it touches the HA-High, BW(100) indicator and falls and falls below the MS-Signal indicator, it will basically touch the HA-Low or BW(0) indicator.
On the other hand, if it touches the HA-Low, BW(0) indicator and rises and rises above the MS-Signal indicator, it will basically touch the HA-High or BW(100) indicator.
However, since it may not do so and may rise or fall in the middle, it is necessary for the support and resistance points drawn on the 1M, 1W, and 1D charts as mentioned earlier.
The support and resistance points drawn on the 1D chart are currently indicated at the 0.03347 point.
Therefore, even if it falls below the MS-Signal indicator, you can understand that there is a possibility of rising again around 0.03347.
Since the 5EMA of the 1D chart and the M-Signal indicator of the 1W chart are passing around 0.03485, we can see that the area around 0.03485 is an important support and resistance zone.
-
Since the StochRSI indicator is currently above 50, we should focus on finding a time to sell.
Since it has fallen below the BW(100) and HA-High indicators, it has fallen too much to start trading with a sell (SHORT) position.
However, if you can respond quickly, you can enter a sell (SHORT) position when it falls from the 0.03411 point where the MS-Signal indicator is passing.
When the StochRSI indicator falls below 50, we should focus on finding a time to buy.
At this time, you can trade based on whether there is support or resistance at the support and resistance points drawn on the 1M, 1W, and 1D charts or around the MS-Signal (M-Signal on the 1M, 1W, and 1D charts), 5EMA, HA-Low, HA-High, BW(0), and BW(100) indicators on the 1D chart.
As mentioned earlier, you should not forget that trading strategies can be created based on whether there is support at the HA-Low and HA-High indicators.
Therefore, if possible, it is recommended to trade based on whether there is support near the HA-High indicator point of 0.03443.
-
Thank you for reading to the end.
I hope you have a successful trade.
--------------------------------------------------
3 Must-Know Chart Patterns to Spot Winning Trades!Morning Trading Family
Understanding chart patterns is super important for trading success! In this video, I’ll walk you through the top 3 patterns every trader should know: Head and Shoulders, Double Top/Bottom, and Bullish/Bearish Flags. I’ll show you how to spot them, when to jump into a trade, and how to manage your risk. Whether you’re trading stocks, forex, or crypto, these patterns can make a big difference. We’ll even look at live charts together to keep it simple. Let me know in the comments which pattern is your favorite!
Kris/Mindbloome Exchange
Trade What You See

Take-Two: Target Zone in Focus!Although a slight downward tendency has been observed in TTWO’s sideways phase, the stock has recently shown new motivation on the upside. While short-term pullbacks cannot be ruled out, we still expect the beige b-wave to extend into our beige Target Zone (coordinates: $241.59 – $257.87), where we anticipate a significant trend reversal. This outlook remains intact as long as the support at $135.62 holds fast. An early sell-off below this level would trigger our alternative scenario of a premature correction low within our blue Target Zone between $107.47 and $46 (33% probability).

Electronic Arts: Heading DownwardWe assume that EA’s recent high at $169.82 marked the completion of a prominent wave in green. This top stands out because it represents a typical corrective pattern where a seemingly new uptrend is simulated. Unlike a standard B wave, an overshooting B wave can significantly exceed the prior peak – in EA’s case, the last major high of July 2018. We primarily locate the stock in an extended correction, whereby a magenta downward impulse should push the price below the support at $108.62. However, if EA breaks decisively above the $169.82 resistance in the near term, we will switch to our 33% likely alternative scenario and reckon with further rises.

ETH/USDT Analysis - Bullish Breakout PotentialThe chart demonstrates a clear descending channel pattern that has been forming over the past few weeks. Ethereum has respected the boundaries of this channel, bouncing between support and resistance levels.
Current Observation:
Pattern:
A descending channel often indicates consolidation after a strong trend. It can act as a continuation pattern when the price breaks out in the direction of the prior trend.
Ethereum is currently trading near the middle range of the channel.
Key Levels to Watch:
Resistance: The upper boundary of the channel around $3,600-$3,800 is the critical resistance. A breakout above this level can lead to a strong bullish momentum.
Support: The lower boundary near $3,000-$3,100 is acting as strong support, holding the price from further decline.
Volume and Momentum:
A breakout above the resistance line with increased volume would confirm a bullish continuation.
Projection:
If Ethereum breaks out of the descending channel on the upside:
The next target could be around $4,200-$4,300, aligning with previous high levels.
Key Considerations:
A failed breakout could push the price back into the channel, retesting lower levels of support.
Always manage risk with stop-loss orders placed below the channel support.

$BTC BIG PUMPING & PROFIT TARGET 4 DONE BINANCE:BTCUSDT BIG PUMPING & PROFIT TARGET 4 DONE
Chart Analysis ( CRYPTOCAP:BTC )
💫NEW ATH : $108,306.16
🎆ENTRY POINT : $94428.96
🎇STOPLOSS ZONE : $90,444.77
1ST TARGET $99,762.63 🔥
2ND TARGET $102,315.06 🔥
3RD TARGET $105,501.97🔥
4TH TARGET $108,306.16🔥
Disclaimer: This article is for informational purposes only and does not constitute financial advice. Always conduct your own research before making any investment decisions. Digital asset prices are subject to high market risk and price volatility. The value of your investment may go down or up, and you may not get back the amount invested. You are solely responsible for your investment decisions and Binance is not available for any losses you may incur. Past performance is not a reliable predictor of future performance. You should only invest in products you are familiar with and where you understand the risks. You should carefully consider your investment experience, financial situation, investment objectives and risk tolerance and consult an independent financial adviser prior to making any investment.

BTC Dominance AnalysisWe are currently observing a key resistance zone (labeled as "A") between 59% and 60% dominance. The price action shows a potential rejection from this area, suggesting that BTC dominance might struggle to break above this level in the short term.
If the rejection occurs as expected, we could see a downward move towards the highlighted support zone (labeled as "B") around 54.5% - 55%. This zone represents a significant area of buyer interest and could lead to a reversal or stabilization.
Key Levels:
Resistance (Zone A): 59% - 60%
Support (Zone B): 54.5% - 55%
Projection:
If rejection from Zone A occurs, a bearish movement towards Zone B is likely.
A potential bounce from Zone B could lead to a recovery in BTC dominance.

CRUDEOIL READY FOR ALL TIME HIGH...MCX:CRUDEOIL1! trade at 6770 level. Crude oil trade in a triangle range since last 3 years. This week gives a strong breakout above 6400 level. Now you can watch for all time High level.

ALUMINIUM Ready for ALL Time High...MCX:ALUMINIUM1! ALUMINIUM1! trade at 256. Last week gives a strong breakout above 250 level. Now you can watch for 300+ level.

Solana (SOL/USDT) Weekly AnalysisSolana has demonstrated a strong bullish recovery, bouncing off the $220-$230 support zone, indicating significant buying interest in this region. Currently, SOL is trading around $270, and we are observing price consolidation with the potential for a breakout.
Key Levels to Watch:
Support Zone: $220 - $230
This area has acted as a strong demand zone, where buyers stepped in to defend the price.
Resistance Zone: $290 - $300
A breakout above this resistance zone will signal a continuation of the bullish trend.
Bullish Scenario:
If Solana successfully breaks and holds above the $300 resistance level, we could see a rally toward $350 and potentially higher levels. The bullish structure on the weekly timeframe suggests that buyers are regaining control.
Bearish Scenario:
Failure to break the $290 - $300 zone may lead to a pullback, with the $230 support zone acting as a critical level for buyers to step in again. A breakdown below $230 would invalidate the bullish outlook.
Technical Indicators:
Trend: Bullish on the weekly chart, with higher highs and higher lows.
Potential Targets: $300 (immediate resistance), $350 (next major target after breakout).
Stop Loss: If you're entering a trade, consider placing a stop loss below $230 to manage risk.
Conclusion:
Solana is at a decisive point, and traders should closely monitor the $290-$300 resistance zone for signs of a breakout. A bullish breakout could lead to significant upward momentum, while rejection might cause a short-term retracement.

$SOLANA PRICE PREDICTION 2025 | HIT TARGET $330 see more chartBINANCE:SOLUSDT PRICE PREDICTION 2025 | HIT TARGET $330 see more chart
Solana Reclaims Monthly And Weekly Support Levels – Expert Sets $330 Target
• SOLUSDT
Solana (SOL) has made a remarkable recovery following Monday’s unexpected flash crash, surging by more than 28% in less than five days. This impressive rebound has sparked renewed optimism among investors, who are now eyeing the potential for a bullish continuation in the weeks ahead. The rapid price increase has positioned Solana as one of the top-performing assets in the crypto market, signaling a potential shift in momentum.
Renowned analyst Jelle recently shared a detailed technical analysis, highlighting that Solana has broken out of its prolonged downtrend. According to Jelle, SOL has successfully reclaimed crucial monthly and weekly support levels, indicating a significant move could be on the horizon. These levels, often considered key benchmarks for long-term stability, suggest that Solana’s recent gains may be more than just a temporary bounce.
If Solana can sustain this momentum, it may not only recover from recent losses but also pave the way for further gains, potentially outperforming other major altcoins. As technical indicators align with market enthusiasm, Solana could be gearing up for a breakout rally that captures the spotlight.
Solana Set To Enter Price Discovery Phase
Solana (SOL) emerged as one of the top market performers in 2024, posting an impressive surge of over 170%. This stellar performance cemented its position as a market leader and highlighted its resilience and growth potential within the crypto space. As 2025 unfolds, optimism surrounding Solana remains high, with many investors anticipating significant gains in the coming months.
The momentum appears to be building already, as Solana begins the year with a potential breakout. Renowned analyst Jelle recently shared insights on X, pointing out that SOL has successfully broken out of the downtrend that had restrained it since late November.
Solana breaking out of a downtrend | Source: Jelle on X
Moreover, Solana has reclaimed both monthly and weekly support levels—crucial milestones indicating that the asset has regained its bullish footing. According to Jelle, the price action for Solana is “super clean,” suggesting that the cryptocurrency is well-positioned for higher valuations.
Jelle’s initial target for SOL is set at $330, a level that would not only mark a significant recovery but could also push Solana into a price discovery phase. This phase typically sees heightened market interest and volatility as traders and investors recalibrate expectations for the asset’s long-term value. With technical indicators and market sentiment aligning, Solana appears poised to capitalize on its upward trajectory.
If Solana sustains this bullish momentum, it could continue to dominate headlines as a top-performing asset in 2025. As anticipation builds for further upside, traders and investors are closely monitoring key levels, knowing that the cryptocurrency’s next big move could redefine its role in the broader crypto ecosystem.
SOL Testing Crucial Supply Around $220
Solana (SOL) is currently trading at $218, approaching a critical level that could determine its next major move. The price is on the verge of setting a new local high above $222, a significant resistance point. Breaking through this level would signal a strong bullish continuation, setting the stage for massive price appreciation and the potential to reclaim its all-time high (ATH).
• SOL testing crucial supply
Analysts believe that if SOL clears the $222 mark and maintains its momentum, the next key level to watch is $250. Reclaiming and holding $250 as support would pave the way for Solana to enter uncharted territory, pushing its price into a new all-time high and potentially beginning a price discovery phase. This development would further solidify Solana’s position as a market leader and attract increased investor attention.
However, failing to surpass the $222 resistance or reclaim the $250 level could lead to a consolidation phase. Such a pause in price action might delay Solana’s rally but could also provide a foundation for renewed momentum in the future. With market participants closely monitoring these levels, Solana’s price movements in the coming days will be pivotal in determining whether the cryptocurrency embarks on its next major leg up or enters a temporary holding pattern
Disclaimer: This article is for informational purposes only and does not constitute financial advice. Always conduct your own research before making any investment decisions.

Solana (SOL/USDT) AnalysisSolana has shown a strong recovery from the support zone around $170, confirming buyers' interest in this region. The price is currently trading around $237, breaking above a key resistance area.
Key Levels:
Support Zone: $170 - $180
This area acted as a strong demand zone where buyers entered aggressively.
Resistance Zone: $250 - $260
The price is currently approaching this resistance. A successful breakout will confirm bullish continuation.
Bullish Scenario:
If the price breaks and closes above the $250 - $260 resistance zone, we could see Solana targeting higher levels, with the next major target around $300. The overall market structure remains bullish as long as the support at $170 holds.
Bearish Scenario:
Failure to break the $250 - $260 zone could lead to a pullback toward the $200 level or even the $170 support zone. Traders should watch for signs of rejection near resistance.
Conclusion:
Solana has a bullish outlook, with the potential for further upward movement if it clears the resistance. Keep an eye on volume and momentum indicators for confirmation. A breakout above $260 would likely attract more buyers.
