BTC/USD Fake out before Pump | Bullish Flag formationBTC/USDT (1D) Market Outlook – July 1, 2025
Introduction
BTC is currently consolidating within a bullish flag pattern after printing a swing high at 108.9K and a recent swing low at 98K. The price sits just below a major supply zone.
Context 1: Key Zones
Supply: 104.6K – 112.1K
Demand: 74.4K – 82.5K
Fair Value Gaps (FVG): 3 zones below price, with one near 88–90K
Context 2: Technical Confluence
Liquidation Zone: 106.2K
Golden Pocket (Fib 0.618): 102.1K
Psychological Levels: 105K and 110K
Context 3: Market Structure
Pattern: Bullish flag
Trend (LTF): Sideways/consolidation
Volume Profile: Heavy activity near 105K–110K
Bullish Scenario
Breaks above 106.2K (liq zone)
Pulls back to 102.1K (golden pocket), forms higher low
Retests resistance for continuation
Alt scenario: clean breakout above resistance → ATH retest
Bearish Scenario
Breaks below 106.2K and flag support
Fills FVG, breaks prior low at 98K
Triggers macro downtrend toward 88–90K zone
Summary
BTC is at a decision point inside a bullish flag, facing supply. A break above 106.2K favors upside continuation, while rejection and a lower low could trigger a deeper retracement. Watch key levels closely.
Chartanalysis

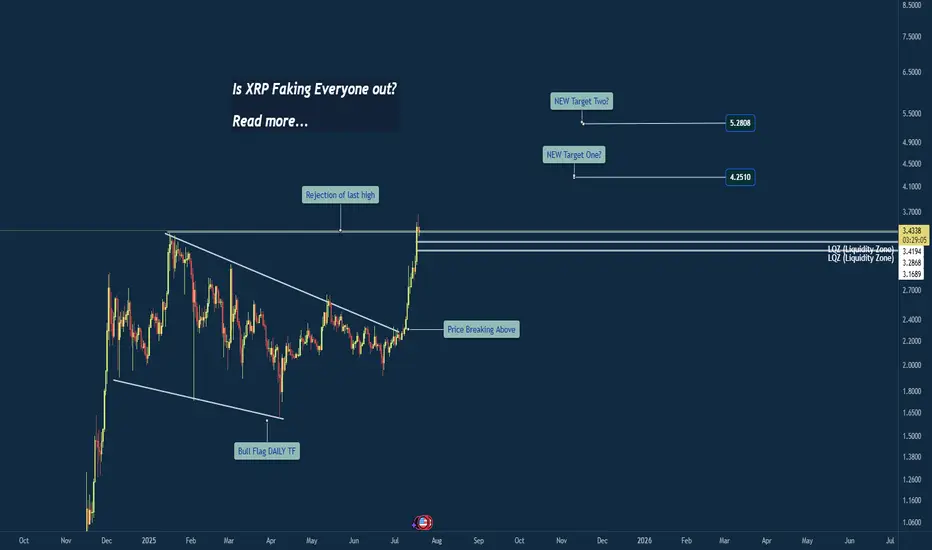
Breakout or Bull Trap? XRP at Critical Weekly LevelWeekly Chart Insight: XRP Closing Above Previous High
XRP has just closed above its previous weekly high—a significant development that could signal a shift in market sentiment. Historically, when price closes above such a critical level on the weekly timeframe, it often leads to continuation, unless a sharp rejection quickly follows.
At this stage, the focus shifts to the 4-hour timeframe for confirmation. An impulsive move above the current consolidation zone could indicate that this breakout is legitimate, potentially leading to another bullish weekly candle.
However, caution is warranted. If the next two daily candles close weakly or fail to maintain structure above the breakout level, it could hint at a fakeout or liquidity grab before a deeper correction.
My Current Bias:
I remain neutral-to-bullish, contingent on:
An impulsive continuation on the 4HR
Strong daily closes above the key range
Price not falling back and closing below the weekly breakout level
If price begins to consolidate and hold this level, that would reinforce the bullish case. But if we see immediate selling pressure and a re-entrance below the breakout, I’ll reconsider the bias based on developing structure.
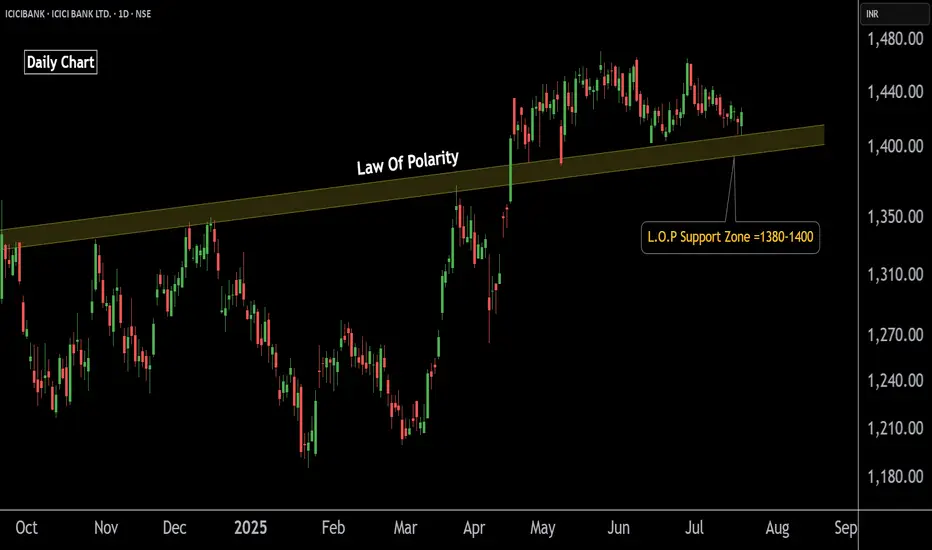
ICICI Bank Poised for Upside – Buy OpportunityThis is the daily chart of ICICIBANK.
ICICIBANK having a good law of polarity at 1380-1400 level .
If this level is sustain then we may see higher prices in ICICIBANK.
Thank You !!
Starbucks: Sideways Trend Continues Starbucks shares have remained in a sideways range over the past two weeks. This does not alter our primary outlook: We continue to see the stock in the dark green wave , which is expected to peak near the resistance level at $117.46. After reaching this high, we anticipate a move lower, with the stock dropping below the support at $71.53. However, since the intermediate high has not yet been established, an alternative scenario remains on the table: With a 31% probability, the dark green wave alt. could take hold first, driving the price below the $71.53 mark ahead of schedule.
📈 Over 190 precise analyses, clear entry points, and defined Target Zones - that's what we do (for more: look to the right).

Apple: Consolidation Before Potential Breakout Toward $260Apple shares have recently pulled back into a consolidation phase. We see further upside potential in magenta wave (B) before a pullback occurs as part of the same-colored wave (C), which is expected to target the low of green wave . After that, we anticipate a new upward move: Green wave should take over—remaining above support at $168—and drive the stock toward the next major resistance at $260.10. However, if the price drops back below the $168 support level, our alternative scenario comes into play: in that case, we would expect a lower low for blue wave alt.(IV), with a probability of 32%.
📈 Over 190 precise analyses, clear entry points, and defined Target Zones - that's what we do (for more: look to the right).

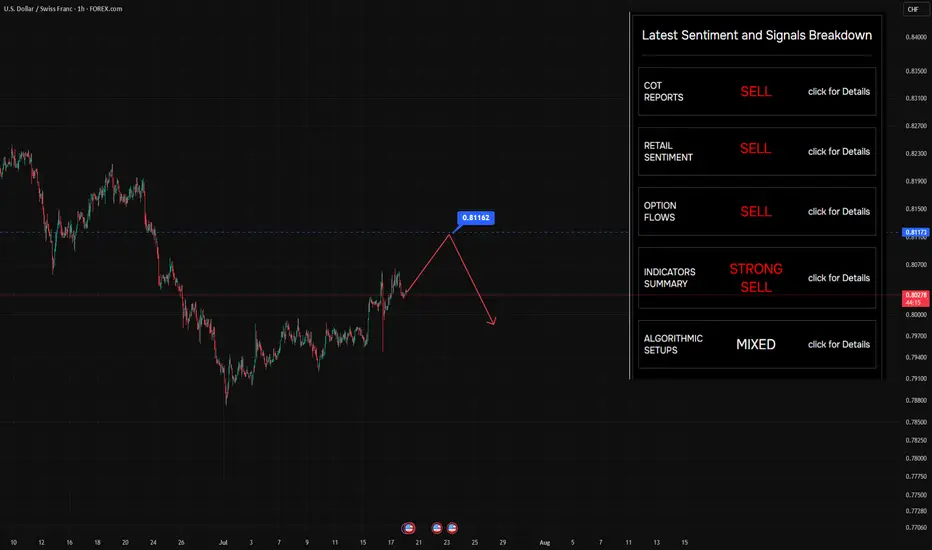
Still looking to sell on rallies — nothing’s changedStill looking to sell on rallies — nothing’s changed. The level on the chart? That’s where buyers jumped in before. Makes sense to target it again.
So… why do we say there are "suffering buyers" at this level?
Let’s rewind a bit (see Chart #2) and imagine price at the point marked on the chart.
At that moment, price had clearly returned to a visible local level — 0.8123 — a zone that naturally attracted traders to jump in on the fly , or triggered limit orders .
But here’s what happened next:
Selling pressure overpowered buying interest — and price moved swiftly lower .
That’s when those buyers got caught.
That’s when the pain started.
🔍 What Makes This Level Special?
Broker data from open sources confirms that open positions are still sitting at this level — meaning a lot of traders are underwater, hoping for a recovery that may never come.
It’s not just technical structure.
It’s crowded sentiment , failed expectations , and trapped capital — all wrapped into one.
🧠 This is what we call a "suffering trader" zone — and it often becomes a magnet for future selling .
📌 Follow along for more breakdowns on flow, positioning, and market sentiment .
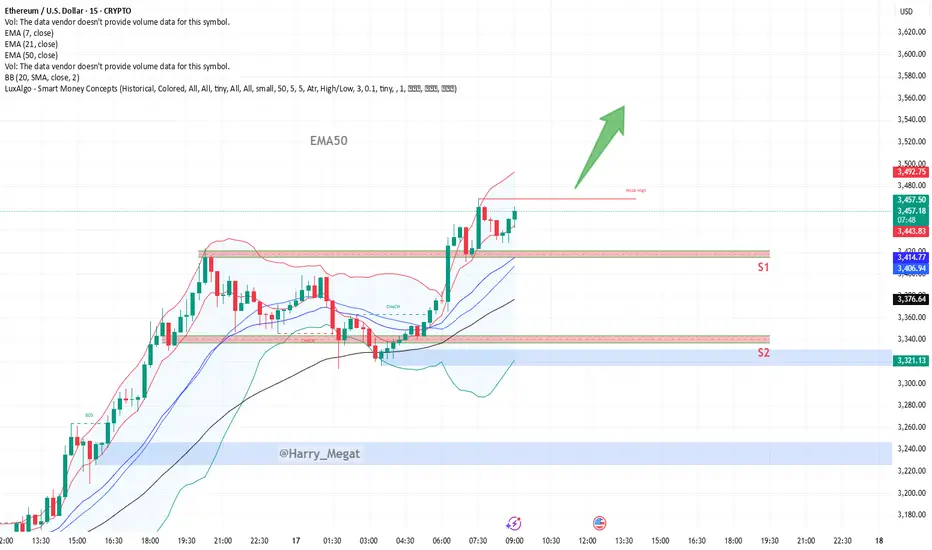
Technical **chart analysis** for ETH/USDTechnical **chart analysis** for **ETH/USD** based on (15-min timeframe) :
Bullish Outlook**
* **Price Action**: Ethereum is consolidating just above previous resistance (\~\$3,440) after a breakout from the range.
* **Current Price**: \~\$3,446
* **EMA Support**:
* EMA 7: \$3,441 (price holding above)
* EMA 21: \$3,413
* EMA 50: \$3,376 (strong dynamic support)
Key Levels**
* **Resistance Broken**: Former resistance zone (\~\$3,415–\$3,440) now acting as support.
* **S1 Support Zone**: \$3,415–\$3,440 (ideal retest zone for long entries)
* **S2 Support Zone**: \$3,335–\$3,350 (next demand zone if S1 fails)
Analysis Summary**
* **Trend**: Bullish momentum is intact above EMA cluster.
* **Setup**: Retest of breakout zone successful → price stabilizing above EMA7.
* **Target Area**: If momentum continues, next target zone could be \$3,500–\$3,560 (as shown by green arrow).
* **Invalidation**: Drop below \$3,413 (EMA21) and especially \$3,376 (EMA50) would weaken the bullish structure.
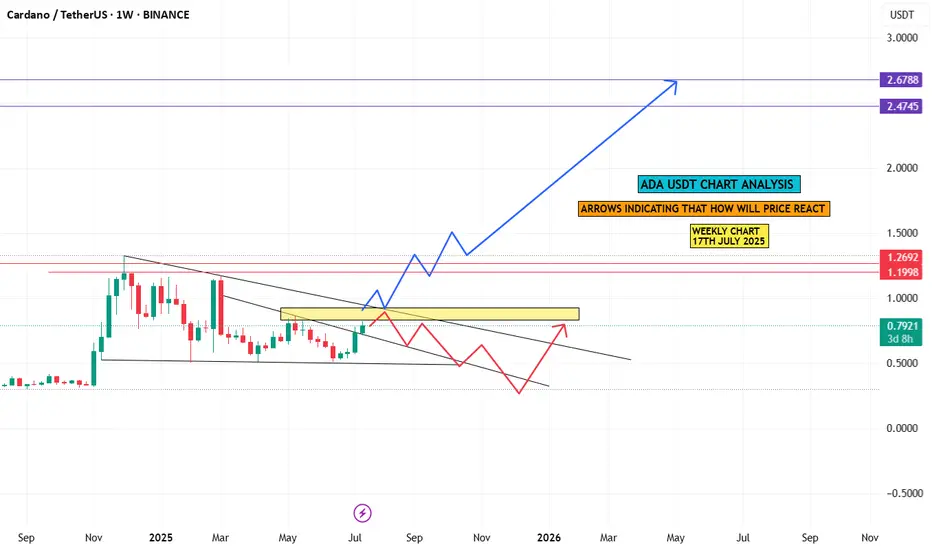
ada chart analysiscardano weekly chart analysis n arrows indicating that how will price react in upcoming
days or months,
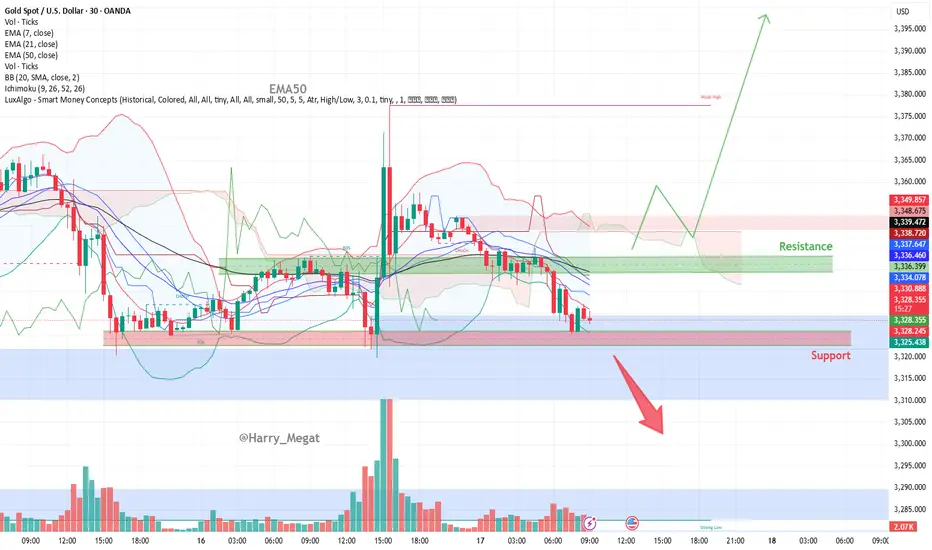
Gold (XAU/USD) Setup based on 30-minute chartGold (XAU/USD) Setup based on 30-minute chart
**Bullish Scenario**
* **Support Held**: Price is currently testing a key horizontal support zone (\~\$3,320–\$3,327), which has held multiple times in the past.
* **Potential Reversal**: If price forms a bullish candlestick pattern here (e.g., bullish engulfing, hammer), we may see a rebound.
* **Upside Target**:
* **First Resistance**: \$3,345–\$3,350 (green zone)
* **Further Target**: \$3,380–\$3,400 if momentum continues
**Confirmation Triggers**:
* Bullish price action from support zone
* Break above EMA 7 / EMA 21 (\~\$3,330–\$3,336)
* Increasing volume on green candles
**Bearish Scenario**
* **Breakdown Threat**: Price is hovering near support; if it breaks below \$3,320 with volume, downside pressure may intensify.
* **Next Support Levels**:
* \$3,310 (minor)
* \$3,285–\$3,275 (major support)
**Bearish Triggers**:
* Clear break and close below \$3,320
* EMA crossover (short-term below long-term)
* Rising red volume bars
Summary
| Direction | Conditions | Targets |
| ---------- | --------------------------------------------------- | ------------------------- |
| Bullish | Hold above \$3,320 + breakout above \$3,336 (EMA50) | \$3,350 → \$3,380–\$3,400 |
| Bearish | Break below \$3,320 support | \$3,310 → \$3,285 |
Netflix: Hovering Just Below Key Target ZoneNetflix has rebounded over the past two sessions after falling below the beige Short Target Zone ($1,270–$1,432) and is now trading just beneath it. A renewed push into this range could complete turquoise wave 3, followed by a corrective wave 4 likely dipping below $1,180. Alternatively, with a 33% probability, turquoise wave alt.3 may already have peaked, opening the door for an immediate drop through $1,180. A broader correction in beige wave IV is expected once wave III concludes, before upside resumes in wave V.
📈 Over 190 precise analyses, clear entry points, and defined Target Zones - that's what we do (for more: look to the right).

EUR/USD Technical Outlook Daily chart frame**EUR/USD has bounced from the S1 zone (\~1.1595–1.1575)**, chart analysis
**EUR/USD Technical Outlook**
**Current Price:** \~1.1618
**Recent Action:** Rejection from S1 zone, forming a potential base.
**Bullish Scenario (Active)**
The pair has bounced from key **S1 support** (1.1595 area), suggesting demand is present.
**If momentum holds:**
* **Immediate Target 1:** 1.1645 (Fibonacci + 21 EMA)
* **Target 2:** 1.1665–1.1685 zone (7 EMA + minor resistance)
* **Target 3:** 1.1725 (R1 zone and mid-July resistance)
* Breakout above R1 would shift momentum firmly bullish.
*Watch for bullish continuation candles and rising volume.*
**Bearish Risk (Still Possible)**
* If the bounce stalls near **1.1645–1.1665**, and the pair reverses:
* A drop back toward **1.1595–1.1575** support could occur again.
* Break below that zone would expose:
* **S2 support at 1.1510**
* Possibly extend to **1.1475** in case of stronger USD demand
Summary:
* **Bounce from S1** shows initial bullish strength.
* **Key resistance to break:** 1.1645–1.1685 for bullish continuation.
* **Key support to hold:** 1.1595–1.1575 to avoid deeper correction.

DXY Bullish Pennant (awaiting breakout)**1-hour timeframe** of the **US Dollar Index (DXY)** with technical analysis applied. Here's the breakdown:
**Technical Analysis Summary:**
**Current Price:**
* Around **98.08**, trading just under the **7 EMA (98.09)**.
**Bullish Structure:**
* A strong **bullish impulse leg** is visible (sharp green candle rally).
* Followed by a **bullish flag/pennant** pattern (marked in red), which is typically a **continuation pattern** in an uptrend.
* The flag is forming after a steep upward move — suggesting **consolidation before potential breakout continuation**.
**EMA Trend Support:**
* **EMA 7, 21, and 50** are aligned bullishly:
* EMA 7 > EMA 21 > EMA 50
* This supports the **short-term uptrend** structure.
**Support Zones:**
* A strong **demand zone** is marked between **97.50–97.70** (highlighted in red), where price previously consolidated before the breakout.
* EMA 50 also sits around **97.72**, reinforcing this as a strong **pullback support level**.
**Possible Scenarios:**
1. **Bullish Continuation:**
* If the price breaks above the flag resistance, it may **rally towards 98.70 → 99.00 → 99.10**.
2. **Bullish Pullback:**
* If price dips to retest the support near **97.80–97.90** or EMA 21, and holds, it may bounce and continue upward.
**Conclusion:**
* **Trend:** Bullish
* **Pattern:** Bullish Pennant (awaiting breakout)
* **Support:** 97.72–97.90
* **Upside Targets:** 98.70 → 99.00+
* **Outlook:** Positive bias continues **as long as price holds above the support zone** and EMAs.

Exide Industries Ready for the Next Bull Run !! Powering Up !!there are two chart of Exide Industries.
In a first chart: EXIDEIND is moving in a well defined parallel channel and currently trading near at support 365-375 range
In the second chart,EXIDEIND is respecting support at both the monthly pivot and the supertrend indicator, with the support zone positioned between ₹365-₹370.
EXIDEIND is currently sustaining below both the monthly and weekly pivot levels at ₹290. As long as the stock does not break above this pivot zone, the momentum is expected to remain weak.
If this level is suatin then ,we may see higher prices in EXIDEIND.
Thank you !!

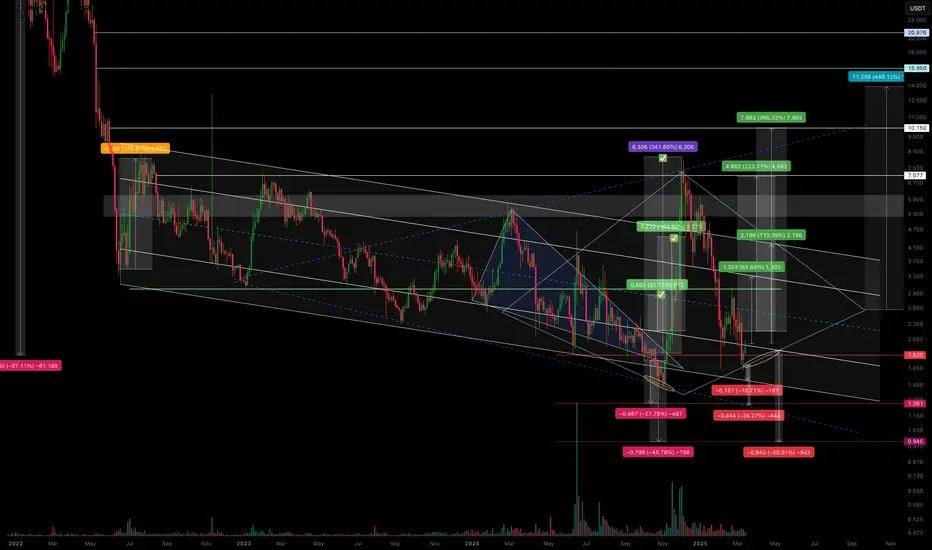
CVX/USDT – Is the scenario repeating? Continuing to work.The previous trading idea has played out with 3 out of 4 marked zones reached.
We saw a false breakout from the descending channel, followed by a pullback in line with the overall market—returning to the channel’s support zone.
I’ve noticed a potential formation of either a diamond pattern or an expanding triangle, but we’ll see how it plays out further.
Regarding declines and support zones:
-10.71% drop to the support of the descending channel.
-26.27% drop to the anticipated support of the expanding triangle.
-50% drop, likely as a squeeze under extremely negative news.
Regarding growth and resistance zones:
+65% rise to the resistance of the internal channel.
+110% rise to the resistance of the external channel (and if a diamond pattern forms, then its boundary).
+246% rise as a second attempt to break out of the descending channel.
+440% rise as a potential realization of diamond pattern pricing (if it forms).
All of this should be factored into your trading strategy, even the less likely scenarios.
I'll share the execution of the previous trading idea in my TG. I've also marked it on the chart.
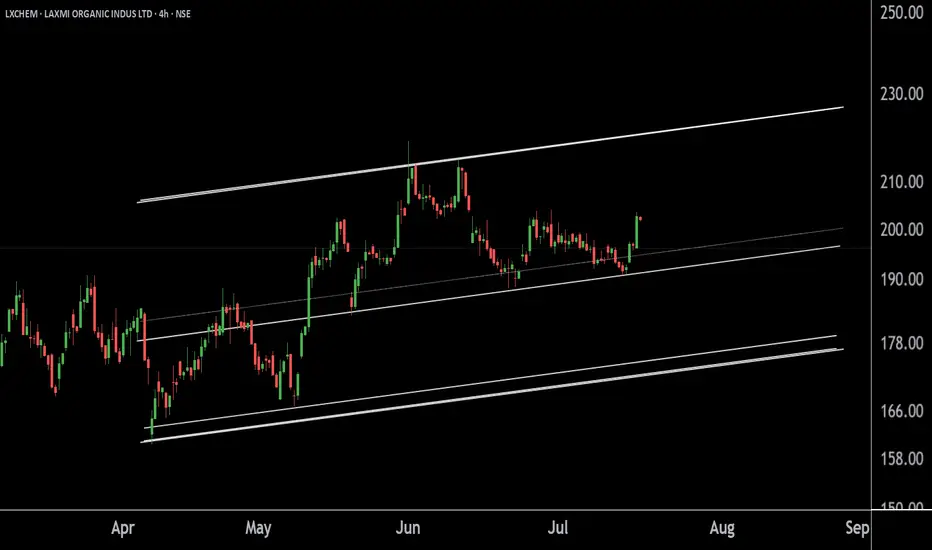
LAXMI ORGANIC INDUS LTD at Best Support !! LXCHEM 's Key level !This is the 4 hour chart of LXCHEM.
LXCHEM is moving in well defined parallel channel with support neat at 190-196 range.
If this level is sustain , then we may see higher prices in LXCHEM.
Thank You !!
Gold (XAU/USD) 4-hour chart4-hour chart of Gold (XAU/USD)** showing a key technical setup near the \$3,344 level. Price action is testing a significant **resistance zone** highlighted in grey, with two possible scenarios unfolding from this level.
**Chart Analysis Overview:**
* Gold has been in a **bullish short-term trend**, forming higher lows and pushing above the **EMA 7, 21, and 50**, all converging near the \$3,324–\$3,331 area (acting as dynamic support).
* Price is now approaching a **multi-tested resistance zone** near \$3,360–\$3,390, where it has previously faced selling pressure.
* Volume is rising, supporting the current bullish momentum.
**Scenario 1: Bullish Breakout (Green Path)**
**Conditions:**
* Price breaks and holds above the \$3,360–\$3,390 resistance zone.
* Continued bullish momentum supported by trade tensions, safe-haven demand, and Fed uncertainty.
**Target:**
* First target: \$3,400
* Extension: \$3,420–\$3,440 zone if momentum strengthens.
**Invalidation:**
* Failure to hold above \$3,360–\$3,390 range could limit upside potential.
**Scenario 2: Bearish Rejection (Red Path)**
**Conditions:**
* Price gets rejected from the resistance zone (\$3,360–\$3,390).
* Fails to establish support above the breakout level and drops back below \$3,330.
**Target:**
* Immediate support at \$3,310–\$3,290
* Deeper correction towards \$3,260–\$3,220 if bearish pressure increases.
**Confirmation:**
* Look for bearish candlestick patterns near resistance (e.g., shooting star, bearish engulfing).
* Drop below EMA cluster (\$3,324–\$3,331) to confirm weakness.
**Conclusion:**
Gold is at a decision point near major resistance. A breakout above \$3,390 could extend the bullish rally, while failure to break this level may invite sellers and trigger a correction. Watch price action around this resistance for confirmation of the next move.

Bullish Outlook for Ethereum (ETH/USD)The chart shows a **bullish outlook for Ethereum (ETH/USD)** on the 1-hour timeframe, suggesting a potential continuation of the uptrend after a recent breakout.
Chart Breakdown:
* **Current Price:** \~\$3,038
* **Key Levels:**
* **S1 (Support 1):** Around \$2,996 — a key breakout and retest level.
* **S2 (Support 2):** Around \$2,945 — secondary support and accumulation zone.
* **EMAs:**
* EMA 7: \$3,023
* EMA 21: \$2,996
* EMA 50: \$2,970
The price is currently above all three EMAs, signaling **short-term bullish momentum**.
Bullish Scenario:
* The price recently **broke out above a strong resistance zone (\~\$2,996)**.
* If ETH successfully **retests and holds S1 as support**, we could see a continuation move toward:
* **\$3,080 → \$3,120 → \$3,160** as short-term targets.
* The green path suggests a **healthy pullback and continuation pattern**, which aligns with bullish market structure.
Invalidation/Bearish Scenario:
* A **break below S1 (\$2,996)** may shift bias toward S2 (\~\$2,945).
* Loss of S2 support could open the door for deeper correction..”

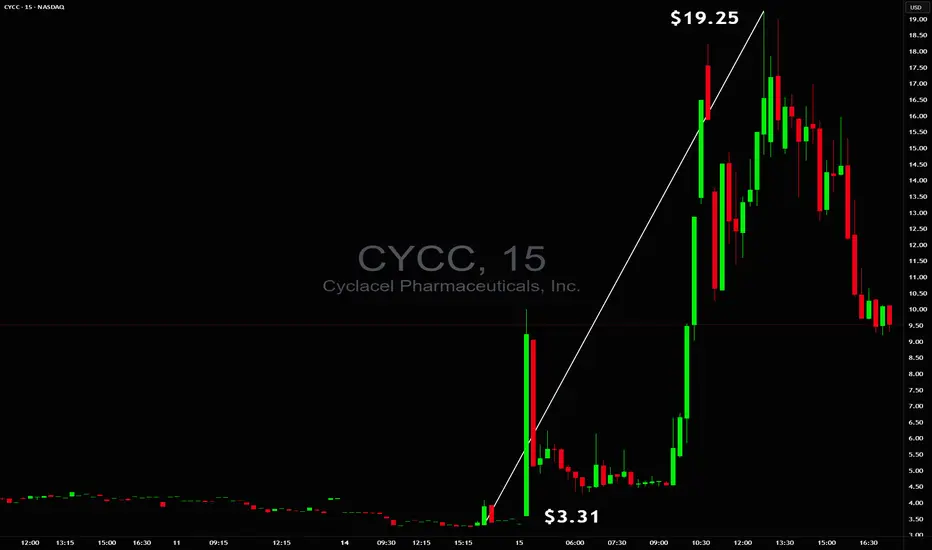
$3.31 to $19.25 in minutes$3.31 to $19.25 in minutes 🚀 but without a safe trade setup ❌ NASDAQ:CYCC
Too unstable to trade early while end of day there was a chance for power squeeze but even on 60M+ volume, tiny float and huge borrow fee they were able to reverse it so safe stop had to be respected ✔️
Tesla: Still Pointing LowerTesla shares have recently staged a notable rebound, gaining approximately 10%. However, under our primary scenario, the stock remains in a downward trend within the turquoise wave 5, which is expected to extend further below the support level at $215.01 to complete the magenta wave (3). This move is part of the broader beige wave c. However, if the stock continues to rally in the near term and breaks through resistance at $373.04 and $405.54, we would need to consider that wave alt.(II) in blue has already been completed (probability: 38%).
📈 Over 190 precise analyses, clear entry points, and defined Target Zones - that's what we do (for more: look to the right).

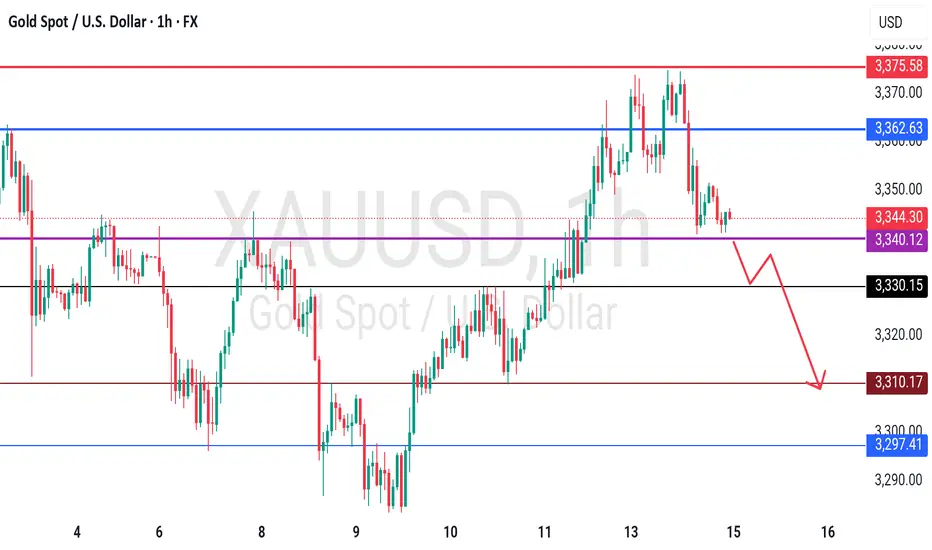
GOLD - CUT n REVERSE area, what's next??#GOLD ... perfect move as per our video analysis and now market just reached at his today most expensive area, that is 3340-41
Keep close that area and only holding of that area can lead us towards further bounce otherwise not.
So keep in mind we should didn't holda our longs below 3340-41
And obviously we will go for cut n reverse below 3340-41 in confirmation.
Good luck
Trade wisely
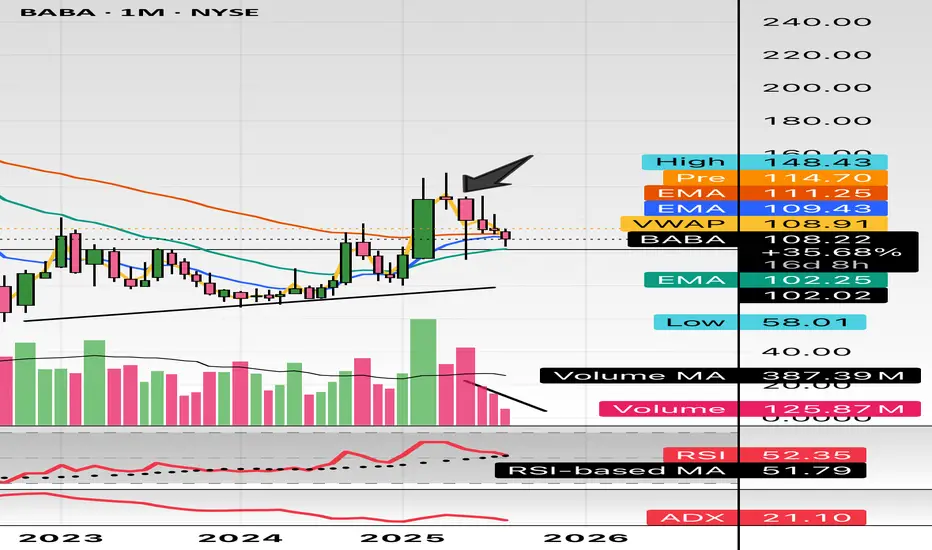
$BABA don’t miss this milky bottle. Called this out at $105 in minds. This Monthly declining volume, support at $100, and uptrend pattern. China will boom into the end of Q3 and early 2026. Target is $180 and $200.
WSL.
BTC/USD Technical Analysis — Educational BreakdownBTC/USD Technical Analysis — Educational Breakdown (July 13, 2025)
🔍 Market Context
Bitcoin (BTC/USD) is currently trading around $117,913, exhibiting a clear reaction from a well-defined resistance zone between $118,439 and $119,000. This resistance aligns with a previously unfilled 4H Bullish Fair Value Gap (FVG) — a price inefficiency left behind during a strong bullish move — which has now been filled, triggering a pause and reaction in bullish momentum.
🧠 Key Concepts Explained
📘 1. Fair Value Gap (FVG)
In Institutional Price Delivery models (often used in Smart Money Concepts), a Fair Value Gap represents an imbalance in price action — usually between the wicks of candles where price moved too quickly, leaving inefficient trading zones. Price often retraces to these areas before resuming its direction. Here, BTC has filled the 4H Bullish FVG, which acts as a magnet for price and a potential reversal point once filled.
📘 2. Liquidity Sweep
The chart highlights a Sell-Side Liquidity Sweep — this occurs when price dips below a key short-term low or consolidation range to trigger stop-losses and collect liquidity before making its next move. This move is typically engineered by larger market participants to capture orders before deciding on true directional intent.
📘 3. Resistance and Support
Resistance ($118,439 – $119,000): This area is acting as a supply zone where sellers are stepping in after price filled the FVG.
Support ($115,580): This level has previously provided demand and also holds liquidity (stop-losses from long positions), making it a probable target if bearish pressure follows through.
📈 Potential Trade Insight (Educational)
⚠️ This is not financial advice but an educational scenario based on the current technical setup.
Bearish Setup: If price rejects from resistance and forms a lower high, a short entry targeting the support zone at $115,580 could be considered, using a stop above $119,000.
Bullish Invalidator: A break and hold above $119,000 would suggest bullish continuation, potentially targeting higher time frame imbalances or resistance.
📚 Summary & Takeaway for Learners
This chart presents an excellent case study in understanding how institutional concepts like FVGs, liquidity sweeps, and key supply/demand zones interact in real price action. Traders can learn the following from this setup:
Price doesn’t move randomly — it often targets liquidity and imbalances.
Patience is key — waiting for confirmation at known reaction zones can improve trade accuracy.
Market context matters — a filled FVG at resistance combined with a liquidity sweep gives confluence to a bearish outlook.

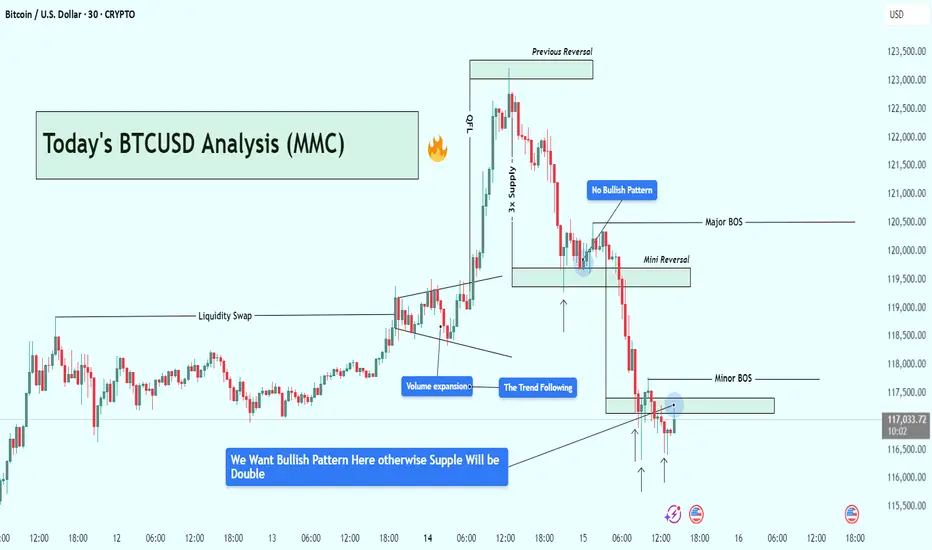
BTCUSD Analysis : Bitcoin Trend Shifted/Bullish Pattern + Target🧭 Overview:
Bitcoin’s recent price action has delivered a textbook sequence of institutional liquidity play, volume-driven breakout, and supply zone rejection. After rallying on increasing volume, BTC tapped into a significant 3x Supply Zone—which also served as a previous reversal point—and was swiftly rejected. The market is now trading around a key decision zone where traders must stay alert for a confirmed bullish reversal, or risk getting caught in further downside.
🔍 Step-by-Step Technical Breakdown:
🔸 Liquidity Grab + Volume Expansion
The move began with a liquidity sweep, as BTC pushed above recent highs, hunting stop-losses and inducing breakout traders. This kind of price manipulation is typical of smart money accumulation/distribution zones.
Immediately following that, we observed a volume expansion—a strong signal that institutional players had stepped in, propelling BTC upward with conviction. This expansion pushed price sharply into the 3x Supply Zone, a critical zone of interest from a previous bearish reversal.
🔸 3x Supply Zone – The Turning Point
Once price entered the 3x Supply Zone, bearish pressure resumed. No bullish continuation pattern appeared on the second attempt into this zone—confirming that sellers were defending it aggressively. This area has now been validated as a strong supply barrier, capable of initiating trend reversals.
🔸 Major BOS – Structural Shift Confirmed
Price broke below key support around $120,500, which marked a Major Break of Structure (BOS). This BOS is crucial—it represents a shift from a bullish to bearish market structure and is often the signal that retail longs are trapped.
This BOS was followed by a mini reversal zone, but again, no bullish confirmation appeared there—highlighting market weakness.
🔸 Minor BOS & Trendline Breakdown
Further downside action led to a Minor BOS near $117,800, reinforcing the bearish sentiment. Additionally, the ascending trendline—which had supported BTC’s rally—was decisively broken and retested from below. This confirms a shift in momentum, now favoring sellers.
📍 Current Price Action – Critical Decision Zone
BTC is currently hovering around $117,000, right at a potential demand zone. While there was a brief bullish reaction, the market hasn’t formed a valid bullish reversal pattern yet.
There’s a clear message from the chart:
“We want a bullish pattern here—otherwise, support will break and supply will double.”
In simple terms, unless bulls step in with structure (higher low, engulfing candle, etc.), sellers will likely take over, and price may test deeper support levels.
🎯 What to Watch Next:
✅ Bullish Case:
If BTC forms a strong reversal pattern (e.g., double bottom, bullish engulfing, or inverse head & shoulders), we can expect a short-term recovery back to:
Target 1: $118,500
Target 2: $120,000–$120,500
❌ Bearish Case:
Failure to hold this zone and no clear bullish pattern = likely continuation to the downside, potentially targeting:
$116,000
Even $114,500 in extended moves
🧠 Trading Insights (Educational):
Volume + Structure = Edge
Don’t rely solely on candlestick signals—combine them with structural breaks and volume to get confluence.
Supply Zones Aren’t Just Rectangles
The 3x Supply Zone was powerful because it had historical context, volume convergence, and psychological resistance. These layered factors make zones more reliable.
BOS Isn’t a Trendline Break
BOS means real structural shift. In this case, lower highs and lower lows confirmed the change.
💡 Final Thoughts:
BTC is at a make-or-break level. The recent rejection at the 3x supply zone has shifted the momentum, and buyers must prove their strength now—or risk watching the price unravel further.
Stay patient, wait for structure, and never fight momentum.