Ceasefire Supports Yen’s StrengthThe Japanese Yen stayed strong near a one-week high around 145.5 on Wednesday, supported by risk-off sentiment and dovish commentary from the Bank of Japan. Several BOJ members favored steady rates with concerns over U.S. tariffs and their impact on Japan’s economy.
May’s Services PPI remained above 3% yearly, strengthening speculation that the BOJ could still raise rates later this year. Meanwhile, lingering geopolitical uncertainty and expectations of Fed rate cuts continued to pressure the US Dollar.
The key resistance is at $146.20, and the major support is at $144.85.
Chartanalysis

Uber (UBER, 1W) Tightening Structure Ready for BreakoutOn the weekly chart, UBER has formed a strong ascending wedge / tightening channel, showing clear higher lows and repeated rejections near upper resistance. The price is now approaching the apex of the pattern, with a possible breakout setup above $82.42.
If confirmed, the projected measured move (H = $27.67) aligns with Fibonacci extension targets at:
– $89.86 (1.272)
– $93.74 (1.414)
– $99.32 (1.618)
Technical structure:
– Price held support twice, confirming bullish intent
– Structure tightening — breakout likely on sustained volume
– Bullish divergence forming on the weekly stochastic oscillator
– A breakout above $82.42 activates the next impulse wave
– Volume is stable, with no signs of heavy distribution
Fundamentals:
Uber has reached a major financial milestone: consistent profitability and positive EBITDA growth. The company continues to expand across mobility and delivery, with a focus on cost efficiency, platform monetization, and retention. Increased user activity and growing institutional interest support a bullish mid-term thesis. Uber is increasingly seen as a core holding in next-gen tech and services portfolios.
The technical structure is approaching resolution. A confirmed breakout above $82.42 opens the door for a move to $89.86 → $93.74 → $99.32. With bullish structure and improving fundamentals, Uber is positioned for the next leg higher. This is a setup worth watching.

$PONY nothing technical, just pondering. Where does this go?Hello,
This name is interesting. I will be doing more research and due diligence along with asking some of my peers what they think. This name has seen increasing volume for a while now, daily moves of 5%, 10%, etc. Do you guys have any thoughts? Long term buy and hold? I randomly found this ticker a month ago just browsing.. talk to me in the comments and let me know.
WSL.

$XAU Showing Bearish Flag Pattearn & Dropped $3K Support area...TVC:XAU Showing Bearish Flag Pattearn & Dropped $3K Support area. Price dropping now and back to $3K price level area. price FVG touch and Strong support $3K Price Level area. Here is many support Holder.
Stoploss: $3,536
Entry: $3,377
1st Target point $3,377
2nd Target point $3,249
3rd Target point $3,028
Disclaimer: This article is for informational purposes only and does not constitute financial advice. Always conduct your own research before making any investment decisions. Digital asset prices are subject to high market risk and price volatility. The value of your investment may go down or up, and you may not get back the amount invested. You are solely responsible for your investment decisions and Binance is not available for any losses you may incur. Past performance is not a reliable predictor of future performance. You should only invest in products you are familiar with and where you understand the risks. You should carefully consider your investment experience, financial situation, investment objectives and risk tolerance and consult an independent financial adviser prior to making any investment.

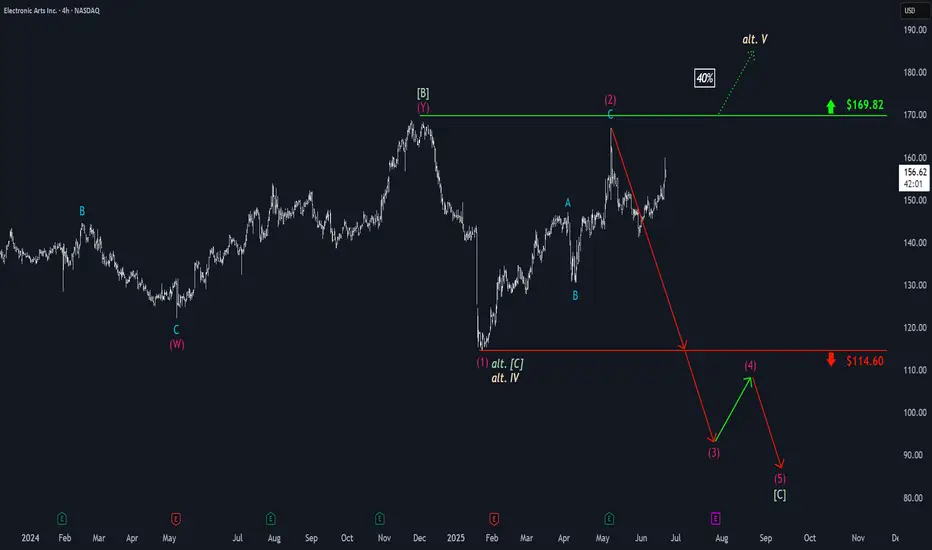
Electronic Arts: Under PressureEA has shown notable upward pressure, diverging from our expected downside continuation. Despite the recent strength, our primary scenario remains valid: we still anticipate an extension of the ongoing magenta five-wave decline, with wave (3) expected to break below support at $114.60. The remaining legs of this impulsive sequence should also stay beneath that threshold, ultimately forming the low of the broader green wave . However, if bullish momentum persists and pushes the stock above resistance at $169.82, we will shift to the alternative scenario (40% probability). This path suggests green wave alt. – and by extension, beige wave alt.IV – has already concluded, and that EA is now in the early stages of wave alt.V, a significant new uptrend.
📈 Over 190 precise analyses, clear entry points, and defined Target Zones - that's what we do.
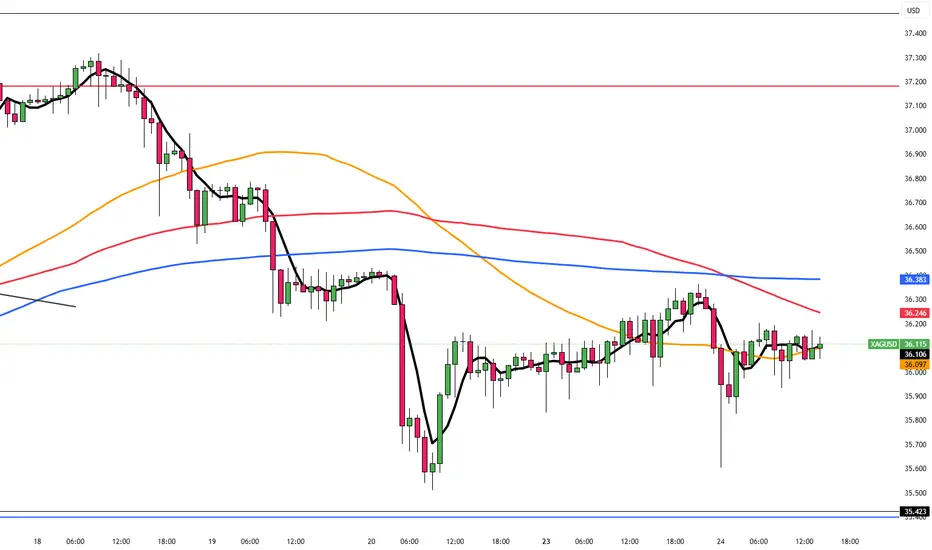
Silver Steady at $36 as Rate Cut Bets RiseSilver steadied around $36.10 during the Asian session, paring earlier losses after the geopolitical jolt. While the ceasefire cooled nerves, markets remain alert after Iran’s limited strike on a US base. Fed commentary also weighed in: Bowman and Waller leaned dovish, though Powell’s tone remains cautious ahead of his testimony.
The first resistance is seen at 37.50, while the support starts at 35.40.
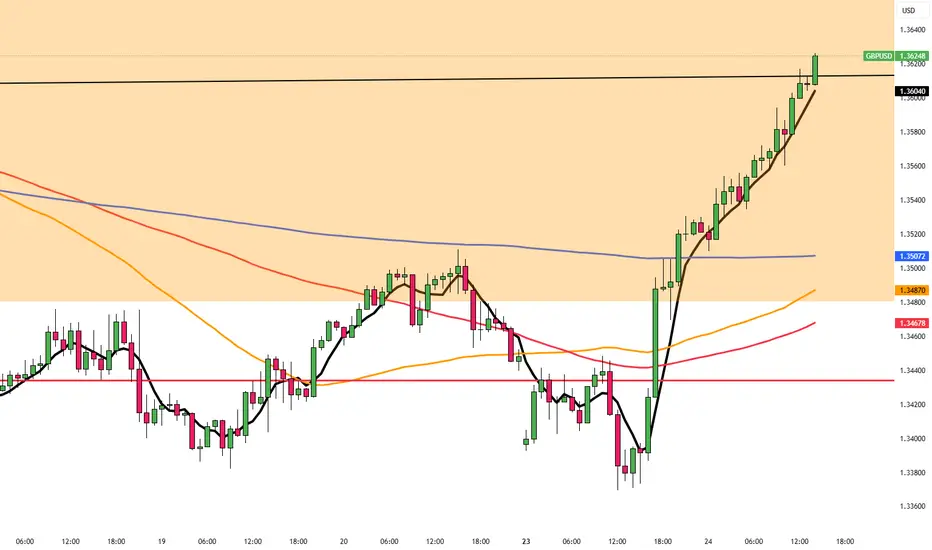
British Pound Slips to One-Month LowGBP/USD briefly climbed to 1.3560 in early European trading, supported by dollar softness and anticipation of upcoming speeches from BoE Governor Bailey and Fed Chair Powell. However, the pair remains under pressure, as market doubts linger around the ceasefire’s durability, especially after new missile activity by Israel’s IDF.
Fed rate cut expectations continue to build: odds for July are now at 23%, and 78% for September, fueled by dovish remarks from Governor Bowman.
Resistance is seen at 1.3600, while support holds at 1.3500.
500% in a day banger from $0.32 to $1.95 $IBO500% in a day banger 🚀Please bring another stock like this today $0.32 to $1.95 AMEX:IBO
In and out at safest levels, no holding and hoping, then we move on to the next stock and keep repeating until too much money is made 🤑

ETH/USDTI think it's time for Ethereum to grow and we should wait for higher targets from Ethereum. Tell me what you think.

$NVDA 6/27 exp week; $150 calls. Quick ChartHello. Market is moving up off the “news” of “ceasefire” from Trump. Take what is given I suppose. NASDAQ:NVDA could see a beautiful upside towards the psych level of $150 in just one session (Tuesday, 6/24) which is just a “small” move of 3%. Could break out of its rising wedge. This name has been lackluster as of late (kinda sorta). $150 calls will be entered at open (6/24) and my first target will be $148.98. There are multiple rejections at these levels. Good luck!
WSL

LINk/USDTFor the Link currency, I feel that this decline is continuing and it is continuing to decline step by step. The chart was not readable. Tell me your opinion.


Coinbase: Surging HigherCoinbase has surged sharply above the $275.90 level, prompting us to consider green wave finished. Now, we see the stock advancing in wave , which still has more upside potential to finalize light green wave a. Afterward, we expect a corrective pullback in wave b, which may dip below $275.90, before green wave c resumes the advance, thus completing orange wave b distinctly above $275.90.
📈 Over 190 precise analyses, clear entry points, and defined Target Zones - that's what we do.

ETHEREUM $1800 IMMINENT – Accumulation nearing completionTraders,
Ethereum is currently forming a textbook example of multi-timeframe accumulation. We’re observing two overlapping accumulation ranges — one on the macro and one on the intraday structure.
In both cases, price has formed two significant lows. A third sweep toward the $1800 zone would complete the pattern and align with the principle of engineered liquidity traps before expansion.
This $1800 level isn't random — it’s where:
- Prior stop runs occurred
- Buyer interest is likely to step in again
- The lower boundary of the range aligns with previous demand
If this level holds, the next logical target sits at $2258, where external liquidity rests above recent highs. The path of least resistance is up once that low is set.
This setup offers high R/R for positional longs, especially if confirmed with absorption or bullish delta response at the $1800 level.
Don’t rush in — but be prepared.
The reaction around $1800 will tell the story.

₿itcoin: PullbackBitcoin has experienced significant selling since Friday, briefly slipping below the $100,000 mark. We previously mentioned that a sharper pullback wouldn't surprise us. Whether prices will drop a bit further remains to be seen for the moment. Ultimately, we still expect Bitcoin to climb into the upper blue Target Zone (coordinates: $117,553 – $130,891) before a broader C-wave sell-off occurs, pushing the price down to the lower blue Target Zone (coordinates: $62,395 – $51,323). There, we anticipate the low of the larger orange wave a, which should mark the start of another corrective upward move. Afterward, we're preparing for the last downward leg of blue wave (ii). However, if Bitcoin directly surpasses the resistance at $130,891 – and thus our upper blue Target Zone – we'll locate it still in blue wave alt.(i) (30% probability).
📈 Over 190 precise analyses, clear entry points, and defined Target Zones - that's what we do.

STATE BANK OF INDIA at Best Support !!This is the 4 hour Chart of STATE BANK OF INDIA.
SBIN is having good Support at 770 range.
SBIN is moving within an ascending channel, with a support zone in the range of 770–780.
If this level is Sustain ,then we may see higher prics in SBIN.
Thank You !!

M&M FIN. SERVICE LTD at Key Zone this is the Daily chart of M&M FIN. SERVICE LTD
M&MFIN having a good law of polarity at 255-260 level .
If this level is sustain ,then we may see higher prices in M&MFIN and if stock sustain below this level then M&MFIN will touch it's support zone 240 level.
Thank you !!

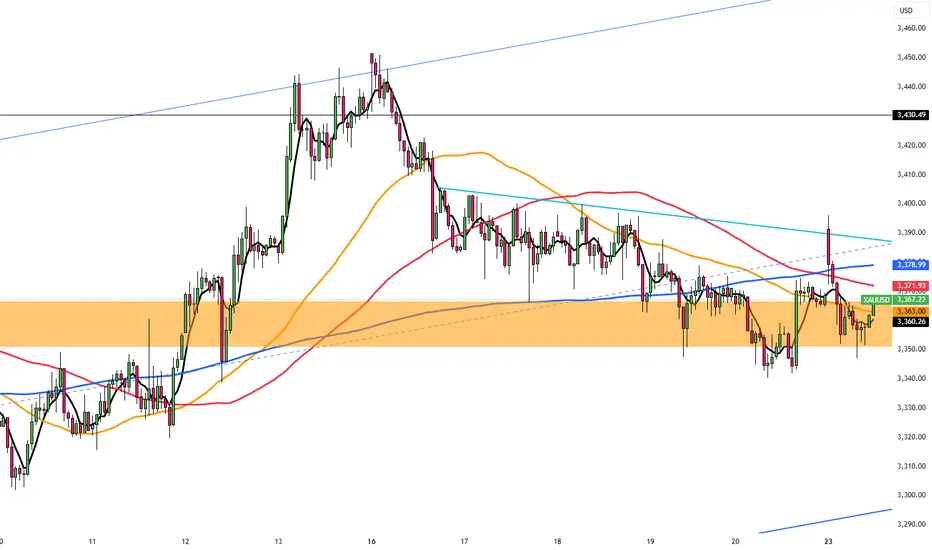
Middle East Conflict Keeps Gold ElevatedGold traded near $3,360 per ounce in choppy conditions on Monday, as investors closely watched developments in the intensifying Middle East conflict following U.S. involvement in Israeli airstrikes on Iran. Over the weekend, U.S. forces targeted Iran’s three main nuclear facilities, with President Donald Trump warning of further action unless Tehran agrees to peace. The eruption of war between Israel and Iran has added new fuel to a rally that has pushed gold prices up nearly 30% this year.
Resistance is seen at $3,395, while support holds at $3,316.
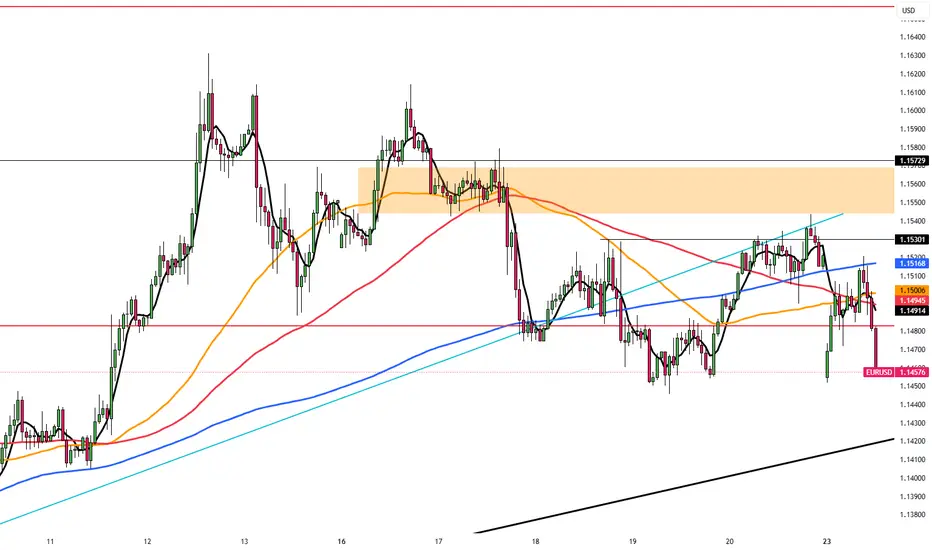
Trump’s Strike on Iran Lifts Dollar, Weighs on EuroEUR/USD dipped to around 1.1480 in early Asian trading Monday as the dollar strengthens following President Trump’s decision to join Israel’s war on Iran, escalating the conflict. Over the weekend, US forces struck three Iranian nuclear sites; Fordo, Natanz, and Isfahan. Trump claimed the facilities were “totally obliterated” and warned of harsher attacks unless Iran seeks peace. The escalation supports safe-haven demand for the dollar, pressuring EUR/USD.
Meanwhile, the ECB cut rates for the eighth time this year but signaled a pause in July. President Lagarde said cuts are nearing an end, which may help limit euro losses.
Resistance is located at 1.1530, while support is seen at 1.1450
WTI(oil)For oil, what I have in mind, considering the conditions we are in, if the Strait of Hormuz is not closed, we will remain at the same prices, that is, $75 to $80. But if the Strait is closed 100%, the price will go up to $130 and $150 in the short term.

GOLD/USDGold is in a range on the daily time frame, and if you know how to trade in a range market, use this analysis.

Gold Outlook: 3 Critical Zones That Could Shape the Next Move▋Observation & Meanings:
▪Price has broken out of the Broadening Wedge to the upside — a strong move led by bulls.
▪It then pulled back after reaching the 100% projection of the previous upswing, which also marked the likely extent of the retracement.
▪A break below the minor low (a) suggests short-term downward pressure.
▪However, the overall uptrend structure remains intact as long as the main low (A) holds.
▋What’s next?
Trading a retracement is always tricky — by nature, it means going against the prevailing trend.
▪ Question 1 : Is there anything to do when price falls below the minor low (a)?
Often, the best move is to stay patient and let the market reveal its intentions, some setups may offer opportunities:
▫The main prior low could act as a key short-term support, as it aligns with the 100% retracement of the previous upswing.
▫For aggressive traders, a quick short toward that level may be an option.
▪ Question 2 : When will a new trend begin?
▫Bearish scenario: A confirmed break below the main prior low could signal the start of a more sustainable downtrend.
▫Bullish scenario: Aside from Aside from (1) a direct breakout above the previous high (B), signs of strength may also come from:
(2) A clear lower high or
(3) A consolidation range, followed by a strong upside break.
In this case :
- The prior high (by definition) marks resistance.
- However, there’s also a tight congestion area before that high, which may act as the real barrier — potentially even more significant due to its cluster of price action.
▫Once early trend signals appear, the next step is to assess if the structure supports a lasting trend.
▋The 3 big zones:
▪ Uptrend Zone
The market is likely regaining upward momentum when one of the following occurs:
1. Price spikes above the previous swing high at point B.
2. Price breaks the tight congestion area to the upside.
3. A new consolidation range forms and breaks to the upside.
▪ Downtrend Zone
A clean break below the main prior low (A) would likely confirm bearish control and may open room for further downside.
▪ Ambiguous Zone
If price fails to meet the conditions for either an uptrend or a downtrend, it’s likely to remain in a drifting, indecisive state.
▋Mental Notes:
▪Don’t predict the price, trade the price. Have a plan, but not blindly follow.
▪The market will always find ways to surprise. Stay open and follow the flow.
▋Not Financial Advice
The information contained in this article is not intended as, and should not be understood as financial advice. You should take independent financial advice from a professional who is aware of the facts and circumstances of your individual situation.

SOLANA MARKETCAP LOOKS COOKEDIs that a Head and Shoulder's top?
Is #crypto about to endure a Iron dome penetration event?
