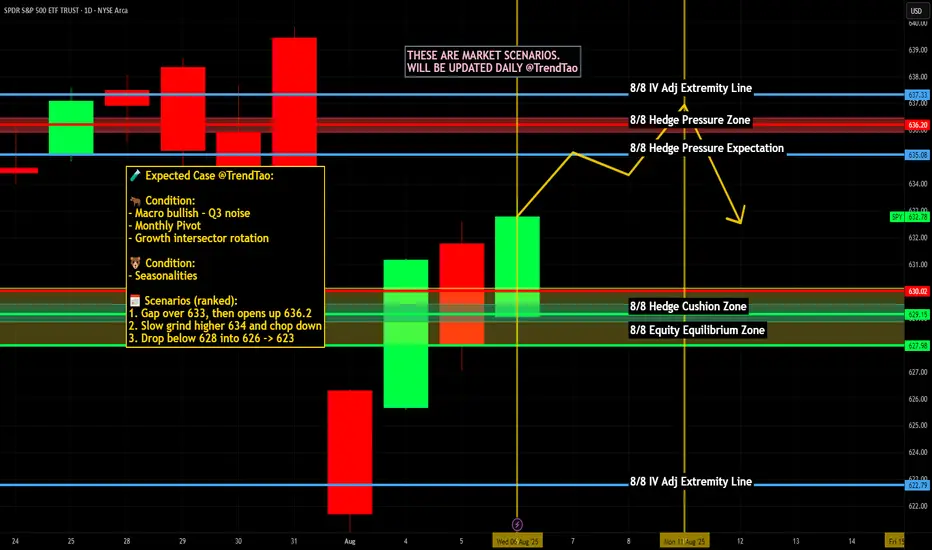
Nightly $SPY / $SPX Scenarios for August 7, 2025🔮 Nightly AMEX:SPY / SP:SPX Scenarios for August 7, 2025 🔮
🌍 Market‑Moving News 🌍
📦 Major Tariffs Implemented Today
Sweeping tariffs ranging from 10% to over 40% officially took effect today on imports from numerous countries, significantly escalating global trade tensions. Markets are closely tracking initial reactions across affected sectors, especially pharmaceuticals and semiconductors.
💻 Semiconductor Tariff Shakes Tech Sector
President Trump introduced a substantial 100% tariff on semiconductor imports, with notable exemptions for U.S. investors such as Apple, Nvidia, and AMD. Apple shares surged 5.1% amid investor optimism, while broader tech stocks saw mixed reactions.
🚀 Firefly Aerospace IPO Debut
Firefly Aerospace launched its IPO today, pricing shares at $45. The stock began trading on Nasdaq under ticker "FLY," attracting significant attention due to its positioning in the space and defense technology sector.
📊 Key Data Releases & Events 📊
📅 Thursday, August 7, 2025:
8:30 AM ET – Initial Jobless Claims (week ending Aug 2)
Forecast: 221,000
Previous: 218,000
8:30 AM ET – U.S. Productivity (Q2)
Forecast: 1.9%
Previous: –1.5%
8:30 AM ET – U.S. Unit Labor Costs (Q2)
Forecast: 1.3%
Previous: 6.6%
10:00 AM ET – Wholesale Inventories (June)
Forecast: N/A
Previous: –0.3%
10:00 AM ET – Speech by Atlanta Fed President Raphael Bostic
Topic: Monetary policy outlook; market-sensitive for potential Fed signals.
3:00 PM ET – Consumer Credit (June)
Forecast: N/A
Previous: $5.1B
⚠️ Disclaimer:
This content is for educational and informational use only and is not financial advice. Always consult a licensed financial advisor before making investment decisions.
📌 #trading #stockmarket #economy #tech #earnings #IPO #Fed #tariffs #semiconductors
Charting
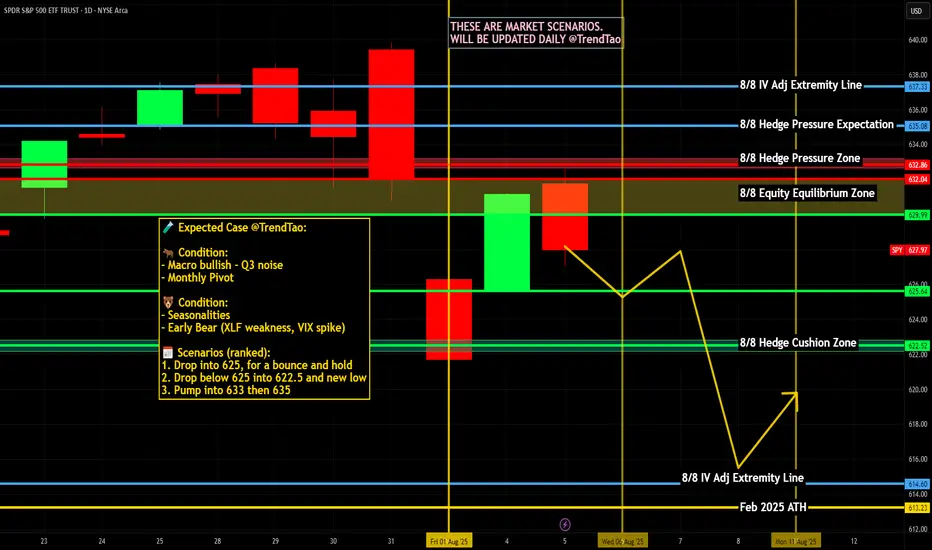
Nightly $SPY / $SPX Scenarios for August 6, 2025🔮 Nightly AMEX:SPY / SP:SPX Scenarios for August 6, 2025 🔮
🌍 Market‑Moving News 🌍
🪙 Citi Lifts Gold Price Forecast Amid Global Uncertainty
Citi raised its short-term gold outlook to $3,500/oz, citing surging safe-haven demand driven by trade instability, softening labor metrics, and heightened geopolitical risk. Risk premiums and volatility remain elevated.
📉 Equities Tumble as Risk Aversion Returns
U.S. stocks slipped on renewed caution—investors rotated into bonds and precious metals following weaker job indicators and escalating trade friction. The dollar and gold strengthened, while equity futures pulled back.
📊 Key Data Releases & Events 📊
📅 Wednesday, August 6:
No major U.S. economic data releases scheduled for today. Markets are closely monitoring corporate earnings reports and commentary from Fed officials, including San Francisco Fed President Mary Daly later in the day.
⚠️ Disclaimer:
This content is for educational and informational purposes only—it is not financial advice. Always consult a licensed financial advisor before making investment decisions.
📌 #trading #stockmarket #economy #trade #currency #gold #earnings
Nightly $SPY / $SPX Scenarios for August 5, 2025🔮 Nightly AMEX:SPY / SP:SPX Scenarios for August 5, 2025 🔮
🌍 Market‑Moving News 🌍
🔹 PBOC Moves Prompt FX Backlash
On August 5, 2019, China’s central bank allowed the yuan to depreciate over 2% to its lowest level since 2008. That same day, the U.S. Treasury officially designated China as a currency manipulator, citing the PBOC’s moves as retaliation for recent U.S. tariff actions. In response, China ordered state-owned enterprises to suspend purchases of U.S. agricultural goods—a significant blow to U.S. exporters.
🔹 EU Suspends Counter-Tariffs for Six Months
Following a negotiated framework with the U.S., the European Union suspended retaliatory tariffs on U.S. goods for six months. The move aims to de-escalate trade tensions while joint discussions continue.
🔹 Citi Raises Gold Price Outlook to $3,500/oz
Citi revised its short-term trading range for gold to $3,300–$3,600 per ounce, based on weakening U.S. labor data, rising inflation pressure from tariffs, and growing demand for safe-haven assets. Spot gold traded around $3,356 oz on Monday.
📊 Key Data Releases & Events 📊
📅 Tuesday, August 5:
8:30 AM ET – U.S. Trade Balance (June)
Expected to improve modestly to –$67.6 billion (from –$71.5B), reflecting tariff-influenced shifts in import/export volumes.
9:45 AM ET – S&P Global U.S. Final Services PMI & ISM Non-Manufacturing Index (July)
Key indicators of service-sector strength. Readings above 50 suggest expansion; below 50, contraction. Flash estimates forecast moderated growth in activity.
⚠️ Disclaimer:
This content is for educational and informational use only—not financial advice. Consult a licensed financial advisor before making investment decisions.
📌 #trading #stockmarket #economy #trade #data #inflation #currency

Weekly $SPY / $SPX Scenarios for August 4–8, 2025🔮 Weekly AMEX:SPY / SP:SPX Scenarios for August 4–8, 2025 🔮
🌍 Market-Moving News 🌍
📦 U.S. Tariffs Finalized as August 7 Deadline Nears
President Trump’s administration confirmed newly finalized tariff rates—ranging from 10% to over 40%—on dozens of countries, set to take effect starting August 7. The announcement has heightened global trade uncertainty and injected volatility into equity markets
📉 Weak Jobs Data Spurs Concern
July’s nonfarm payrolls came in at just 73,000 jobs added, far below expectations, while revisions to May and June data subtracted a combined 258,000 jobs. In response, the administration fired the Bureau of Labor Statistics head, escalating political risk around economic transparency
📈 U.S. Shows Resilience Amid Policy Chaos
Despite the tariff-era turbulence and labor softness, U.S. Q2 GDP rose by 3%—outperforming forecasts. Businesses racked up inventory as a hedge, absorbing initial price shocks. Still, concerns about sustained inflation pressures and waning consumer confidence linger
🎯 Earnings Week Spotlight on Tech & Industrial Names
Major companies reporting include Palantir (Monday), AMD, Uber, Disney, McDonald’s, Gilead, Pfizer, Constellation Energy, and Eli Lilly. Markets will watch for AI signals, consumer demand, and industrial trends
📊 Key Data Releases & Events 📊
📅 Monday, August 4
Factory Orders (June) — Critical for industrial demand and trade momentum.
📅 Tuesday, August 5
ISM U.S. Services PMI (July) — Thermometer for expansion in the biggest part of the economy.
S&P U.S. Services PMI (July, flash) — Preliminary signal on service-sector strength.
Trade Balance (June) — Watching for impact of tariffs and shifting cross-border flows.
📅 Thursday, August 7
Initial & Continuing Jobless Claims — Weekly labor-market readings post weak payroll report.
Productivity & Labor Costs (Q2) — Reflect business efficiency and wage trend shifts.
Wholesale Inventories (June) — Key for supply-chain and inventory cycle insights.
Consumer Credit (June) — Measures household borrowing resilience.
📅 Friday, August 8
Fed Speech: St. Louis Fed President Musalem — Market-watchers will look for cues on the near-term rate path.
⚠️ Disclaimer:
This weekly outlook is for educational and informational purposes only and should not be construed as financial advice. Always consult a licensed financial advisor before making investment decisions.
📌 #trading #stockmarket #economy #tariffs #jobs #earnings #inflation #Fed #technicalanalysis
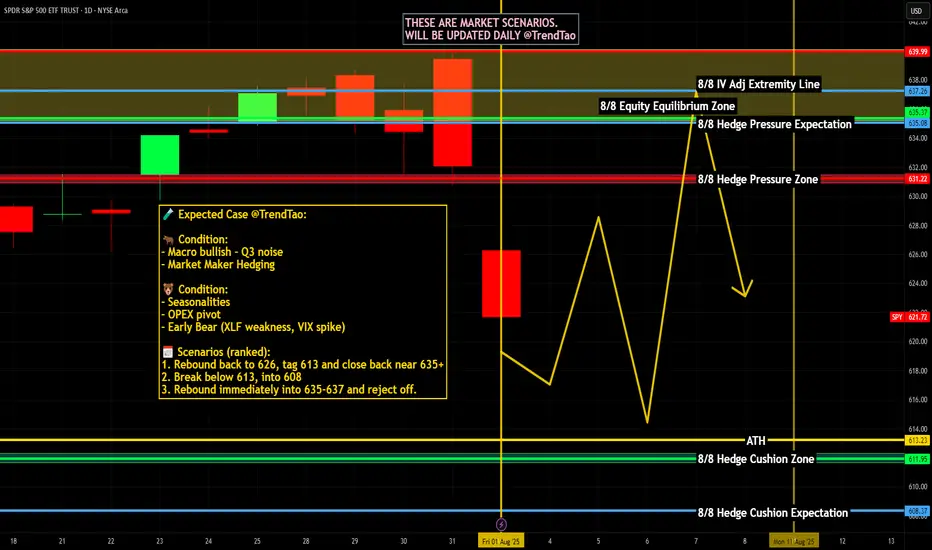
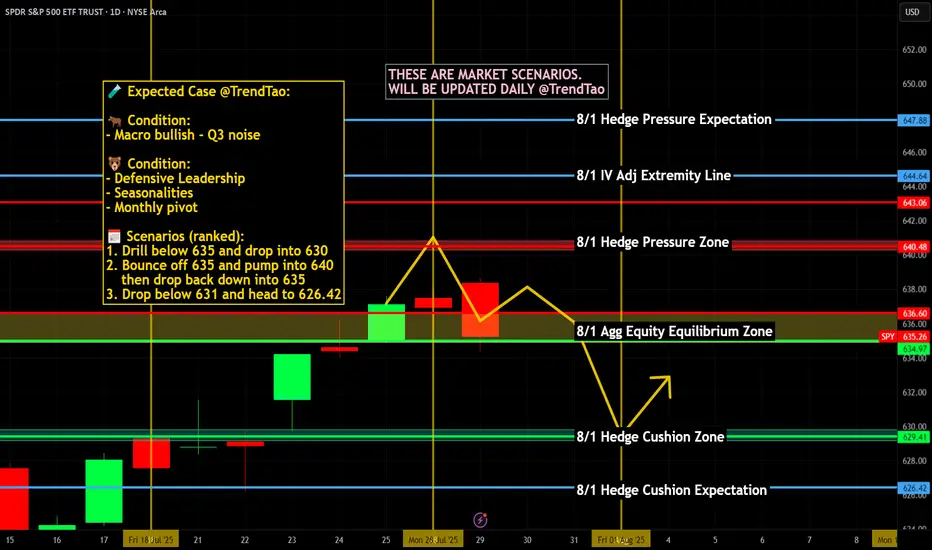
Nightly $SPY / $SPX Scenarios for August 1, 2025🔮 Nightly AMEX:SPY / SP:SPX Scenarios for August 1, 2025 🔮
🌍 Market-Moving News 🌍
📦 U.S. Imposes New Tariffs as Deadline Passes
Fresh tariffs rolled out on August 1 hitting major exporters: 25% on Indian goods, 20% on Taiwan, 19% on Thailand, and 15% on South Korea. Canadas tariff elevated to 35%, though Mexico got extra negotiation time. Global equity markets slipped modestly, led by declines in Asia-Pacific regions. AMEX:SPY futures also eased on mounting geopolitical and trade pressures.
🏦 Fed Uncertainty Mounts Despite Calm GDP
Despite robust Q2 GDP growth and a hold on interest rates this week, Fed Chair Jerome Powell faced growing unrest. Comments acknowledged downside labor risk amid trade uncertainty—investors are now assigning just a 39% chance of a rate cut in September.
📊 Key Data Releases & Events 📊
📅 Friday, August 1:
8:30 AM ET – Nonfarm Payrolls (July):
Payrolls rose by 106,000, less than June’s 147,000 but still positive. Wage growth slowed, easing inflation concerns slightly.
8:30 AM ET – Unemployment Rate:
Unemployment ticked up to 4.2%, from 4.1% in June—reflecting modest labor softness.
8:30 AM ET – Average Hourly Earnings (MoM):
Wages rose +0.2%, down from +0.4% in June, signaling wage pressure easing.
⚠️ Disclaimer:
This information is provided for educational and informational purposes only and should not be construed as financial advice. Always consult a licensed financial advisor before making investment decisions.
📌 #trading #stockmarket #economy #jobs #Fed #tariffs #inflation #technicalanalysis

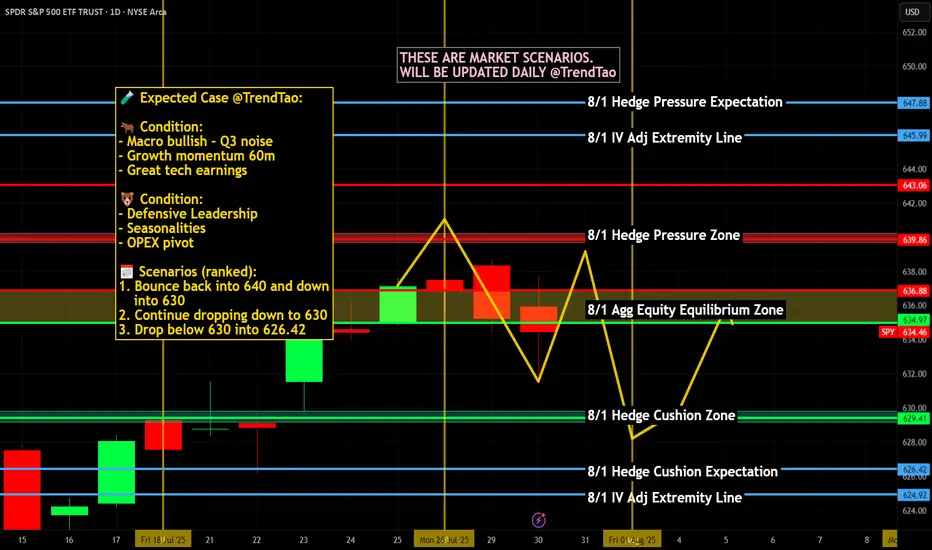
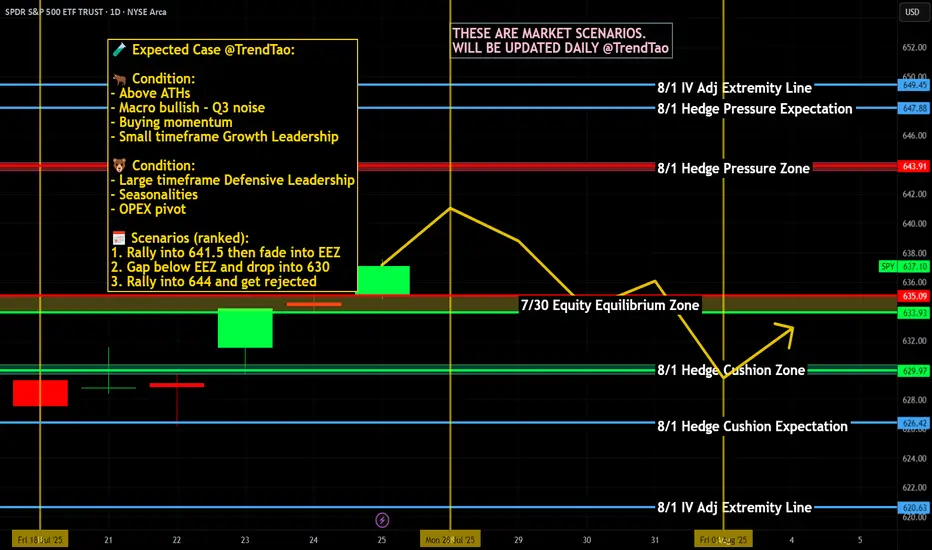
Nightly $SPY / $SPX Scenarios for July 31, 2025🔮 Nightly AMEX:SPY / SP:SPX Scenarios for July 31, 2025 🔮
🌍 Market-Moving News 🌍
🏦 Fed Holds Rates — Dissent Indicates Division
The Federal Reserve maintained its benchmark rate at 4.25%–4.50%. Notably, two governors—Christopher Waller and Michelle Bowman—dissented in favor of a 25 bp rate cut, underscoring internal divisions amid growing political pressure
📈 Strong Q2 Growth, But No Rate-Cut Signal
U.S. GDP expanded at a 3.0% annualized rate in Q2, rebounding sharply from Q1's contraction. Despite this, Powell emphasized persistent inflation, particularly from tariffs, reinforcing the Fed’s cautious policy stance
🛢️ Oil Climbs as Tariff Tensions Rise
Brent crude rose to ~$73.51 and WTI to ~$70.37 on fears of supply disruptions tied to President Trump’s threats of new tariffs on Russian oil and new tariffs imposed on Brazil and South Korea
📊 Key Data Releases & Events 📊
📅 Thursday, July 31:
8:30 AM ET – Initial Jobless Claims (week ending July 26)
Initial claims rose to 222,000, up from 217,000 previously—an early gauge of labor-market trends
8:30 AM ET – Employment Cost Index (Q2)
Quarterly growth in labor costs edged lower to 0.8%, down from 0.9%—a signal of moderate wage pressures
8:30 AM ET – Personal Income (June)
Data released on household income and spending patterns—crucial for assessing consumer resilience heading into Q3
⚠️ Disclaimer:
This information is for educational and informational purposes only and should not be construed as financial advice. Always consult a licensed financial advisor before making investment decisions.
📌 #trading #stockmarket #economy #Fed #inflation #jobs #technicalanalysis
Nightly $SPY / $SPX Scenarios for July 30, 2025🔮 Nightly AMEX:SPY / SP:SPX Scenarios for July 30, 2025 🔮
🌍 Market‑Moving News 🌍
🧭 Fed Holds Steady Amid Uncertainty
As the FOMC enters its July 29–30 meeting, the Fed is expected to keep rates unchanged at 4.25%–4.50%, even as one or two governors may dissent in favor of rate cuts amid mixed economic data. Recent strength in consumer spending contrasts with weakness in housing and construction.
🌐 U.S.–China Trade Talks Resumed in Stockholm
Talks are under way aimed at extending the tariff truce before the August 12 deadline. Both sides described progress as constructive, though analysts remain cautious on the timeline and potential outcomes.
🛢️ Oil Up / Dollar Firmer, But Risks Remain
Brent crude hit ~$72.50/barrel (+3.5%) while WTI rose to ~$69.20 on a mix of geopolitical tension (possible new Russia tariffs) and trade optimism. The U.S. dollar edged higher following the U.S.–EU trade agreement.
📈 IMF Revises Up Global Growth—but Flags Tariff Risks
The IMF raised its 2025 growth forecast to 3.0% and maintained 3.1% for 2026, citing pre-emptive consumer demand—but warned that ongoing U.S. tariffs and policy inconsistency could dampen momentum.
📊 Key Data Releases & Events 📊
📅 Wednesday, July 30:
FOMC Rate Decision & Powell Press Conference
The Fed is expected to hold interest rates steady. Powell’s remarks will be closely watched for signals on the timing of future cuts and views on inflation and labor markets.
Advance Q2 U.S. GDP Estimate
The first look at Q2 growth is expected around +1.9% YoY, potentially validating a rebound after Q1’s contraction.
June PCE & Core PCE (Personal Consumption Expenditures Index)
The Fed's preferred inflation gauge. Markets will monitor if core inflation remains elevated, which may reinforce policy caution.
⚠️ Disclaimer:
This summary is for educational and informational purposes only—it is not financial advice. Always consult a licensed financial advisor before making investment decisions.
📌 #trading #stockmarket #economy #Fed #GDP #inflation #trade #tariffs #markets
Nightly $SPY / $SPX Scenarios for July 29, 2025🔮 Nightly AMEX:SPY / SP:SPX Scenarios for July 29, 2025 🔮
🌍 Market‑Moving News 🌍
U.S.–EU Trade Deal Sparks Optimism
The U.S. and EU signed a trade framework allowing a 15% tariff rate on most EU imports, averting harsher penalties. The S&P 500 and Nasdaq both closed at fresh record highs, supported by upbeat tech earnings sentiment—Tesla advanced on a new $16.5B AI chip deal with Samsung—while U.S.–China trade talks resume in Stockholm.
Fed Likely to Hold Rates; Political Pressure Mounts
The Fed is expected to leave its benchmark rate at 4.25%–4.50% at the July 29–30 FOMC meeting. Chair Powell faces growing political pressure from President Trump to cut rates and concerns about central bank independence remain elevated.
Trade Talks Extension to Avoid Tariff Hike Deadline
The August 1 tariff deadline looms. Markets are watching to see if trade deals with China, Canada, and the EU extend the pause or risk new tariffs. Volume in AI/chip stocks and industrials reflects sensitivity to trade developments.
📊 Key Data Releases & Events 📊
📅 Tuesday, July 29
FOMC Meeting Begins — All eyes on Fed rate decision and updated projections.
GDP (Advance Q2 Estimate) — Expected around +1.9% on signs of economic rebound.
⚠️ Disclaimer:
This summary is for educational and informational purposes only—it is not financial advice. Always consult a licensed financial advisor before making investment decisions.
📌 #trading #stockmarket #economy #Fed #trade #tariffs #PCE #jobs #technicalanalysis

Weekly $SPY / $SPX Scenarios for July 28–August 1, 2025🔮 Weekly AMEX:SPY / SP:SPX Scenarios for July 28–August 1, 2025 🔮
🌍 Market‑Moving News 🌍
🏦 Fed Holds Steady, Faces Political Pressure
The Federal Reserve is expected to keep rates at 4.25%–4.50% during its FOMC meeting midweek. While rates are unchanged, political pressure from President Trump continues as calls intensify for rate cuts and questions arise over the Fed’s independence—including dissent from Governors Waller and Bowman.
📦 Trade Truce Extends & New Deal With EU
A new trade framework with the EU reduces tariffs to 15%, easing tensions. Meanwhile, U.S. and Chinese trade teams begin talks in Stockholm on Monday aiming to avoid an early-August tariff deadline.
💻 Tech and Mega-Cap Earnings Spotlight
This week features earnings from tech giants including Meta, Microsoft (Wednesday), followed by Amazon and Apple (Thursday). Markets will prioritize forward guidance around AI investments, capital expenditures, and sales trends.
📊 Key Data Releases & Events 📊
📅 Monday, July 28
No major releases
📅 Tuesday, July 29
Chicago PMI (July flash) – early indicator of regional manufacturing trends.
Global PMIs – flash readings for Europe and Asia gauge economic health.
📅 Wednesday, July 30
FOMC Rate Decision & Powell Press Conference – investors will scrutinize tone, forward guidance on rates, labor markets, and inflation.
Q2 U.S. GDP (Advance Estimate) – expected at ~1.9%, signaling rebound after Q1 contraction.
📅 Thursday, July 31
June PCE & Core PCE Indexes – Fed’s preferred inflation measure. Core PCE expected at ~2.7% YoY.
Consumer Confidence (July) – key for household spending trends.
Trade Balance (June) – provides data on U.S. import/export dynamics.
📅 Friday, August 1
July Nonfarm Payrolls, Unemployment & Wage Data – forecast for ~102,000 new jobs and ~4.2% unemployment; markets await for labor-market cooling signs.
Tariff Deadline – new tariffs loom unless trade agreements with EU, Canada, China etc. materialize by today’s cutoff.
⚠️ Disclaimer:
This summary is educational and informational only. It is not financial advice. Always consult a licensed financial advisor before making any investment decisions.
📌 #trading #stockmarket #economy #Fed #earnings #inflation #tariffs #GDP #PCE #jobs #technicalanalysis
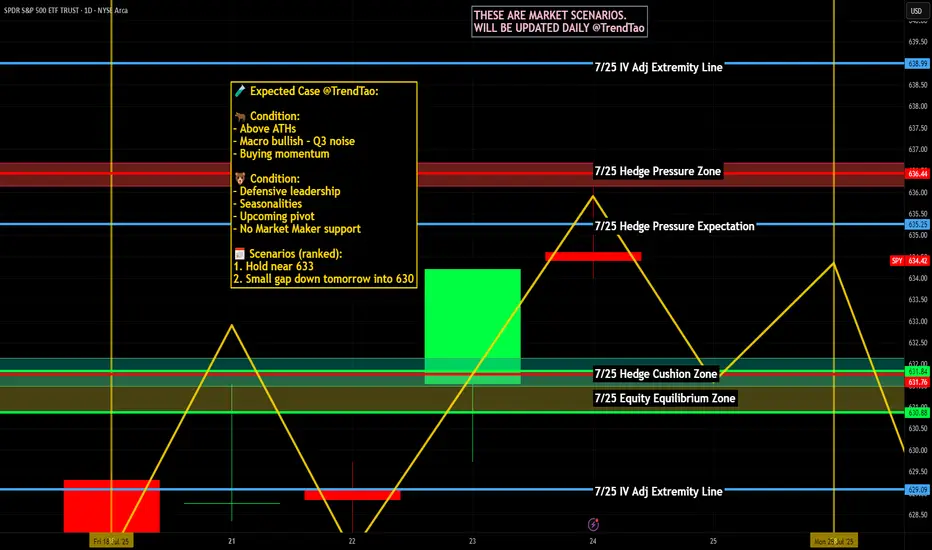
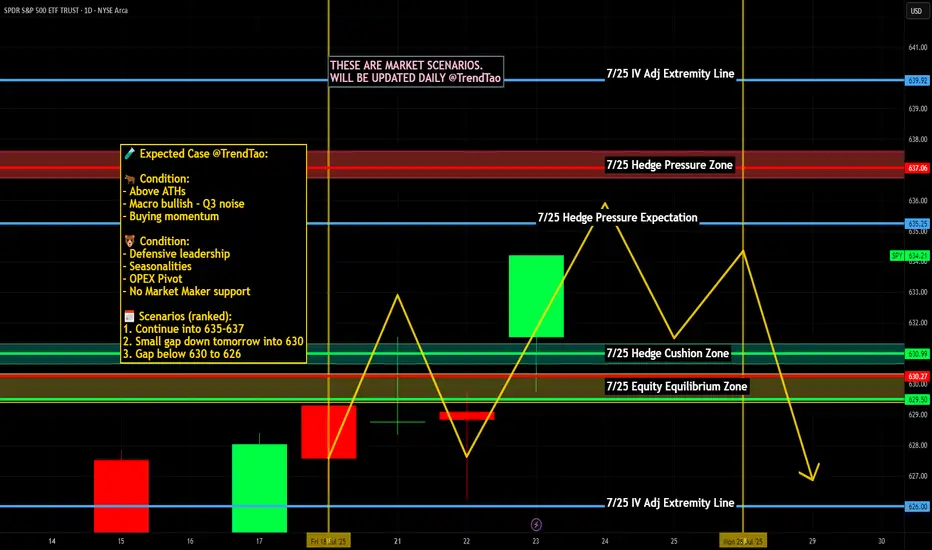
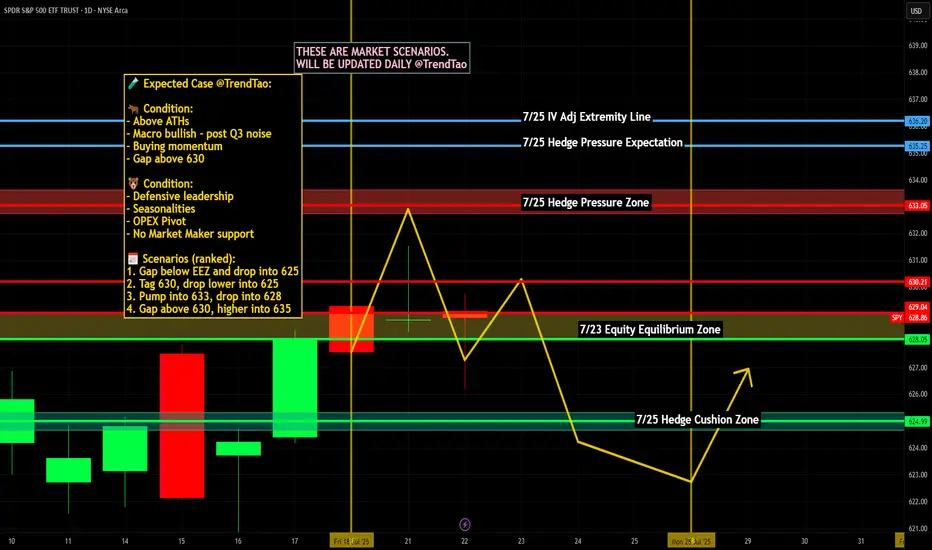
Nightly $SPY / $SPX Scenarios for July 25, 2025🔮 Nightly AMEX:SPY / CBOE:SPX Scenarios for July 25, 2025 🔮
🌍 Market‑Moving News 🌍
🏔️ Copper Market Flashpoint
Following President Trump’s announcement of steep copper tariffs (15–50% range), U.S. copper futures surged, then sharply reversed. Inventory arbitrage between CME and LME markets surged, distorting pricing dynamics and triggering concern over metal market stability.
🇪🇺 EU–China Summit Signals Trade Reset
EU leaders concluded their 25th summit with China, fostering deeper economic and strategic ties. Observers expect follow-up on mutual trade agreements, particularly regarding tech and sustainability sectors.
🌍 EM Equity Rally Consolidates Gains
Emerging markets continue to outperform global equities in 2025—with MSCI EM up ~18% vs. S&P 500. Analysts highlight strong opportunities in AI/fintech stocks in China and Latin America, suggesting further rotations out of U.S. markets.
📊 Key Data Releases & Events 📊
📅 Friday, July 25:
8:30 AM ET – Durable Goods Orders (June):
Forecast shows a sharp drop (~–10%), following a ~16% gain in May—signaling possible cooling in business-related equipment purchases.
10:00 AM ET – U.S. Imports of Steel Products (June):
Trade-data release monitoring steel flows amid evolving tariff frameworks.
All Day – Corporate Earnings Reports:
Companies such as First Financial Bancorp (FFBC), HCA, AON, Charter, and others report earnings. Outlooks may influence small- to mid-cap sentiment.
⚠️ Disclaimer:
This report is for educational and informational purposes only—not financial advice. Always consult a licensed financial advisor before making investment decisions.
📌 #trading #stockmarket #economy #data #earnings #commodities #EM #technicalanalysis
Nightly $SPY / $SPX Scenarios for July 24, 2025🔮 Nightly AMEX:SPY / SP:SPX Scenarios for July 24, 2025 🔮
🌍 Market-Moving News 🌍
🤝 U.S.–EU & U.S.–Japan Trade Optimism Lifts Sentiment
The S&P 500 and Nasdaq hit record-high closes on July 23, fueled by optimism over a potential U.S.–EU trade deal mirroring the U.S.–Japan framework, with the EU-set tariff on autos potentially halved to 15%
💵 Dollar Retreats, Yields Climb
As markets shifted toward risk assets, U.S. Treasury yields increased and gold softened, while the dollar eased—highlighting growing confidence in trade-driven growth news
🏦 Fed Independence Under Pressure—But No July Cut Expected
A Reuters poll shows economists see heightened political pressure on the Fed jeopardizing its independence, though the consensus remains that rates will stay unchanged this month
📊 Key Data Releases & Events 📊
📅 Thursday, July 24:
8:30 AM ET – Initial Jobless Claims
Weekly tally of new unemployment benefit applications—key indicator of labor-market conditions.
10:00 AM ET – New Residential Sales (June)
Tracks signed contracts for new homes, offering insight into housing demand under tightening mortgage rates.
All Day – Trade Headlines & Fed Watch
Continued focus on U.S.–EU trade developments and any follow-up to Fed independence concerns from policy circles.
⚠️ Disclaimer:
This information is for educational and informational purposes only—not financial advice. Please consult a licensed financial advisor before making investment decisions.
📌 #trading #stockmarket #trade #economy #Fed #housing #jobs #technicalanalysis
Nightly $SPY / $SPX Scenarios for July 23, 2025🔮 Nightly AMEX:SPY / SP:SPX Scenarios for July 23, 2025 🔮
🌍 Market-Moving News 🌍
📈 Morgan Stanley Stays Bullish
Morgan Stanley reaffirmed its optimistic view, forecasting the S&P 500 will reach 7,200 by mid‑2026. They cited strong earnings and anticipated rate cuts as key drivers, though warned of risks from rising Treasury yields and tariff-related cost pressure
📉 Inflation Debate Reignites
A renewed debate is underway regarding whether tariffs are "transitory" or persistent inflation drivers. Treasury counselor Joseph Lavorgna argued tariff impacts will be one-off, while others caution long-term price pressures may persist, complicating Fed policy directions
🏛️ Calls for Fed Reform Intensify
Treasury Secretary Scott Bessent suggested structural reforms to the Federal Reserve could have greater long-term impact than removing Chair Powell, highlighting ongoing concerns over central-bank governance amid political criticism
💳 Investors Shift to Corporate Bonds
As equity valuations have surged, investors are reallocating toward investment-grade corporate bonds, reducing credit spreads to the tightest levels since 1998—a sign of elevated risk appetite balanced with caution
📊 Key Data Releases & Events 📊
📅 Wednesday, July 23:
(No major U.S. economic releases)
Market focus remains on tech earnings (Tesla, Alphabet) and Fed signals following Tuesday’s Powell address.
⚠️ Disclaimer:
This information is for educational/informational purposes only and does not constitute financial advice. Please consult a licensed financial advisor before making investing decisions.
📌 #trading #stockmarket #economy #tariffs #Fed #earnings #corporatebonds
Nightly $SPY / $SPX Scenarios for July 22, 2025🔮 Nightly AMEX:SPY / SP:SPX Scenarios for July 22, 2025 🔮
🌍 Market-Moving News 🌍
🚀 Tech & EV Stocks in Focus Ahead of Earnings
Futures were quiet ahead of Tuesday’s open, but key movers included Astera Labs (+19%), Alphabet (+2.7%), Netflix +2%, and Robinhood –4.9% after being passed over for the S&P 500. Investors are positioning ahead of major tech and EV earnings this week — including Tesla, Alphabet, Lockheed Martin, Coca‑Cola, and Honeywell
📣 Powell Speech Eyed for Rate Clues
Fed Chair Jerome Powell is set to speak at 8:30 AM ET today at the Integrated Review of the Capital Framework for Large Banks Conference in D.C. Markets will be watching for any indications on future interest rate direction
🌏 Japan’s Political Shift Has Little Market Impact
Japan’s ruling coalition lost its upper-house majority over the weekend, but markets remained stable as it was largely expected. The yen held steady, and Asian equities stayed calm amid the holiday—focus remains on upcoming corporate earnings
📊 Key Data Releases & Events 📊
📅 Tuesday, July 22:
8:30 AM ET – Powell Speech: Key address at the bank regulation conference. Tone and forward guidance may sway bond and equity markets.
After Market Close – Alphabet & Tesla Earnings: Heavyweights due today—market attention will track revenue guidance, especially on advertising, EV demand, and AI.
⚠️ Disclaimer:
For educational and informational purposes only. Not financial advice—consult a licensed advisor before making investment decisions.
📌 #trading #stockmarket #tech #Fed #earnings #AI #infrastructure #volatility
Weekly $SPY / $SPX Scenarios for July 21–25, 2025🔮 Weekly AMEX:SPY / SP:SPX Scenarios for July 21–25, 2025 🔮
🌍 Market-Moving News 🌍
🏦 Fed Chair Powell Speaks — Markets Key Into Tone
Federal Reserve Chair Jay Powell’s Jackson Hole speech is the week’s centerpiece. Markets will be closely listening for clues on inflation strategy, rate-cut timing, and sensitivity to geopolitical inflation drivers like tariffs.
📦 Tariff Deadlines Gain Spotlight
Multiple tariff deadlines are set this week for targeted trade partners including the EU, Mexico, Canada, Japan, South Korea, and Thailand. Any new announcements or extensions could trigger volatility in trade-exposed sectors.
🛢️ Oil Market Mixed Signals
Brent crude prices have stabilized near mid-$70s, but OPEC+ discussions regarding supply extensions and global growth concerns continue to inject uncertainty into energy-linked equities.
📈 Big Tech Earnings Kick Off
The “Magnificent Seven” tech giants begin reporting: Nvidia leads on Tuesday, followed by Microsoft, Amazon, Alphabet, and Meta later in the week. Expect significant sentiment swings based on forward commentary.
📊 Key Data Releases & Events 📊
📅 Monday, July 21
Quiet session ahead of a packed week of speeches and data.
📅 Tuesday, July 22
8:30 AM ET – Existing Home Sales (June):
Measures signed contracts on previously owned homes—a key housing indicator.
After Market Close – Nvidia Q2 Earnings:
Market will watch guidance and China commentary.
📅 Wednesday, July 23
8:30 AM ET – Leading Economic Indicators (June):
An early gauge of U.S. economic momentum.
📅 Thursday, July 24
8:30 AM ET – Initial & Continuing Jobless Claims:
Labor-market health indicator.
📅 Friday, July 25
8:30 AM ET – Durable Goods Orders (June):
Signals demand for long-lasting goods, often driven by business spending.
8:30 AM ET – New Home Sales (June):
Follows existing home data for housing sector insight.
4:00 PM ET – Fed Chair Powell Speech at Jackson Hole:
Expect commentary on inflation, growth, and rate-path clarity.
⚠️ Disclaimer:
This content is for educational and informational purposes only and should not be construed as financial advice. Consult a licensed financial advisor before making investment decisions.
📌 #trading #stockmarket #economy #Fed #earnings #housing #durablegoods #JacksonHole #technicalanalysis
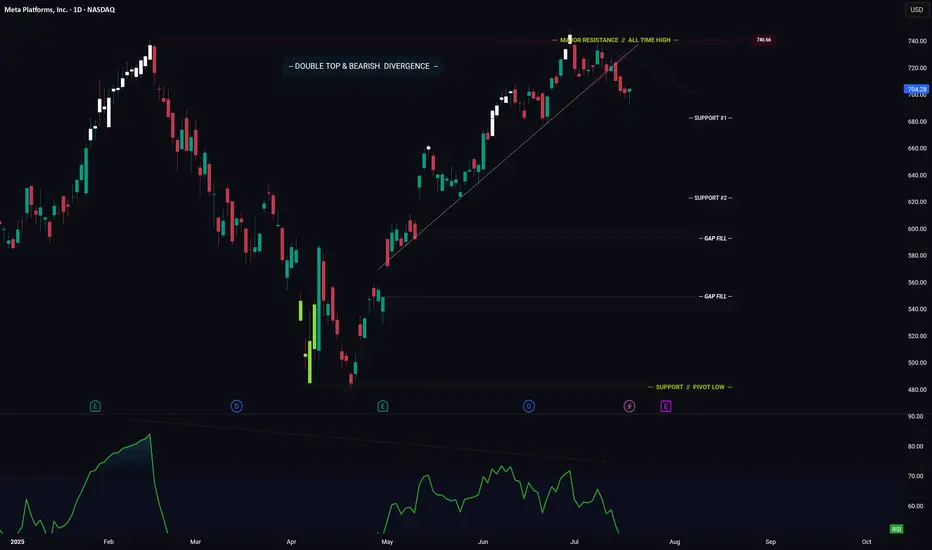
META -- Breakdown? Or Move Higher? Levels To Watch ForHello Traders!
Meta has broken down from its ascending trendline. This is bearish.
In addition price has formed a major Double Top pattern with Bearish Divergence.
Bearish Factors
1) Breakdown of ascending trendline
2) Double top
3) Bearish divergence
Two things need to happen if META is going to make a move higher...
1) Price needs to stay above "Support #1"
2) Price needs to break above the descending trendline (connecting the range highs)
IF price does breaks lower... where do we start looking for long positions?
- Support #2 is a great starting point, however if price makes it to support #2, then I could also see price trading down to fill the gap just below.
- This is where you could enter again to average down your position.
Thanks everyone and best of luck on your trading journey!
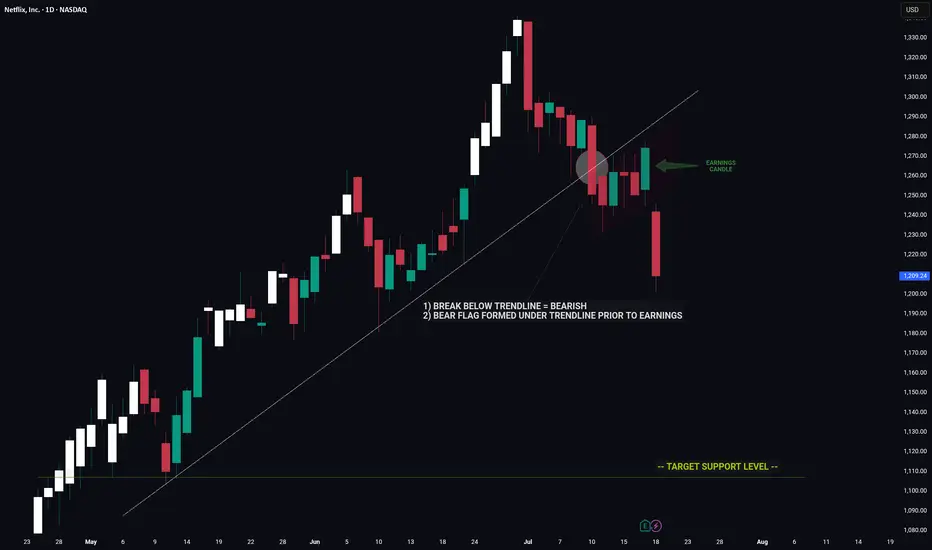
NETFLIX -- Price Signaled A Move Lower Prior To EarningsHello Traders!
The chart of NFLX is a great example of using clues to decipher a future move.
Prior to earnings we had major bearish indicators on the chart that hinted towards a move down on earnings.
1) Break below major trendline
2) Bear flag
These two signals by themselves are very bearish however the fact that these signals appeared coming into earnings was an even strong indicator of a potential for negative move.
Now that the upward trend is broken NFLX has a long way to fall before reaching the next key support level.
Thanks everyone and best of luck on your trading journey!
Nightly $SPY / $SPX Scenarios for July 19, 2025🔮 Nightly AMEX:SPY / SP:SPX Scenarios for July 19, 2025 🔮
🌍 Market-Moving News 🌍
🏢 U.S. Corp Buybacks Set to Propel Stocks
Citadel Securities expects U.S. companies to repurchase roughly $1 trillion of stock in 2025. With the blackout period ending in August, buybacks—historically strong in July, the stock market’s best month—could bolster valuations
⚖️ Fed Independence Debate Intensifies
President Trump’s continued criticism of Chair Powell has already weakened confidence in Federal Reserve autonomy. The fallout shows up in a weaker dollar, elevated Treasury yields, and rising inflation expectations—though stocks have remained resilient
🇺🇸 Immigration Rollback Sparks Economic Concern
The rescinding of Temporary Protected Status for ~900,000 immigrants could remove up to 1.1 million workers from the labor force. Analysts warn of potential stagflation risks, with GDP growth potentially down 0.3–0.4 percentage points and labor-market tightening ahead
💵 Massive T-Bill Issuance Incoming
Following the debt-ceiling deal, the Treasury plans over $1 trillion in T-bill issuance in the next 18 months. Money-market funds are expected to absorb much of it, influencing short-term rates and cash-market dynamics
📊 Key Data Releases & Events 📊
📅 Friday, July 19:
8:30 AM ET – Initial Jobless Claims
Weekly figure on new unemployment filings—a real-time indicator of labor-market resilience.
8:30 AM ET – Existing Home Sales (June)
Measures signed contracts on previously owned homes; key for gauging housing-market health.
All Day Events:
Ongoing corporate buybacks entering open window
Treasury auctions and T-bill issuance updates
⚠️ Disclaimer:
This information is for educational and informational purposes only and should not be construed as financial advice. Always consult a licensed financial advisor before making investment decisions.
📌 #trading #stockmarket #economy #monetarypolicy #debt #housing #labor #technicalanalysis
COIN (Update) -- Potential Max Price TargetHello Traders!
Coin seems to potentially have a little bit more steam left. If it does make one more push... where will price go?
At $429.54 we have the All Time High for COIN.. interesting enough that price was hit on the first day of trading for COIN which adds to the significance of this price level. There is also a trendline connected from pivot to pivot. These two factors converge and create a significant level of resistance.
Most likely I will be entering a short position at this level.
Thanks everyone and best of luck on your trading journey!

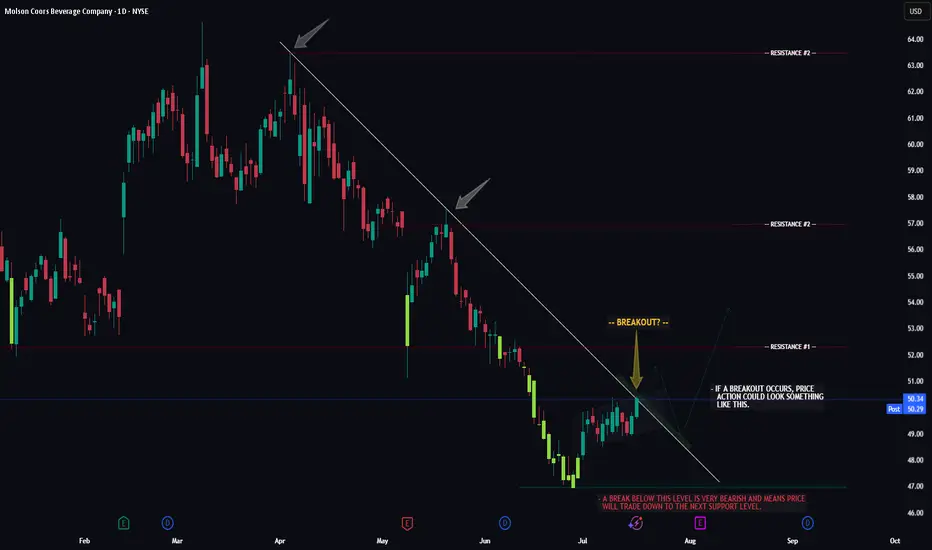
TAP -- Breakout Attempt -- Target LevelsHello Traders!
The chart of TAP (Molson Beer co.) is currently flirting with a major resistance trendline. Now whether or not price can successfully seal the deal and make it too third base remains to be seen.
If price does breakout, watch for a potential retrace to the breakout trendline first, then we could see the larger move to resistance level #1.
If price gets rejected and fails to breakout we could see a move below support before it attempts to breakout again.
Thanks everyone and best of luck with your trading journey!
Nightly $SPY / $SPX Scenarios for July 17, 2025🔮 Nightly AMEX:SPY / SP:SPX Scenarios for July 17, 2025 🔮
🌍 Market-Moving News 🌍
🇮🇳 India–U.S. Inflation Divergence Dampens Dollar
India’s June retail inflation tumbled to a six-year low, while U.S. CPI hit its fastest pace since February—driven by tariff effects. This divergence is weakening the U.S. dollar against the rupee, pushing down dollar‑rupee forward premiums
📜 Treasury to Ramp Up T-Bill Issuance
Following the recent debt-ceiling increase, the U.S. Treasury plans to issue over $1 trillion in T-bills over the next 18 months. Money-market funds, flush with cash, are expected to absorb the supply, which could influence short-dated yields
💱 Dollar Eases Amid Fed-Related Volatility
Headline news that President Trump “highly unlikely” to fire Fed Chair Powell, coupled with stable PPI data, calmed markets. The dollar dipped slightly after earlier turmoil, while gold and bonds saw modest gains
📊 Key Data Releases & Events 📊
📅 Thursday, July 17:
(No major U.S. economic releases)
Markets will track T-bill issuance plans, dollar forward dynamics, and statements from the Treasury and Fed regarding debt and rate strategy.
⚠️ Disclaimer:
This is for educational purposes only—not financial advice. Consult a licensed financial advisor before making investment decisions.
📌 #trading #stockmarket #economy #dollar #tbills #inflation #Fed #technicalanalysis
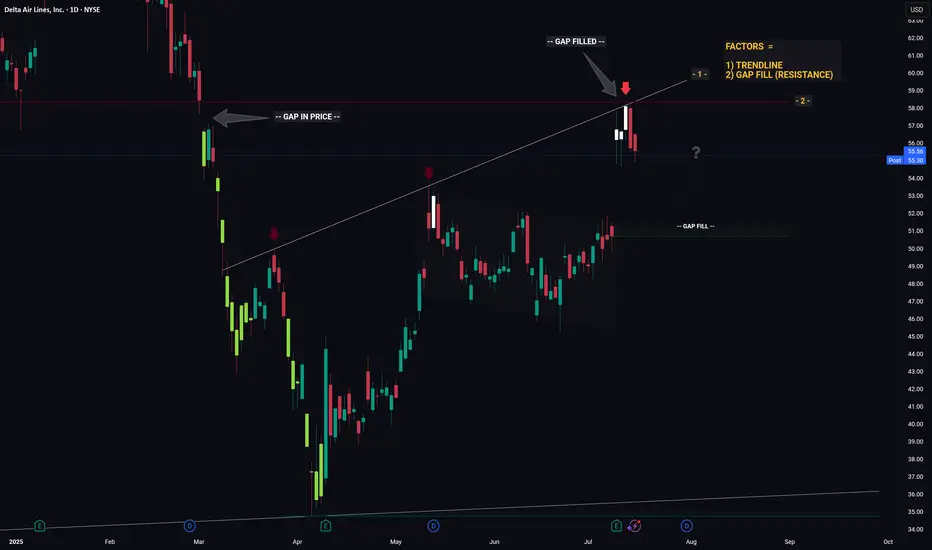
DELTA - Converging Levels Creates Huge Resistance - Retrace?Hello Traders!
Whichever Hedge Fund that is responsible for the recent price action in DELTA mustve been in a generous mood... because theyre giving us an excellent hint as to what price will likely do next.
And what hint might that be you ask...
1) Trendline (connecting the recent highs)
2) Gap Fill (Resistance)
Individually these factors are relatively strong, however when combined they essesntially create a strong barrier that will be very hard for price to break through. Think about it like a wall made from Captain Americas shield... now try and break through that.. aint gonna be easy.
So whats next for price? If I was a betting man (and I am, incase you were wondering) I would say theres a high probability that price is going to trade down from this resistance level then retrace to the gap fill below. From the gap fill level we will likely see a bounce.
Thanks, I hope you found this post educational or helpful and best of luck on your trading journey!
COIN -- Major Trendlines + Bearish Divergence = Breakdown?Hello Traders!
Today I have shared the chart of COINBASE. Of course we cant know for sure what price will do, however you can take clues and combine them to give you a high probability reading of the chart.
Here are the clues:
1) MAJOR TRENDLINE
2) TRENDLINE
3) BEARISH DIVERGENCE
4) BULL FLAG MEASURED MOVE
When we combine these clues, a very bearish picture is painted... This signals to me that there is a high probability price will likely reverse and trade to the downside in the near future.
I hope everyone enjoyed this post and is able to use it as an educational tool.
Thanks everyone and best of luck on your trading journey!
