Targets Are Solid,And Clear!In A Perfect Condition To The Targets If It Holds !Keep It Up Guys ,Don't Use More Than 3-4% Of Your Balance!
Good Lock!
Chartist

UNICORN 🦄 CHART MONTHLY GOLDEN CROSS🦄🦄🦄 CHARTIST THIS ONES FOR US !!! 🦄🦄🦄
I consider myself a Chartist when it comes to the stock market 📈. I’m always down for analyzing a chart. When the markets close on FRIDAY, I get to work and look at countless charts to find the setup I use to trade.
The market was giving great discounts for equities this week, but some get discouraged when the market is pulling back so here’s a canary in the coal mine.
I love trading GOLDEN CROSSES and can find them on DAILY TF (timeframe) and once in a while WEEKLY TF. This week I found a unicorn 🦄.
I FOUND A GOLDEN CROSS on a MONTHLY timeframe. I’ve analyzed at least 10,000 charts over the last 2 years and have never came across this.
Hope y’all enjoy


I've mostly stayed away from penny stocks in 2020 but......this looks so tempting. I've never really tested my custom alerts on penny stocks so we are going to see if it works on NASDAQ:SRNE .
Target price is $6.75+ according to the daily chart. I'm buying one option spread tomorrow (strangle to be specific) and that's it. It's a pure spec play and test. also, tiny position but i'm excited to see if it will work! I might be wishing I did more options in it.

Bullish signals for BYND. $144+ is the target priceNASDAQ:BYND
According to my analysis we should see a move up once it breaks out of this price channel. I see it in my crystal candles haha
I have my options and am ready for the move up! Anyone else in?

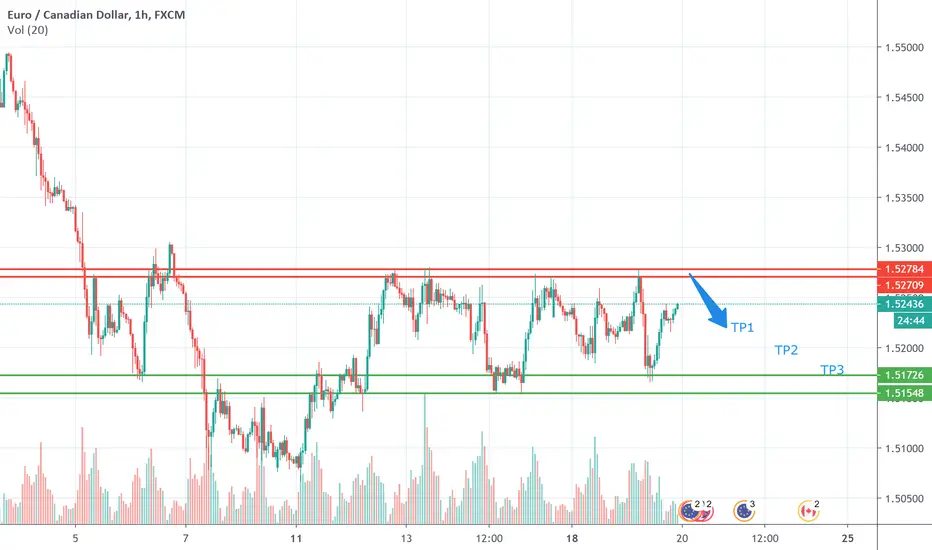
Min 50 pips targetHello Traders,
Hope you are enjoying the signals. Please LIKE and FOLLOW if you like my ideas.
CHART says ALL!!
Pair is approaching the Supply Zone. Wait for the price rejection in there.
TP1 is around 50 pips.
Based on your risk management, you can go for TP2 (60% possible)
TP3 (40% possible)
Disclaimer: Trading is all about probability. Do your own Risk management before opening the position.
Bullish signals on AAXN for $81NASDAQ:AAXN
There are two fairly strong signals on AAXN. My first target is $77.50 then second target is $81. Got in some call options just before closing bell today 5/15. It may dip a little more before jumping up to $81+


US OIL BUY 240-15 MIN LONGpivot on the 240 min old trend line, doble floor chart pattern and break the trend line on 15 min , time to buy, be carefull and happy trades ;)


USDCHF H4 ShortHere we go with dollar :)
if the zone does not work, we have next zone that is really strong
All depends on dollar index
Also be careful about news on the way

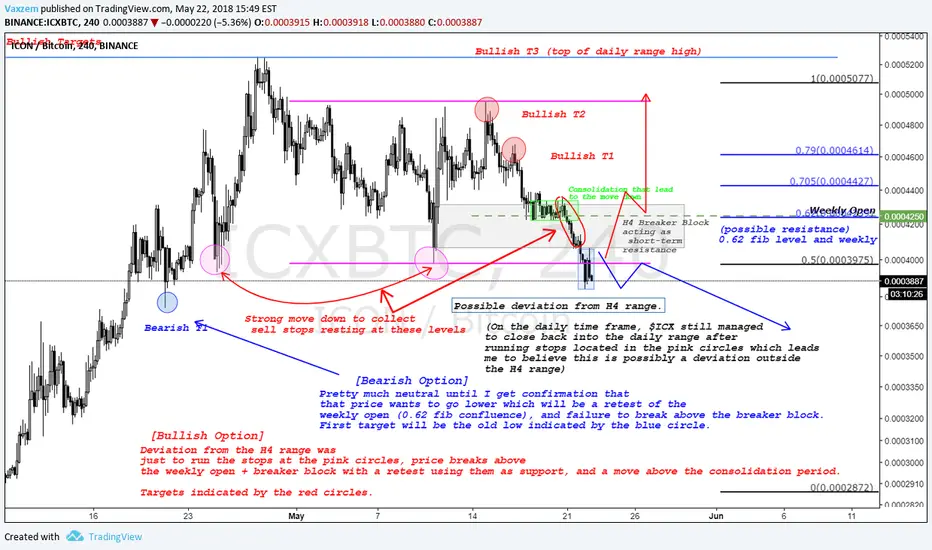
Bitcoin // CME open window // Possible double bottomHello,
Looking at the daily chart for BTC, the price has broken below 10k. In my previous analysis, I had $10220 - $10000 as a short term buy day trading range, which was a nice couple of days of trading up to 11k. Now that we have broken below it, we can begin looking at the ranges for a nice Long position.
On July 2nd, 2019 Bitcoin printed a bullish hammer near $9700. I doubt we will bounce off this price if we continue dipping, but I am keeping it in mind in any case. The next important price I am looking at is $9000. On June 18th, 2019 Bitcoin bounced from $9000 to $13800-ish. It is here that we also see a similar bounce on July 17th, 2019.
Many are speculating that we must close an open window (close the gap) in the CME Futures chart. That window is between $8985 & $8515. However, the prices on CME trade at a higher/lower premium more often than not. So finding a good spot price on the exchange you use is important.
Which brings me to the point of this idea. For the next couple of days, the bottom of the bull flag we are currently in is nearly exact to the bounce on June 18th & July 17th. If we are to dip near this range, we will be printing a bullish double bottom, in a bullish flag, near the upward trendline, near the open CME window. It is my belief, through TA, that a good spot price is at $8985 - $9100. Even IF we dip to $8515 as a spot, it is still a fairly good & safe entry point because nonetheless, we are going to the moon.
Please comment and like, thank you. May the force be with you.
- B

AUD/JPY BUY 15M Simple yet effective! Strong support for this pair as AUD/JPY hits 75.5 mark. Buy at market - intraday trade.
Quick and efficient signals at t.me

Possible long scenario if resistance is broken.Upon breaking out of the falling wedge, price has create what seems to be a flat top triangle. One may trade the upswings or the breakout of the triangle

A fight between bulls and bears. Alot of uncertainty.Here is an interesting turn of events. Firstly we can see a possible bullish flag(bearish channel). The next thing we can see is a possible head and shoulder formation. And lastly we can see that price has create an ascending trend-line. Wait for a clear break and retest or either the bullish flag or the head and shoulder and trade accordingly.

Possible head and shoulder patternPrice recently broke out of a bearish flag(bearish channel). Will be on the lookout to long this pair if price retraces back to the recent broken support/resistance level.

GBP/USD 600+ PIP TRADE! 1/4 Risk Reward! D1 TimeframeExpecting a breakout, take an aggressive entry now to catch a 600+ Pip move or wait for a more conservative entry after the breakout and retest.

How is $EVX Chart Looks Like Right Now? Accumulation is Here!Lots of charts are look like this but EVX definitely the one you need to consider. Why?
1. Still ranked #408 on coinmarketcap with only 25 mils total supply with 16.5 mils are on the circulating.
2. Listed on Binance, OKEx and Huobi. Listed on Big exchanges allow more volume to come as the exposure getting bigger when more listings are coming.
3. Not much pumped at the current price, which mean, the whale probably on accumulating phase right now so they/he/she don't want something obvious happen to the market. You can think like them and accumulate too.
4. Active social interactions, updates and good team. This project pretty much alive which is one of the best reason among many reason why you should or shouldn't bought a coin or token.
5. Chart looks quite bottom as the bottom is also the same support with the recent lowest of all time.
6. RSI level ranging and the trend line that need to be break is getting closer. It's just about time.
Trade safe!

Long opportunity CADJPYThe graph shows us a recently formed bullish flag pattern.
It seems like the market could find support at the rising trend line and support zone as shown in the chart.
The support zone at the 85.50 price level has been tested several times and the rising trend line has held up twice already.
These factors combined gives us the expectation of a price increase in the medium term direction.

USDCAD Descending ChannelThe bottom line of the channel and the 1.272 Fibonacci extension level form a nice technical confluence and could give us support. There's upside potential for this pair. It seems like the channel will be invalidated or the price of the USDCAD will rise.

A wedge, which when breaking generates a bullish projection.Two purchase signals with the ichimoku indicator, an ascending wedge that projects the 31 usd when breaking, and the koncorde indicating the interest on the part of institutional ones. Draw your own conclusions about it. twitter: @charly1030284

AUDUSD BEARISH FLAG POTENTIALGOOD DAY BLESSED PEOPLE !!
HERE IS MY ANALYSIS ABOUT AUDUSD.
I see POTENTIAL BEARISH FLAG in this pairs, i wish there is no higher high again (make poin 5 and 6).
AUDUSD SHORT
ENTRY : 0.76400
SL : 0.77450
TP1 : 0.75400
TP2 : 0.733450
TP3: 0.71600
LONG TP :0.68800
NOTE:
1. I'm a SWING TRADER so for all the analysis I made, took more time for the result.
2. Trade safe, u dont need to follow my TP, take your profit as long as u want.
3. Always move your SL above profit, there is no reason to risk capital.
Disclaimer : this is my trading anlysis, it is not an invite or recommendation to trade.
