Let`s play some pokkerThere`s a pattern ;) So why not..
There`s room to grow min till pre-earnings
Trade safe!
Chart Patterns

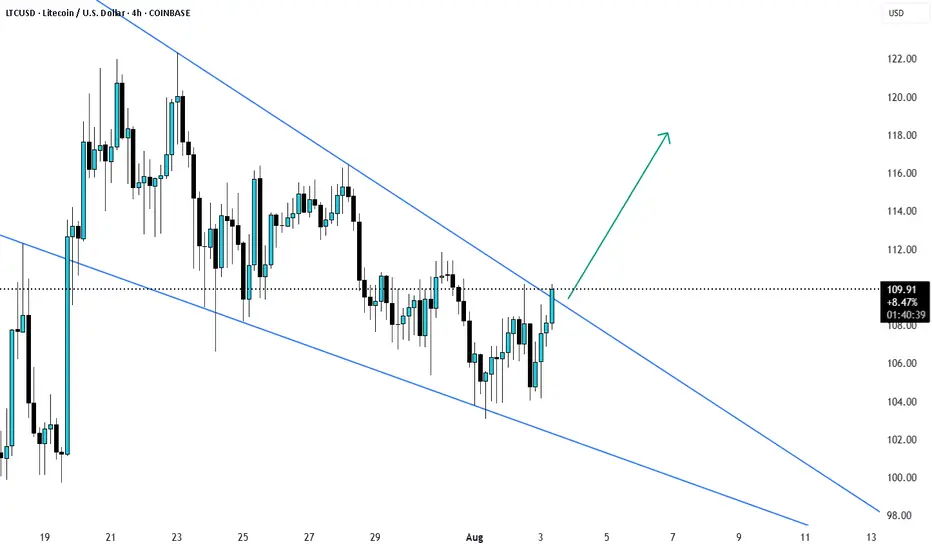
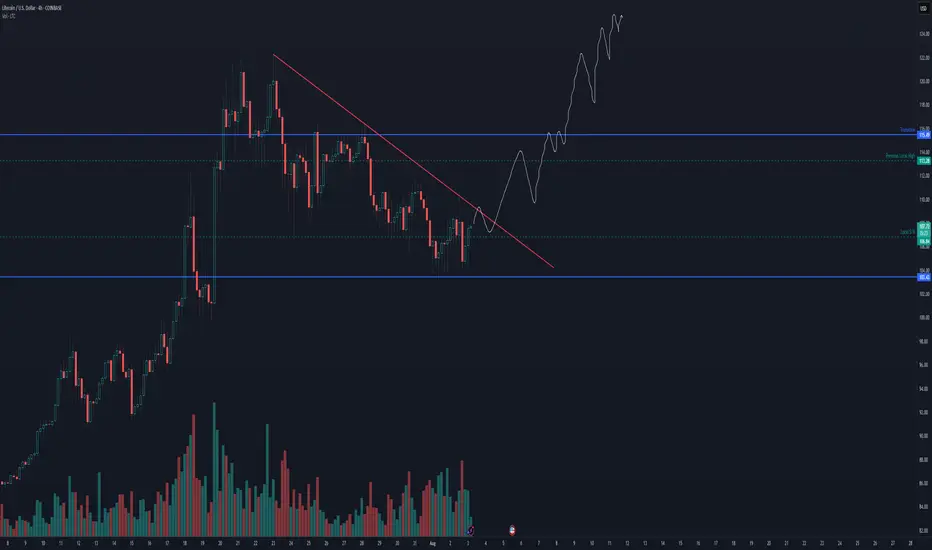
LTCUSD Breakout? wait for candle to closeLTCUSD trading in a down trend has now broken the resistance and wait till the candle is closed and possibly retest and then enter the trade. target can be 118-120
XAGUSD--SHORT--02-08.25--looking at multime-frame (M,W), short term great short opportunity
--entry around 37.52854 and 37.32500, TP is 35.267

LONG WEEKLY ANALYSIS. USDCHF USDCHF may be starting a bullish reversal on the weekly chart. RSI shows bullish divergence (price made a lower low, but RSI made a higher low).
Stochastic RSI also supports the move up.
Next major resistance is near 0.8600 area
Wait for a retest in the next coming days before entering any long positions for better confirmation .
do not jump into long position right now !!! (It is a weekly chart) ,be patient ,the price may go down before reversing to the upside .

GBP/CAD - H4 - Bearish Flag (26.07.2025)The GBP/CAD Pair on the H4 timeframe presents a Potential Selling Opportunity due to a recent Formation of a Bearish Flag Pattern. This suggests a shift in momentum towards the downside in the coming Days.
Possible Short Trade:
Entry: Consider Entering A Short Position around Trendline Of The Pattern.
Target Levels:
1st Support – 1.8242
2nd Support – 1.8139
🎁 Please hit the like button and
🎁 Leave a comment to support for My Post !
Your likes and comments are incredibly motivating and will encourage me to share more analysis with you.
Best Regards, KABHI_TA_TRADING
Thank you.
Disclosure: I am part of Trade Nation's Influencer program and receive a monthly fee for using their TradingView charts in my analysis.

Could this be the end of Bitcoin’s trend?The Current State of Bitcoin’s Trend: Has the Uptrend Come to an End...?
Based on recent analyses, Bitcoin has exited its 4-hour channel over the past few days, and there is still a possibility for further correction. However, this does not mean that the uptrend for Bitcoin is over.
My targets for Bitcoin remain the same as before: 123,700 and 129,710. It’s even possible that we might see a wick above these prices.
For those with more capital who are looking to buy Bitcoin, there are two good entry levels:
110,880
109,770
Everything else is clearly shown on the chart. Please be cautious, as there will likely be high volatility once the market opens.
Be sure to open the analysis link and boost the analysis with your likes.

Solana Update · Retrace, Bears & The Bullish BiasSolana had a retrace in May. Notice the 19-May date on the chart. This retrace produced four weeks red. The bullish move that led to this retrace lasted 6 weeks. The last rise lasted five weeks and the current retrace might last only two weeks, can be less.
We are seeing Solana rising but this rise is not a one-time off event, this is a trend that is developing. An uptrend as a long-term phenomena is different to a short-term bullish moves. A short-term move tends to be really fast, one strong burst and that's it. A long-term move is different. Instead of seeing 2-3 candles and Solana trading at $1,000, we see dozens and dozens of candles with prices slowly rising. There are strong fluctuations but the end result is always up. And that's how you see the fluctuations on the chart.
Solana moved up and then immediately started to retrace. Then another rise and another retrace again. This retrace will end and prices will continue to grow long-term. The bulls are in. The bull market is on. Solana, Bitcoin, Crypto and the rest of the Altcoins market is going up.
Namaste.

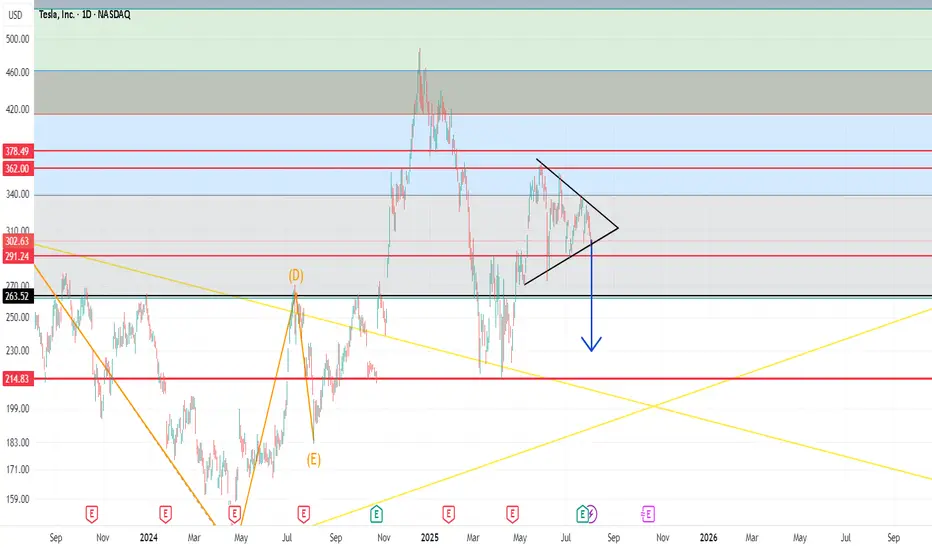
Bearish Triangle: TSLAWaiting for TSLA to breakout 292 to form a bearish triangle pattern.
Target price: 22X
BTCUSD The Week Ahead Key Support and Resistance Levels
Resistance Level 1: 119,000
Resistance Level 2: 121,030
Resistance Level 3: 122,862
Support Level 1: 111,683
Support Level 2: 110,450
Support Level 3: 108,720
This communication is for informational purposes only and should not be viewed as any form of recommendation as to a particular course of action or as investment advice. It is not intended as an offer or solicitation for the purchase or sale of any financial instrument or as an official confirmation of any transaction. Opinions, estimates and assumptions expressed herein are made as of the date of this communication and are subject to change without notice. This communication has been prepared based upon information, including market prices, data and other information, believed to be reliable; however, Trade Nation does not warrant its completeness or accuracy. All market prices and market data contained in or attached to this communication are indicative and subject to change without notice.

BTC NEW LOOKBtcusd sell from 115,000
Target1 114,000
Target2 112,000
Target3 110,000
Stope Lose 116,500
TRADE AT YOUR OWN RISK

US500: Rebound Setup After Sharp Pullback – Key Support HoldingUS500 has experienced a strong corrective move after an extended bullish run but is now showing signs of stabilizing near a key support area. This zone aligns with both technical retracement levels and the market's reaction to fundamental shifts—particularly the dovish repricing of the Fed following weak US jobs data.
Technical Analysis (4H Chart)
Pattern: After a strong uptrend, price faced a steep correction, forming a potential short-term reversal setup.
Current Level: 6,235, holding above the 6,217 support zone.
Key Support Levels:
6,217 (immediate support; key defense zone for bulls).
6,171 (38.2% retracement, secondary support if deeper pullback occurs).
Resistance Levels:
6,272 (23.6% retracement and initial resistance).
6,360 (upper resistance zone and retest of recent breakdown).
6,429/6,436 (recent high and target if bullish momentum resumes).
Projection: A rebound from current levels could push US500 back toward 6,360–6,430 if support holds.
Fundamental Analysis
Bias: Neutral-to-bullish as macro drivers favor a recovery from pullback.
Key Fundamentals:
Fed Policy: Weak US jobs (+73K) and downward revisions have solidified rate cut expectations (~75% probability in September), boosting equity sentiment.
Inflation: Market awaits US CPI; softer data would further support equities.
Tariffs: While Trump’s tariffs create a medium-term risk for earnings, immediate Fed easing bets outweigh these concerns.
Risk Sentiment: Global risk remains supported by lower yields and optimism about Fed easing.
Risks:
Hot US CPI could reverse cut expectations, pressuring equities.
Geopolitical risks or tariff escalation could trigger renewed selling.
Key Events:
US CPI and PPI.
Fed speeches and rate expectations.
Earnings reports from key US companies.
Leader/Lagger Dynamics
US500 is a leader, driving global risk sentiment and influencing risk-sensitive assets like AUD/USD, NZD/USD, and JPY crosses.
Summary: Bias and Watchpoints
US500 is neutral-to-bullish, stabilizing at key support (6,217) after a sharp correction. Fed cut expectations and risk-on sentiment support the upside scenario, targeting 6,360–6,430 if US CPI aligns with softer inflation. However, a hot CPI print could invalidate this rebound and trigger another leg lower.

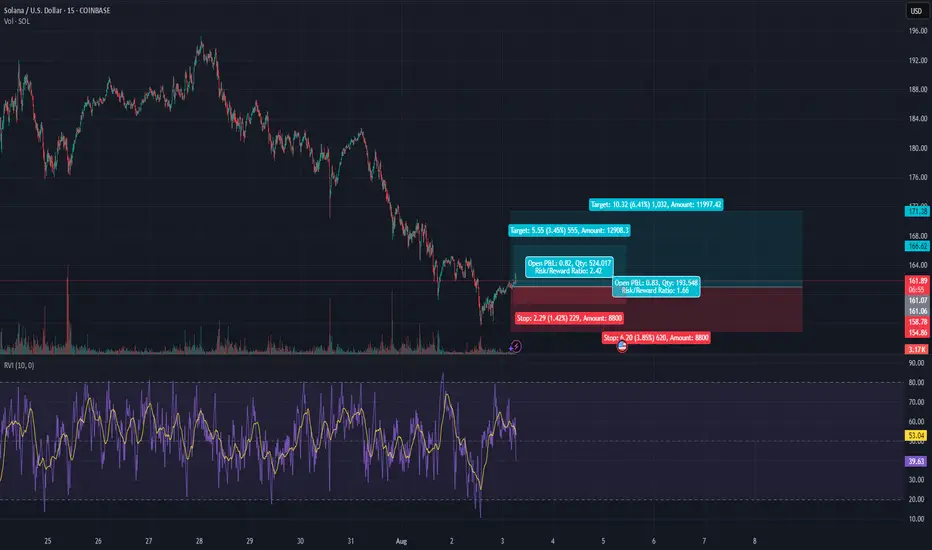
SOL 15m Ready to Rumble? Possible Double Setup!Two decent setups on Solana’s 15m, one bounce play off key support, the other a breakout rip targeting quant resistance.
Setup #1 — Mean Reversion Long:
• Entry: 161 to 162
• Stop: 158.78 (sits on quant S1 = 158.67)
• Target: 166.62
• R/R: 2.4x
This setup rides the bounce from support that matches pivot S1. Confirm with candle wick + volume punch.
Setup #2 — Breakout Continuation:
• Entry: Above 166.62
• Stop: 164 (tight) or 154.86 (sits above quant S2 = 153.41)
• Target 1: 171.38 (just under quant R1 = 172.46)
• Target 2: 180.99 (quant R2 if price rips)
• R/R: 1.6x to 3.4x
Break needs volume. R1 is the battlefield. If we nuke through, R2’s next.
Quant Levels to monitor:
• Support:
S1 = 158.67
S2 = 153.41
• Resistance:
R1 = 172.46
R2 = 180.99
R3 = 186.25
Daily ATR ~11 pts — volatility is favorable
Structure and confluence are clean. Execution depends on price confirmation.
EURAUD Short From Resistance!
HI,Traders !
#EURAUD keeps growing
In an uptrend but the pair
Will soon hit a horizontal
Resistance of 1.79647 from
Where we will be expecting
A local bearish pullback
And a further move down !
Comment and subscribe to help us grow !

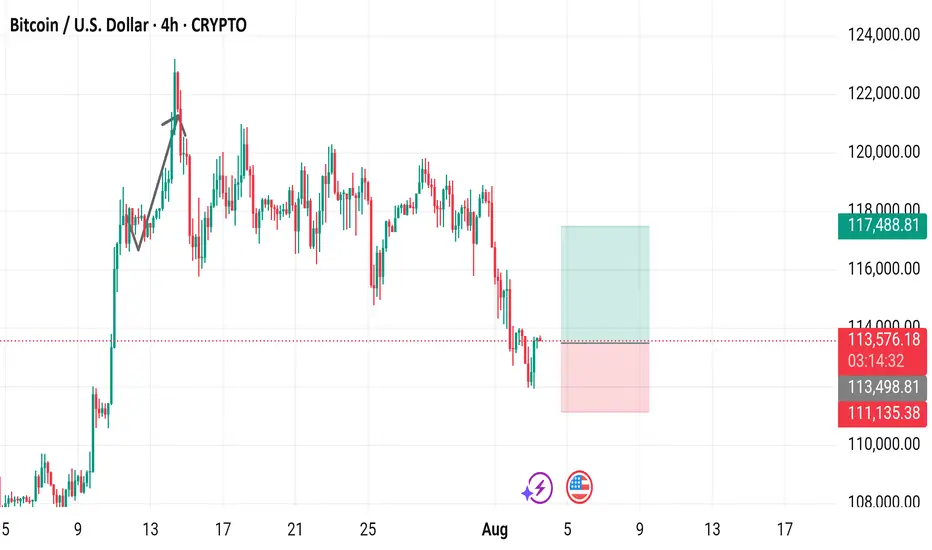
Bitcoin / U.S. Dollar 4-Hour Chart (BTCUSD)4-hour chart displays the price movement of Bitcoin (BTC) against the U.S. Dollar (USD) from late July to August 3, 2025. The current price is $113,570.31, with a 24-hour change of +$1,064.77 (+0.95%). The chart shows a recent upward trend followed by a sharp decline, with key levels marked at $113,570.31 (buy/sell price) and $111,135.38 (support level). The trading volume and price range are highlighted, with a notable drop below the $113,570.31 level as of 03:16:00 on the chart.
BTC Trade Plan 03/08/2025 - where to buy BTC?Dear Trader,
Bitcoin's price is currently moving within a double channel, with the midline of the channel around 108,000. The first scenario is that the price reaches the midline of the channel and then starts an upward movement. The second scenario involves a sharp downward move towards a stop hunt target around 97,000-100,000. In both cases, as long as the price remains above the 100822 level(Daily Close), the bullish trend will continue.
Regards,
Alireza!

SOLUSD- Has a long-term sport between 155 and 158Technical Analysis by AI
💵 Current Price & Market Context
• SOL trading around $158–$160, down about 2–3% today, still down ~14% from last week’s top near $180+.
🧭 Trend & Momentum
• RSI near 41–47 → not oversold but on the lower side.
• MACD still leaning bearish. Momentum: neutral to slightly bullish across indicators.
🛠️ Support & Resistance
• Immediate support at $160, stronger support at $154.
• Resistance at $172–$176, bigger barrier around $180–$190.
📈 Pattern Behavior
• Still holding an ascending channel, currently sitting near the lower band.
• Failed breakout at $180–$190 means that’s a hard ceiling unless broader market turns bullish.
⸻
✅ Trade Thoughts Based on This
Aspect
Bias Neutral to bearish short-term
Entry Zone Valid? Yes, $156–158 is still solid
Key Level to Watch
$154 — if breaks, downside likely
Upside Potential Target $172–176 short term
Breakout Ceiling $180+ tough without volume/sentiment
⸻
🧭 What You Should Do Now
• You’re in near $156–158 → good spot as long as $154 holds
• If price dips to $154 and bounces: still valid
• If breaks $154: prepare to cut, next support is ~$145
• If price moves above $170: momentum could take it to $176+
• Don’t chase anything. Wait for volume or bounce from support

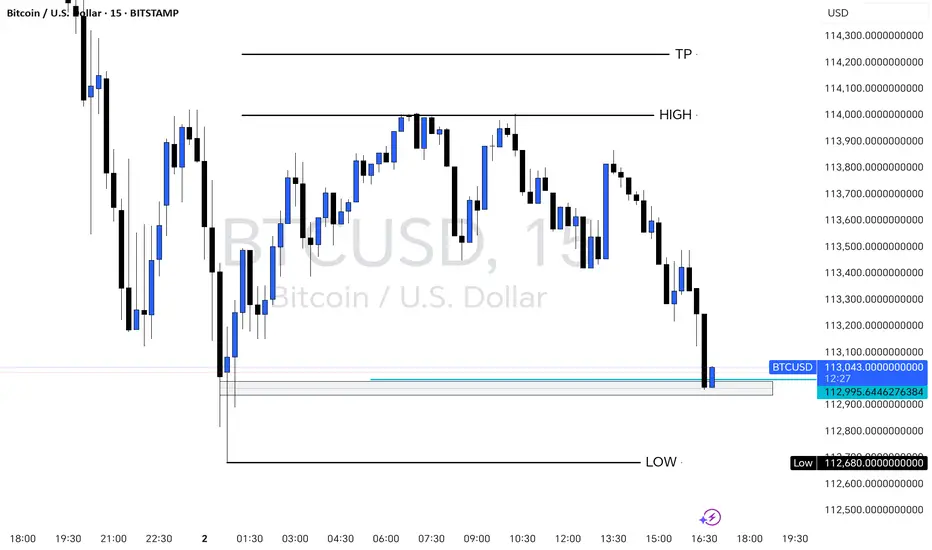
BITCOIN 15-Min Chart – Key Support Retest with Bullish PotentialThis 15-minute BTCUSD chart shows Bitcoin retesting a strong support zone near $112,680 after a clear downward move. The price is currently reacting at a previous demand area, marked in blue, just above the session’s LOW. A possible bullish reversal setup is forming if the support holds, targeting the previous HIGH around $114,000 and a potential TP at $114,200. Traders may look for confirmation signals (e.g., bullish engulfing, order block reaction) before entering long positions.
XAUUSD Technical AnalysisTechnical Analysis – Symmetrical Triangle with Retest
Current Market Situation
The chart shows a symmetrical triangle pattern, which is a continuation pattern often followed by strong directional movement.
The price has broken below the triangle, signaling a potential bearish move.
Currently, the price is in the retest phase of the broken triangle, which is an important area to confirm the bearish trend before continuing downward.
Key Zones
Retest Zone (Pullback): Located between current price and 3,374, which is a strong resistance area.
Targets (TP):
TP1: 3,322.97
TP2: 3,285.87
TP3: 3,262.59
Possible Scenarios
✅ Bearish Scenario (Preferred):
If the price holds below the retest zone, we expect a continuation to the downside towards:
Target 1: 3,322.97
Target 2: 3,285.87
Target 3: 3,262.59
⚠ Bullish Scenario (Alternative):
A daily close above 3,374 will invalidate the bearish scenario and may trigger a reversal.
Conclusion
The market shows a strong technical indication of a bearish continuation after confirming the retest.
Any daily close above 3,374 would cancel the bearish scenario.
It is recommended to monitor price action closely in the retest zone for confirmation before entering trades.

Buy usdjpyOur last buying idea already running 500+ pips in buying
Now more buy expected after a lil more retracment

USDCAD Will Go Down! Short!
Take a look at our analysis for USDCAD.
Time Frame: 1D
Current Trend: Bearish
Sentiment: Overbought (based on 7-period RSI)
Forecast: Bearish
The price is testing a key resistance 1.378.
Taking into consideration the current market trend & overbought RSI, chances will be high to see a bearish movement to the downside at least to 1.362 level.
P.S
The term oversold refers to a condition where an asset has traded lower in price and has the potential for a price bounce.
Overbought refers to market scenarios where the instrument is traded considerably higher than its fair value. Overvaluation is caused by market sentiments when there is positive news.
Disclosure: I am part of Trade Nation's Influencer program and receive a monthly fee for using their TradingView charts in my analysis.
Like and subscribe and comment my ideas if you enjoy them!

Litecoin is about to begin a leg upLitecoin is about to begin its first expansion. Alt season seems to be well underway and mid caps like LTC are next on the docket for money flow.
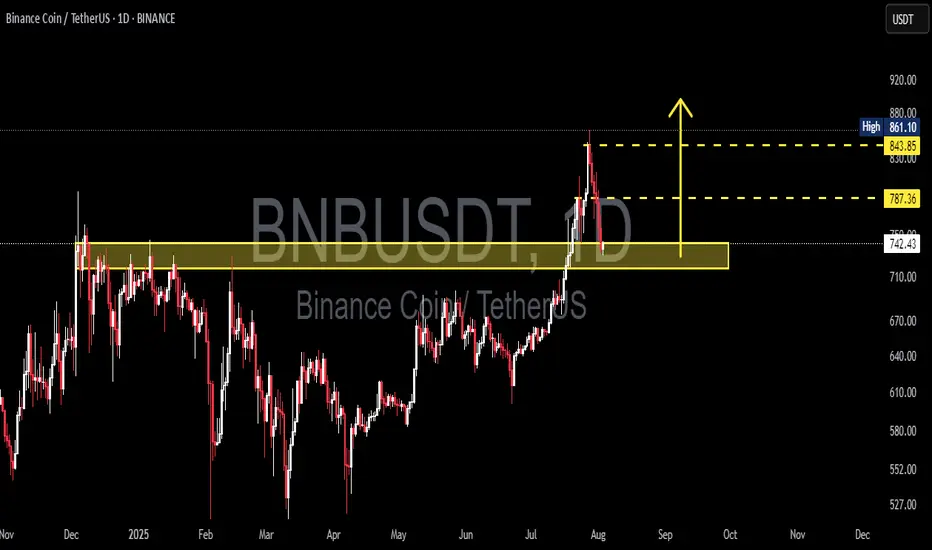
BNBUSDT Critical Retest in Progress📊 Comprehensive Analysis:
BNB/USDT has finally managed to break out of a major consolidation range that lasted over 6 months, with the key resistance zone between $730 and $750 acting as a strong ceiling since late 2024.
The breakout in late July 2025 was supported by a noticeable increase in volume, signaling strong accumulation and a possible shift from a ranging market to a bullish trend.
Now, the price is revisiting this previous resistance — a crucial retest zone that will likely determine whether this move is sustainable or a potential bull trap.
---
🔍 Key Price Levels Identified:
🟡 Retest Support Zone (Previous Resistance):
$730 – $750 → A critical area that must hold to maintain the bullish market structure.
🟡 Minor Resistance:
$787.36 → Recently rejected, this is the next short-term barrier that bulls must break.
🟡 Major Resistance (Swing High):
$843.85 → Key historical level before reaching the recent local high.
🔵 Recent Local High (Potential Double Top or Breakout):
$861.10 → A break above this level could open the doors to fresh highs.
---
✅ Bullish Scenario:
If BNB holds above the $742.36 level and prints a strong bullish reversal candle (e.g., pin bar or bullish engulfing), the retest can be considered successful.
Next upside targets:
🎯 $787.36 → Immediate resistance
🎯 $843.85 → Key swing high
🎯 $861.10 → Local high
🎯 $900 psychological level → If momentum and volume persist
Look for decreasing volume during retracement and surging volume on breakout to confirm bullish continuation.
---
❌ Bearish Scenario:
If the price fails to hold above $742.36 and breaks down below $730, this may confirm a false breakout (bull trap).
Downside targets could include:
⚠️ $710 – $690 → Minor demand zone
⚠️ $660 – $640 → Historical support within the previous range
A bearish confirmation would come from a lower high formation followed by a strong bearish breakdown candle with increasing volume.
---
📈 Chart Pattern & Price Structure:
The breakout indicates a bullish continuation pattern.
Potential formation of a Bullish Flag or an Ascending Channel, if support holds and consolidation continues above $740.
No major signs of distribution yet — the structure remains healthy and bullish.
---
🧠 Strategic Summary:
> The market has shown strong bullish intent, but it is now at a critical retest phase. Holding this zone could ignite the next leg up. Failure to do so, however, may signal a reversal or deeper correction.
For swing traders, the $730–$750 zone is a golden pocket for potential entries with tight risk management. For conservative traders, a confirmed breakout above $787–$843 offers a safer opportunity.
#BNBUSDT #BNBAnalysis #CryptoBreakout #Altcoins #TechnicalAnalysis #PriceAction #SupportResistance #BullishScenario #BearishScenario #CryptoTrading #BinanceCoin #SwingTrading
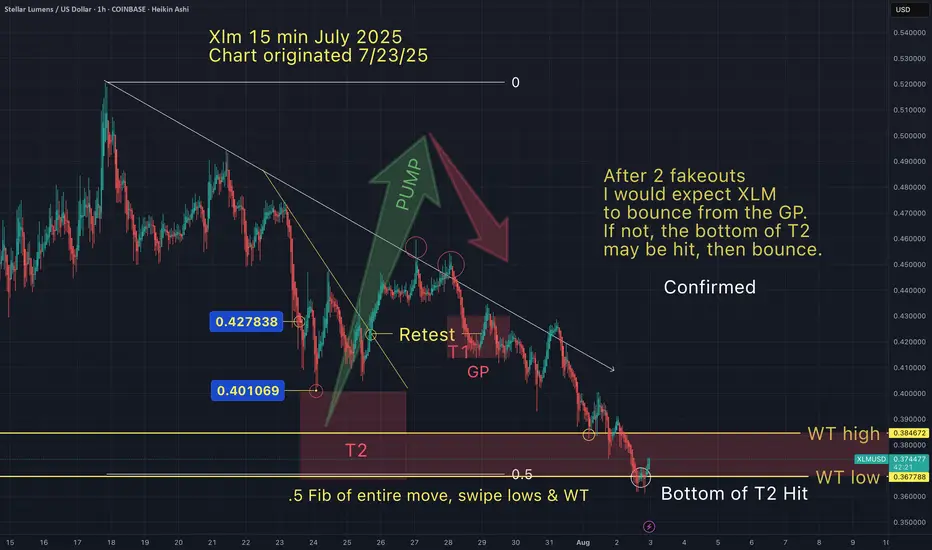
Xlm- The wait for Target 2 is over.After a 30% dump. We have arrived.
I hope my T3 doesn't get hit, but if it does, I'll be ready to sweep up the blood in the streets.
May the trends be with you.