Telusdt Buy opportunitySpotted a potential ascending formation with price currently developing a mini bullish flag. This structure suggests an underlying accumulation phase ahead of a potential breakout.
The strategic focus is the Buy Back Zone, a key area for strong accumulation entries. Targets are clearly mapped on the chart, with 0.009896 as the first short-term objective, followed by 0.061317.
The final critical area to monitor is the Crucial Resistance Zone, acting as the neckline of the entire setup—its breakout will confirm a long-term structural shift. Watching closely for sustained momentum.
Chart Patterns

MDT (SPOT)BINANCE:MDTUSDT
#MDT/ USDT
Entry range (0.01350- 0.01480)
SL 4H close below 0.01251
T1 0.01900
T2 0.02200
T3 0.02438
_______________________________________________________
Golden Advices.
********************
* collect the coin slowly in the entry range.
* Please calculate your losses before the entry.
* Do not enter any trade you find it not suitable for you.
* No FOMO - No Rush , it is a long journey.

Long ENAbuy at monthly open range 0.3-0.4 btw
RSI sLH
Strong fundamental coin
wait and accumulate
last Chance buy now Lock in DYOR

daily BTC analysis Bitcoin breaks the $115,000 level and approaches $112,000. Personally, I expect this level to be unsustainable and the next level is $110,000. This analysis is not financial advice in any way.Crypto Futures Trading Could Destroy All Your Money

US30 Swing Short!
HI,Traders !
#US30 keeps falling down
And the index broke the
Key wide horizontal level
Around 43924.6 which is now
A resistance and the breakout
Is confirmed so we are very
Bearish biased and we will
Be expecting a bearish
Continuation on Monday !
Comment and subscribe to help us grow !

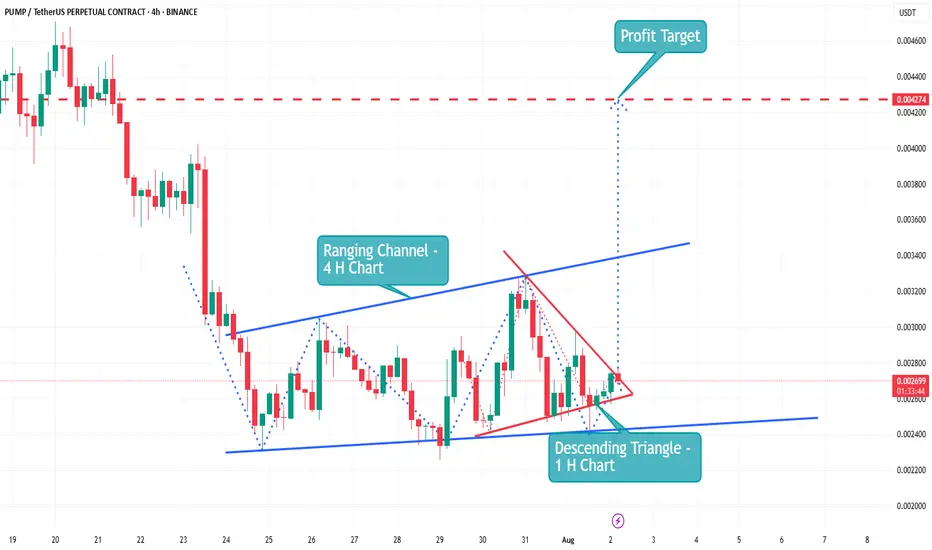
The Pump coin is now showing an upward trend | Live AnalysisPump ▶️
The Pump coin has now touched its All Time Low.🕯
The coin is now showing an upward trend.👀
🛫 a Descending Triangle is currently forming a breakout on the 1H chart.
🛫 Making a Ranging Channel on the 4 H Char
🛫 Make A CHoCH (1H)
🛫 Bullish OB (1H)
🛫 Buy Tag (1 H)
🛫 Making Golden Cross (1 H

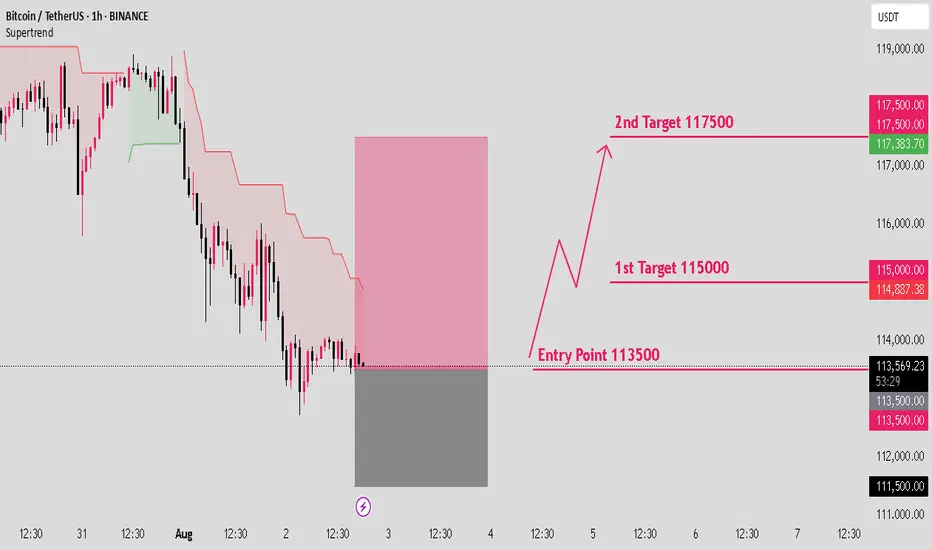
BTCUSD long setup: Targeting the next bull move.Hello IGT FOLLOWERS
Here is my BTCUSD overview, Bitcoin is showing bullish momentum after holding strong support near $112,000. A breakout above the $115000 resistance suggests buyers are regaining control. RSI is turning upward, and volume is increasing on green candles signaling demand. As long as price holds above $113,000, bulls may push toward the $117,500 target.
Key points :
Entry point : 113500
1st Target : 115000
2nd Target : 117500
Follow me for more latest updates and signals
Ethusd $2500 I suspect may be the last dipTechnical analysis on ethusd .
Whilst everyone is bullish from current level, my technicals is telling me $2500 region which is key for upward movement or a break makes it want to go lowet

Asian Paints Forming a W pattern looks bullish above 2613Asian Paints is showing a bullish reversal setup with a clear W pattern (Double Bottom) forming on the daily chart. The stock has tested the ₹2500 support zone twice and bounced, indicating strong buying interest. It is now approaching the neckline at ₹2600, a critical breakout level.
A sustained move above ₹2613, especially with good volume, could confirm the breakout and push prices toward the ₹2675–₹2700 zone, with a possible extension toward ₹2735. This setup provides a favorable risk-reward opportunity.
Trading Plan:
• Entry: Above ₹2613 on confirmation
• Stop Loss: ₹2580 (conservative) or ₹2560 (aggressive)
• Target: ₹2675–₹2700 (initial), ₹2735+ (extension)
Why it matters:
• Strong base at ₹2550 zone
• W pattern signaling reversal
• Breakout potential on good volume
This is a price-action-based setup, supported by pattern structure. Keep an eye on volume and market sentiment for confirmation and Ofcourse Nifty 50 needs to be bullish
Let me know your thoughts in comments
🔔 This is not financial advice. Please do your own analysis before taking any trade.

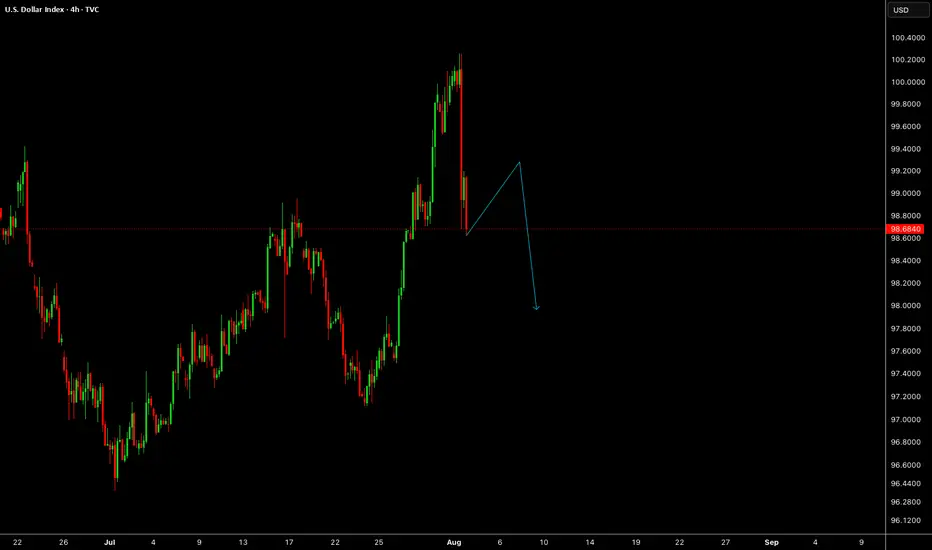
DXYDXY has given us a drop last week, lets wait for a correction to trade another drop.
Disclosure: We are part of Trade Nation's Influencer program and receive a monthly fee for using their TradingView charts in our analysis.
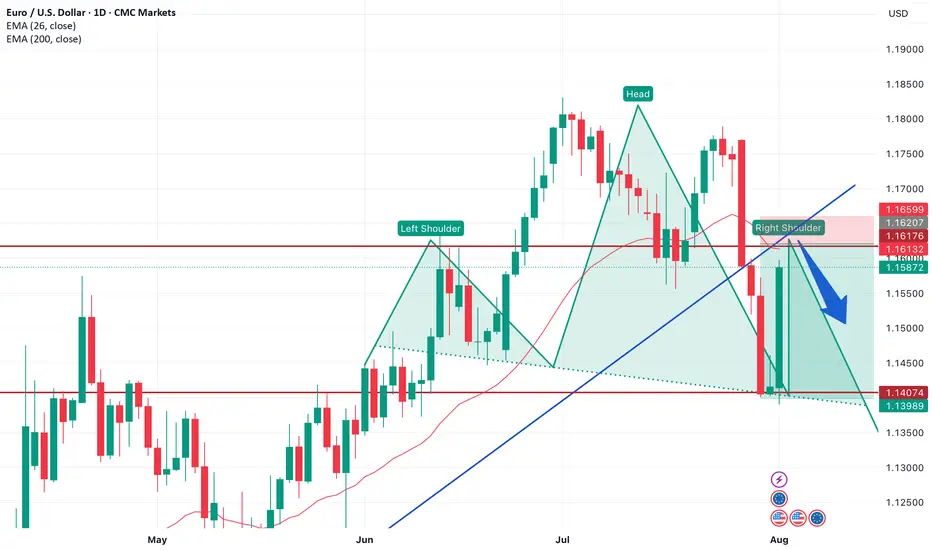
Looking for sellI have analysis for shorting this pair. Let's break down my reasons and see if we can confirm them:
1. **Broken Trendline**: the blue trendline has been broken and that the price attempted to retrace back to it. A broken trendline can indicate a shift in market sentiment. If the price indeed retraces to the trendline and shows signs of rejection (like forming a bearish candlestick pattern), it could reinforce my bearish outlook.
2. **Head and Shoulders Pattern**: The head and shoulders pattern is a classic bearish reversal pattern. If the pattern is forming and the price is approaching the neckline, a break below this level could lead to a significant downward move. It's essential to ensure that the volume supports this pattern's validity, as higher volume on the breakout can strengthen the signal.
3. **EMA 26 Interaction**: The exponential moving average (EMA) can act as a dynamic resistance or support level. If the price is approaching the EMA 26 and has historically rejected there, it could serve as a potential area to look for short entries. Watching for bearish candlestick patterns or signs of weakness around this EMA can help confirm my trade.
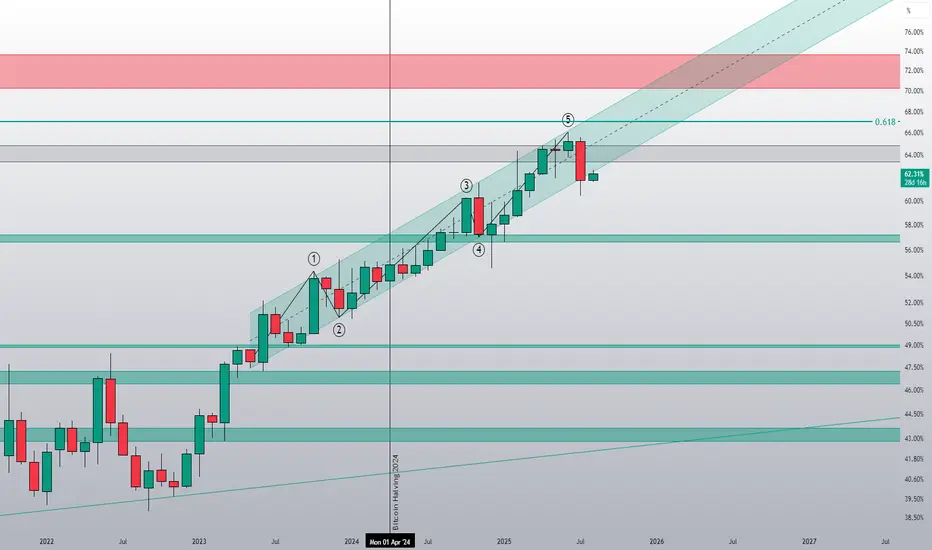
BTC Price Prediction and Elliott Wave AnalysisHello friends,
>> Thank you for joining me in my analysis. We finished the pink Y wave as wxy in purple counting. Now we are moving into creating a confirmation for starting the Big Yellow C wave.
>> our confirmations:
* 4Hr TF: I need to close above the 113420 level.
* 1D TF: I will prefer to close below 113297 and above its opening 112550, and the next double days break today's high.
Keep liking and supporting me to continue. See you soon!
Thanks, Bros

#PORTAL/USDT#PORTAL
The price is moving within an ascending channel on the 1-hour frame, adhering well to it, and is on track to break it strongly upwards and retest it.
We have support from the lower boundary of the ascending channel, at 0.0414.
We have a downtrend on the RSI indicator that is about to break and retest, supporting the upside.
There is a major support area in green at 0.0413, which represents a strong basis for the upside.
Don't forget a simple thing: ease and capital.
When you reach the first target, save some money and then change your stop-loss order to an entry order.
For inquiries, please leave a comment.
We have a trend to hold above the 100 Moving Average.
Entry price: 0.0448
First target: 0.0467
Second target: 0.0486
Third target: 0.0508
Don't forget a simple thing: ease and capital.
When you reach the first target, save some money and then change your stop-loss order to an entry order.
For inquiries, please leave a comment.
Thank you.

$BTC.D🩸 CRYPTOCAP:BTC.D ⁀➷
#BitcoinDominance. Macro chart Another
💯 Intermediate Target - 48%
🚩 Macro Target 1 — 44 %
🚩 Macro Target 2 — 40 %
🚩 Macro Target 3 — 35 %
- Not financial advice, trade with caution.
#Crypto #BitcoinDominance #BTC.D #Investment
✅ Stay updated on market news and developments that may influence the price of Bitcoin Dominance. Positive or negative news can significantly impact the cryptocurrency's value.
✅ Exercise patience and discipline when executing your trading plan. Avoid making impulsive decisions driven by emotions, and adhere to your strategy even during periods of market volatility.
✅ Remember that trading always involves risk, and there are no guarantees of profit. Conduct thorough research, analyze market conditions, and be prepared for various scenarios. Trade only with funds you can afford to lose and avoid excessive risk-taking.

Are we good to go?BTC.D broke slightly below the channel in July, and the August monthly candle has already retested it. Are we ready for a further downside on BTC.D?
Gold in the strong bullish momentum.WE will be expecting gold to con tinue its climb as NFP.
A sudden rejection is seen on 1st of Aug a good strong sign of bull coming in.
point is where to trade.
i personally expect for a pullback and point of interest for me for now nearest will be 3345 next 3330 lastly 3310-14.
where can we expect gold to climb up to.
first pitstop will be 3391-3403 and next 3465-87.
all the best traders.

US10YTHE non farm employment data report has given us a reason to sell of US10Y.the lower than forecast of 73K was a big shock ,the slower job growth reflects caution amongst employers amid uncertainties related to tariff, trade and immigration policies. Wages grew with average hourly earnings increasing about 0.3% month over month. overall, the labor market shows signs of cooling but remains fundamentally resilient with payroll gains still keeping pace with working age population growth.
the US10Y COULD SLIP DOWN MORE ON ECENONOMIC OUTLOOK,IF THEY DONT DEFEND THE DEMAND FLOOR .
#US10Y #BONDS #YIELD

XAUUSD Gold Swing Trading Plan – 1st Week of August 2025 (H4 TF)Strategy Type: Swing Trade (Multi-Day Positioning)
Timeframe: H4 (4-hour)
Market Bias: Bullish Continuation
Risk Profile: Medium-to-Low Frequency, High Conviction
Trade Style: Buy-the-Dip, Scale-out Strategy
🧠 Macro & Technical Outlook
Gold is currently maintaining a bullish higher-high, higher-low structure on the H4 chart, reflecting continued strength from macro drivers including inflation hedging, softening USD, and a shift toward safe-haven assets amid geopolitical and economic uncertainty.
The market has recently completed a local impulse wave and is entering a healthy retracement phase. This sets up a textbook swing opportunity, where pullbacks to key Fibonacci levels can be capitalised for the next bullish leg up.
🔍 H4 Trading Plan Summary
✅ Phase 1: Buy on Pullback to 3360
Entry Zone: 3360 (H4 support and key retracement level)
Reasoning:
Confluence of dynamic support and 50–61.8% Fibonacci retracement zone of the previous H4 swing
Former resistance turned support (RBS zone)
Volume tapering and RSI cooling off — signalling a healthy setup for bullish continuation
Entry Trigger:
Bullish engulfing or pin bar candle on H4
Optional confirmation: RSI > 40 after bounce, MACD crossover
Stop Loss: Below 3340 (beneath structural support)
🎯 Target 1: 3383
Why:
Local resistance zone from previous H4 rejection wick
Close to psychological level and good zone for first partial profit
Action:
Secure 25% profits
Move SL to breakeven or +10 pips for risk-free continuation
Wait for next retracement
✅ Phase 2: Wait for Pullback After 3383
Retracement Zone: Estimated dip to 3370–3375 (higher low area)
Entry Trigger:
Confirmation of strong bounce at this level with tight consolidation and breakout on smaller timeframes (M30/H1)
🎯 Target 2: 3430
Why:
Strong historical resistance from early July
Mid-level of long-term range (3330–3480)
Often serves as decision point between accumulation or breakout
Action:
Secure additional 40–50% profits
Trail SL below the most recent higher low (~3390)
✅ Phase 3: Final Position Hold Toward 3475
Retracement Zone: Likely dip to 3410–3420 after 3430 is reached
Final Entry (Optional): Only if momentum is strong and structure holds
Target 3: 3475
Why:
Multi-month resistance and projected upside target from recent breakout
Round number magnet + liquidity zone for larger institutional exits
Action:
Close remaining 25–30% of the position
Reassess for breakout or reversal at 3475
⚠️ Risk Management Plan
Max exposure: 1.5–2% of account
Stop losses fixed — no averaging down
Use position sizing to handle swing duration volatility
Scale-in only with structure confirmation
🔁 Summary Table
Phase Buy Level Target SL Action
Phase 1 3360 3383 3340 Partial TP, BE SL
Phase 2 3370–3375 3430 3355–3365 Add size, secure more
Phase 3 3410–3420 3475 3390 Final TP, full exit
📊 Indicators to Watch (H4)
RSI: Look for 40–60 zone bounce and push toward 70
MACD: Cross above signal line confirms momentum
Volume: Increased buy-side volume at 3360–3375 confirms entry strength
🧭 Fundamental Considerations
Watch DXY: Weakness in Dollar continues to support Gold’s uptrend
FOMC or Jobs Data Ahead?: Any surprise comments from Fed could introduce volatility
Global Headlines: Risk-off flows (e.g., China/US tensions, war news) are bullish for Gold

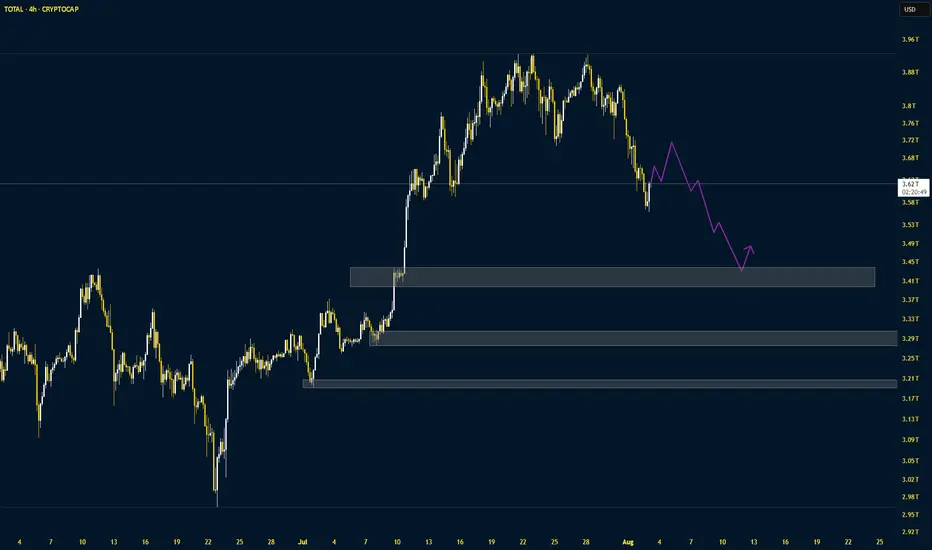
Crypto Total Market CapThe market is correcting at a very fast pace. The correction pattern could be 5-3-5. The following supports are important
Watch Uniswap’s $10 Defense For 16% Breakout Toward $12.5Hello✌
Let’s analyze Uniswap ’s upcoming price potential 📈.
BINANCE:UNIUSDT is currently trading near a key confluence zone that includes the psychological round number of 10, a daily timeframe support level, and a Fibonacci retracement area. If this zone holds, there is potential for a 16% upside move toward the 12.5 level , making it a setup worth monitoring in the coming sessions. 📊🔍
✨We put love into every post!
Your support inspires us 💛 Drop a comment we’d love to hear from you! Thanks , Mad Whale

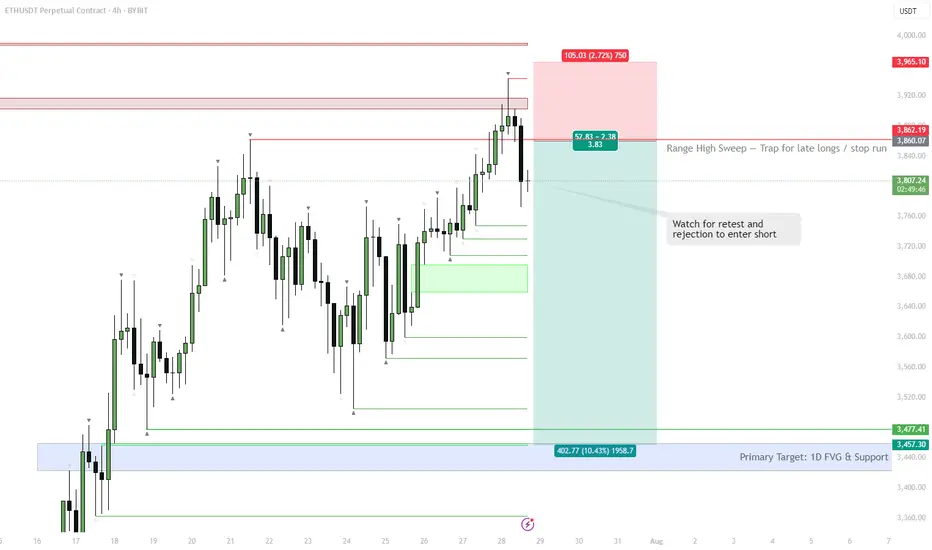
ETH | #4h #short — Range High Sweep & Short SetupScenario:
ETH swept the range high at $3,860, trapping late buyers and triggering stops. Watching for a retest of this level — if it holds as resistance and we see rejection, that’s a short trigger.
Target:
Main target is the 1D FVG at $3,457–$3,477. Possible extension: sweep of range low if selling accelerates.
Why:
Failed breakout setups are classic mean reversion triggers, especially when supported by a visible liquidity pool (FVG) below.
Plan:
Wait for a retest and rejection to confirm short. Partial TP at the FVG zone, manage risk above the sweep high.
NZDUSD: Look Out for Bullish Movement This Upcoming WeekThe NZDUSD currency pair is showing signs of potential bullish movement as we approach the new trading week. Several technical and fundamental factors align to support a possible upward momentum, making NZDUSD a pair to watch closely.
