Asian Paints Forming a W pattern looks bullish above 2613Asian Paints is showing a bullish reversal setup with a clear W pattern (Double Bottom) forming on the daily chart. The stock has tested the ₹2500 support zone twice and bounced, indicating strong buying interest. It is now approaching the neckline at ₹2600, a critical breakout level.
A sustained move above ₹2613, especially with good volume, could confirm the breakout and push prices toward the ₹2675–₹2700 zone, with a possible extension toward ₹2735. This setup provides a favorable risk-reward opportunity.
Trading Plan:
• Entry: Above ₹2613 on confirmation
• Stop Loss: ₹2580 (conservative) or ₹2560 (aggressive)
• Target: ₹2675–₹2700 (initial), ₹2735+ (extension)
Why it matters:
• Strong base at ₹2550 zone
• W pattern signaling reversal
• Breakout potential on good volume
This is a price-action-based setup, supported by pattern structure. Keep an eye on volume and market sentiment for confirmation and Ofcourse Nifty 50 needs to be bullish
Let me know your thoughts in comments
🔔 This is not financial advice. Please do your own analysis before taking any trade.
Chart Patterns

GBPUSD is in Bearish Reversal Head & ShoulderGBPUSD is showing clear bearish head & shoulder pattern on daily chart it will retrace for some time to get close to the price 1.33788 at that point short sell will be good

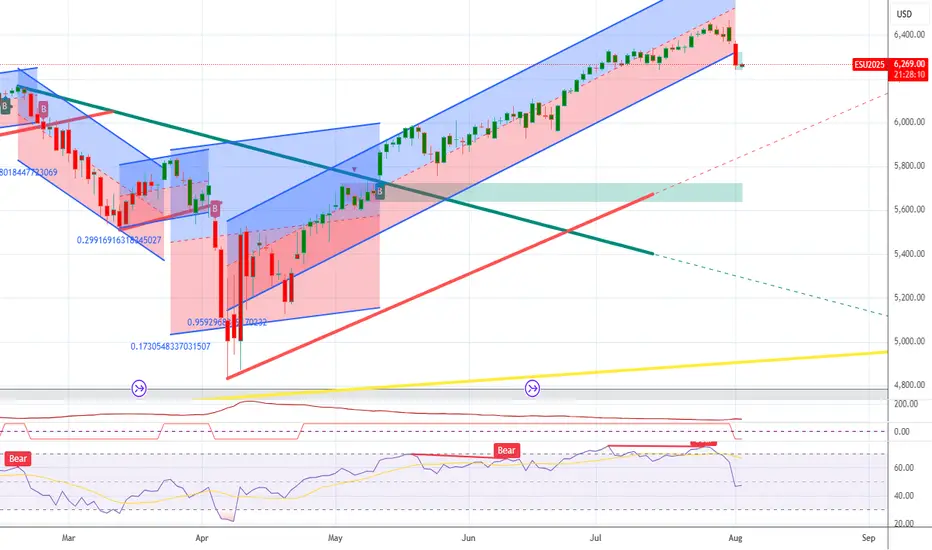
SP500 ShortSP500 is now net short on the regression break.
I am short the Russell2000 from last week and I am considering this trade into Summer.
NZDJPY ShortNZDJPY is now net short on the regression break.
I am considering all JPY pairs as it appears a market correction may build.

Figma: $25 in private → $143 on debut → $148.8 after hours🚀 Figma: $25 in private → $143 on debut → $148.8 after hours NYSE:FIG
💥 Valuation $10 Billion in private market
Skyrocketed into $60 Billion overnight
📈 Déjà vu? Just like NYSE:CRCL in June:
$25 → $300 peak
Welcome to the 2025 stock market,
where everything gets steroid-ballooned... until the needle shows up 💉💥

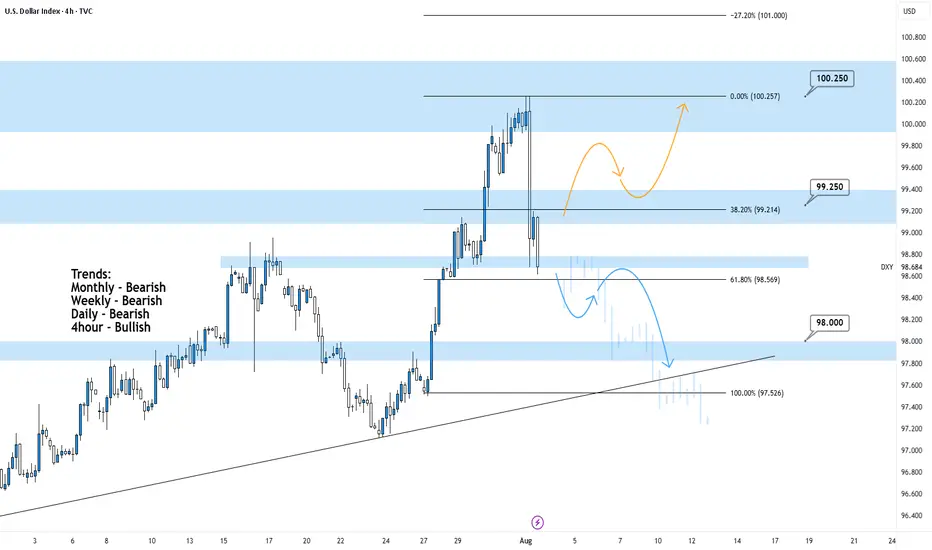
DXY 4Hour TF - August 3rd,2025🟦 DXY 4H Analysis Neutral idea
📅 August 3, 2025
🔹 Top-Down Trend Bias:
• Monthly – Bearish
• Weekly – Bearish
• Daily – Bearish
• 4H – Bullish
The dollar index is in a larger bearish cycle but just bounced from near-term resistance around 100.250. While the 4H shows temporary strength, we’re trading into major resistance and we may see it short lived.
🔍 Key Levels to Watch
• Support: 98.00
• Resistance Zones: 99.25 and 100.25
• 61.8% Fib: 98.57
Price is currently testing structure after rejecting from the 100.25 resistance zone. This area remains a strong ceiling unless the higher timeframe structure shifts.
✅ Scenario A: Bearish Continuation (Blue Path)
1. Bearish Structure confirmation below the current zone
2.If bearish rejection confirms, expect price to continue toward 98.00, possibly 97.50
3.Clean confluence with the higher timeframe trend
⚠️ Scenario B: Bullish Extension (Orange Path)
1.If price breaks and holds above 99.25, we may see a continuation toward 100.25
2.Short-term bullish strength, but against HTF bias
3.Must treat as a counter-trend idea unless confirmed with HTF structure shift
🧠 Final Notes
• 98.50 is the key decision zone, watch reaction closely
• Trend remains bearish on all major timeframes
• Don’t force the long, lean bearish unless structure proves otherwise
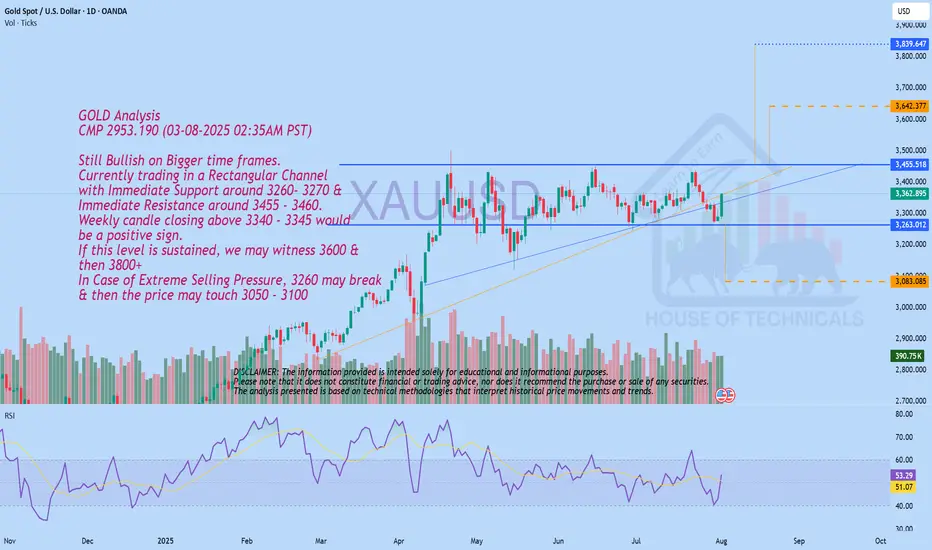
Currently trading in a Rectangular ChannelGOLD Analysis
CMP 2953.190 (03-08-2025 02:35AM PST)
Still Bullish on Bigger time frames.
Currently trading in a Rectangular Channel
with Immediate Support around 3260- 3270 &
Immediate Resistance around 3455 - 3460.
Weekly candle closing above 3340 - 3345 would
be a positive sign.
If this level is sustained, we may witness 3600 &
then 3800+
In Case of Extreme Selling Pressure, 3260 may break
& then the price may touch 3050 - 3100
Bullish Divergence appearing!2222 - Closed at 24 (03-08-2025)
Currently in Downtrend.
However, Bullish Divergence has
started appearing on Bigger tf.
Bearish ABCD pattern target seems to
be around 22 - 23 & it may reverse from
that point. But Confirmation will be
required before taking position. Otherwise,
Next possible Support level can be around 20 - 20.50.
Immediate Resistance seems to be around 25 - 26.
It needs to cross & sustain 29 to start its Uptrend.

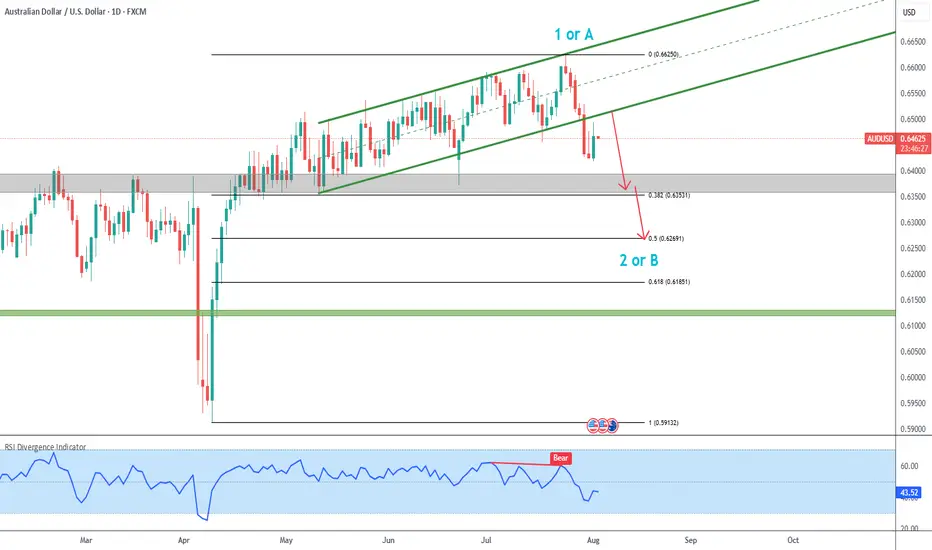
AUDUSD Correction in progress
▶️ AUDUSD has broken the green ascending channel that had been in progress since late April.
▶️ This break suggests wave 1/A likely concluded at 0.66250, supported by bearish RSI divergence on the high.
▶️ Retests of the bottom of the broken channel could offer short trade opportunities.
▶️ The initial high-probability target is the 38.2% Fibonacci retracement at 0.63531, which aligns with the start of the ascending channel.
▶️ A secondary target is the 50% retracement level at 0.62691.
Gold Holds the Trendline - Eyes on the Range HighGold remains range-bound but is climbing off the range low with strong bullish momentum. Price is respecting the trendline and could stage a move toward the top of the range. A minor pullback may offer the best entry opportunity before momentum takes it higher. This setup favors buying the dip as long as the trendline holds.

Important Resistance Ahead!VAL (Valaris Limited)
Closed at 45.28 (01-08-2025)
a Very Strong Resistance lies around 48 - 50.
Crossing this level with Good Volumes may
lead it towards 55 - 56 & then towards 62 - 65.
However, if 27 is broken, we may witness more
Selling Pressure.

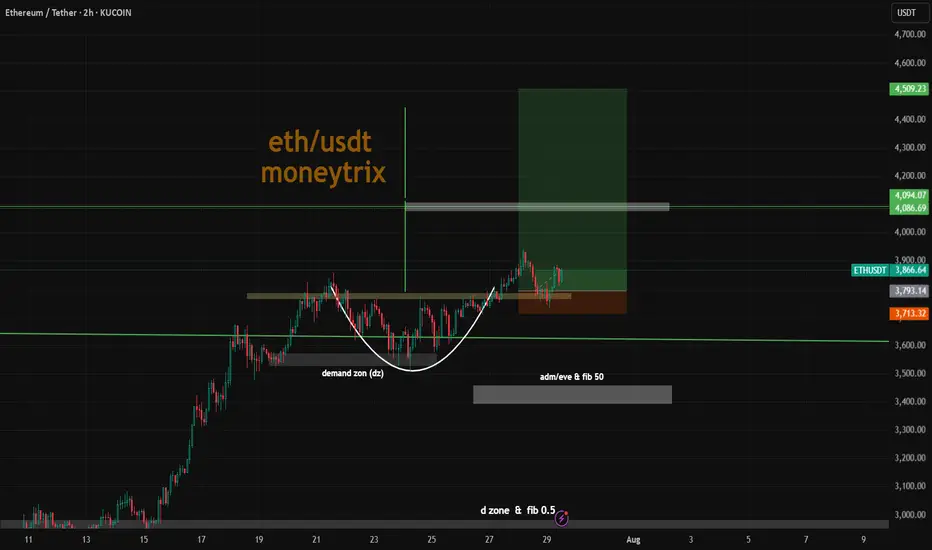
Combining a "cup and handle" pattern with a long position on ETHCombining a "cup and handle" pattern with a long position on ETH/USDT is a classic bullish technical analysis strategy. Let's break down what this pattern signifies and how to approach it for a long trade.
Understanding the Cup and Handle Pattern
The cup and handle is a bullish continuation pattern popularized by William J. O'Neil. It suggests a period of consolidation followed by a breakout to the upside, signaling a likely continuation of the prior uptrend.
Disclaimer: Technical analysis patterns like the cup and handle are tools, not guarantees. Always combine them with sound risk management and your overall trading strategy. Past performance is not indicative of future results.
Bitcoin Found Support at $112kAfter making a new all-time high at $123,000, Bitcoin fell back down to test the previous high at $112,000 as expected in the previous post. In technical analysis, previous resistance tends to become support and for now we are seeing that $112k level hold as support with price bouncing up off it today and is trading back above $114k. We currently have the 50-day price average(50sma) right at that $112k level adding extra support for price as well.
As for the lower price indicators:
The PPO is showing the green PPO line holding above the 0 level which indicates that long-term momentum remains bullish. For short-term price momentum to turn bullish we would need to see the green PPO line cross back above the purple signal line.
The ADX indicator shows the purple -DI line rolling over after rising, and the green +DI line is beginning to rise indicating that the bear strength is weakening, and the bull strength is increasing. For long-term bull strength, we would need to see the green +DI line cross back above the purple -DI line, and for the background histogram bars to rise.
The TDI indicator shows the green RDI line holding above the 40 level which keeps the long-term bull trend intact. Generally, you want to see the RSI line trending between 40-80 as a sign of trend strength during a bull market. The green RSI line is also crossing back above the lower Bollinger Band after briefly crossing below it during the decline. In general, price will continue to decline when the RSI is below the lower BBand so getting back above that level is nice to see here. Next we would want to see the green RSI line move back above it's purple signal line, and back into the upper half of the Bollinger Bands.
I bought the dip into the $112k-$113k level as I expect this level to hold as support going forward. Next up, we're likely going to see a re-test of resistance at the new all-time high of $123k. From there, I'm still expecting a test of the 1.618 fibonacci extension at $135k.

US30 _BUY RETRACEMENT-SELL CONTINUATION-HIGHER TIMEFRAME-FVGThe week of July 28th the market reacted off the resistance around the 45,097 level to the sellside creating a downward trend. On the Monthly and the weekly, the market has traded down into a higher timeframe FVG, possibly creating a buy model for the upcoming week. On the 4hour it's possible a continuation will occur to the sellside.

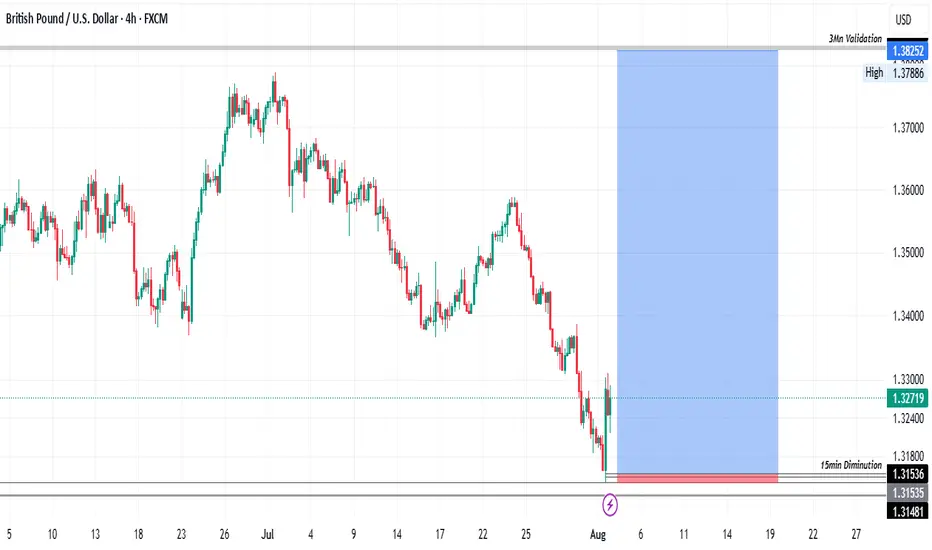
GBPUSD Possible long.-In the monthly (higher timeframes), GBPUSD is bullish.
-In the weekly timeframe, the was a momentous price reaction at the 1w Hidden Invalidation, making it a very strong area of liquidity and unlikely to be broken further in the short term period but maybe tested.
In the the daily and timeframe GU is bearish, but it is just a possible higher timeframe retracement, but still we are looking for opportunities in that retracement too.
-Above is our high probability low risk idea.
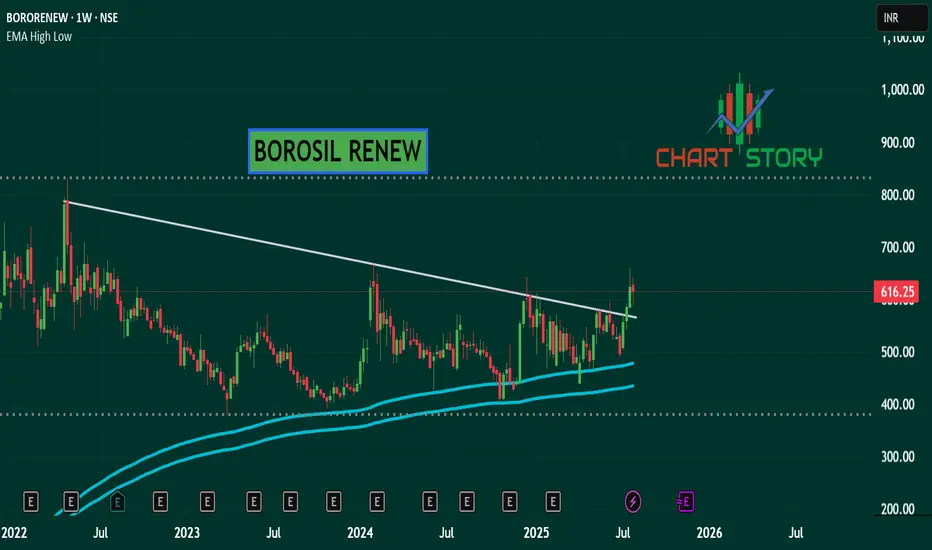
BOROSIL RENEW - TRIANGLE BREAKOUT BUYNSE:BORORENEW Weekly trendline breakout with triangle formation and near to bottom fishing location.
GOLD - WAVE 5 BULLISH TO $3,680As I said on our last update, this 'Gold Bullish Scenario' remains valid as price has still failed to close below $3,245 (Wave 2) low.
As long as Gold remains above Wave 2 high ($3,245), this Gold bullish bias remains an option. As traders we always have to be prepared to adapt to different market conditions.

EtherumEth is in bullish trend
on 1D TF there was a bearsish divergeanc which create a correction
scrip has taken support from 0.5 fib level and bouncing back now.
apprently it is forming a flag pattern and it can hit target of 4500 soon.

Gold analysis and trading strategy for Monday✅ Fundamental Analysis
Friday’s Non-Farm Payrolls (NFP) data came in significantly below expectations, with new job additions falling far short of market forecasts. This sparked a sharp rise in expectations for a Fed rate cut later this year. As a result, the U.S. dollar index declined and gold prices surged violently, rallying from the 3281 level to a high of 3362 — a single-day gain of over $85, completely erasing the week's prior losses and reestablishing a strong bullish structure.
✅ Technical Analysis
📊 Weekly Chart
Gold posted a strong bullish weekly candlestick, reversing the previous consolidation trend and signaling a structural shift in market sentiment. Bulls have regained full control. The key resistance zone lies between 3380–3400; if price breaks and holds above this level, the next upside target will be around 3430.
📊 Daily Chart
Gold stabilized at the 3281 low and surged on Friday evening following the NFP surprise, closing near the day’s high — a sign of aggressive buying. The short-term trend has clearly reversed to the upside, and any pullback is now considered a buying opportunity. The key support has moved up to around 3335, serving as a critical pivot zone. Further support is seen near 3316, a previous swing low.
📊 Hourly Chart
Price is currently trading above short-term moving averages, indicating a strong bullish bias. The key level for a potential bullish continuation is around 3355, which represents a recent support-turned-resistance area. If price pulls back to this level and holds, or breaks above it directly, it will confirm bullish strength. If gold opens with a gap higher toward 3385, beware of potential short-term volatility due to a liquidity gap. Chasing highs in such scenarios requires caution.
🔴 Resistance Levels: 3375–3380 / 3400–3430
🟢 Support Levels: 3355–3340 / 3330–3335 / 3316
✅ Trading Strategy Reference
🔺 Primary Strategy – Buy on Dips:
🔰Consider long entries around 3340–3335, with a stop-loss below 3328.
🔰If the market remains strong, a direct long near 3355 is viable, targeting 3375 and above.
🔰A deeper pullback to 3330–3335 is a favorable entry zone for mid-term longs.
🔻 Secondary Strategy – Sell on Rebounds (Short-Term Only):
🔰If gold opens Monday with a sharp spike to around 3385 but fails to break higher, a light short position may be considered, targeting a quick $10–$15 pullback.
🔰If 3385 is broken and held, abandon short setups and revert to a bullish view.
✅ Overall Outlook
Gold has completed a technical reversal following the bullish fundamental catalyst from the NFP data. The trend has shifted from bearish to bullish, and the market has clearly moved into a higher price range. The core trading logic should remain “buy on dips”, and countertrend trades should be approached with caution. Look for long opportunities near key support levels, and consider short positions only at major resistance levels and for quick intraday trades. A confirmed breakout above 3375 will likely open the door to 3400–3430 in the near term

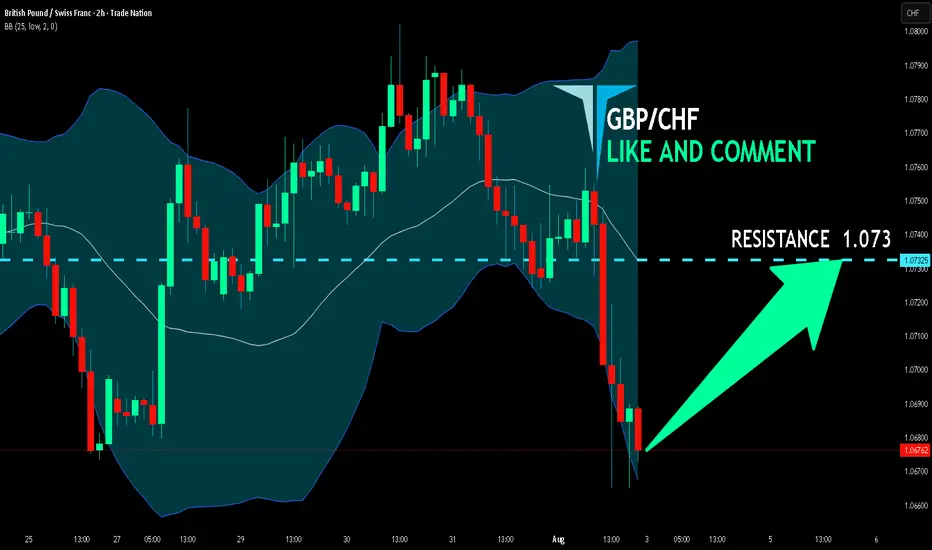
GBP/CHF BEST PLACE TO BUY FROM|LONG
Hello, Friends!
GBP/CHF pair is in the uptrend because previous week’s candle is green, while the price is clearly falling on the 2H timeframe. And after the retest of the support line below I believe we will see a move up towards the target above at 1.073 because the pair is oversold due to its proximity to the lower BB band and a bullish correction is likely.
Disclosure: I am part of Trade Nation's Influencer program and receive a monthly fee for using their TradingView charts in my analysis.
✅LIKE AND COMMENT MY IDEAS✅
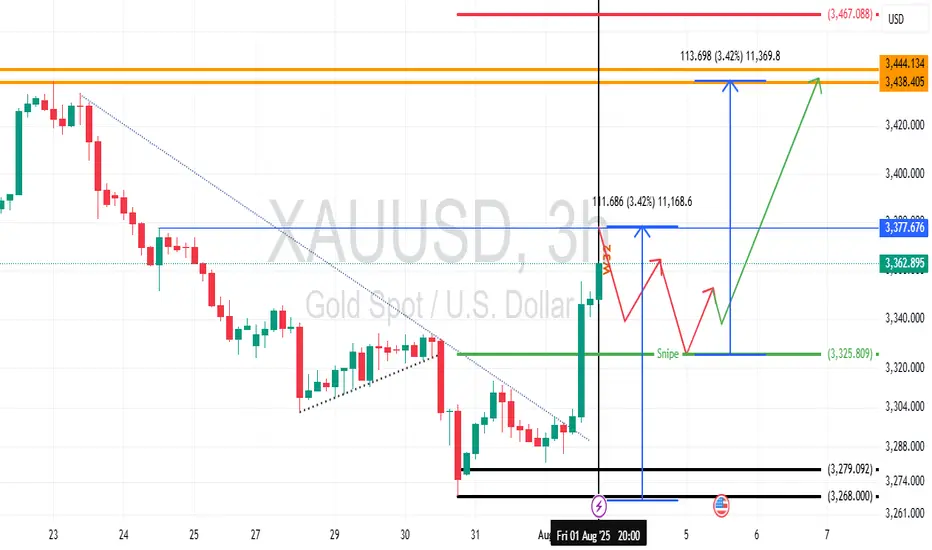
Gold Week 32 OutlookFollowing Non-farm payroll (NFP) on Friday, 01 August 2025, Gold started and maintained a bullish sentiment. With all things considered. It is likely to spend the early days of the week correcting before shooting back upwards towards Thursday/Friday.
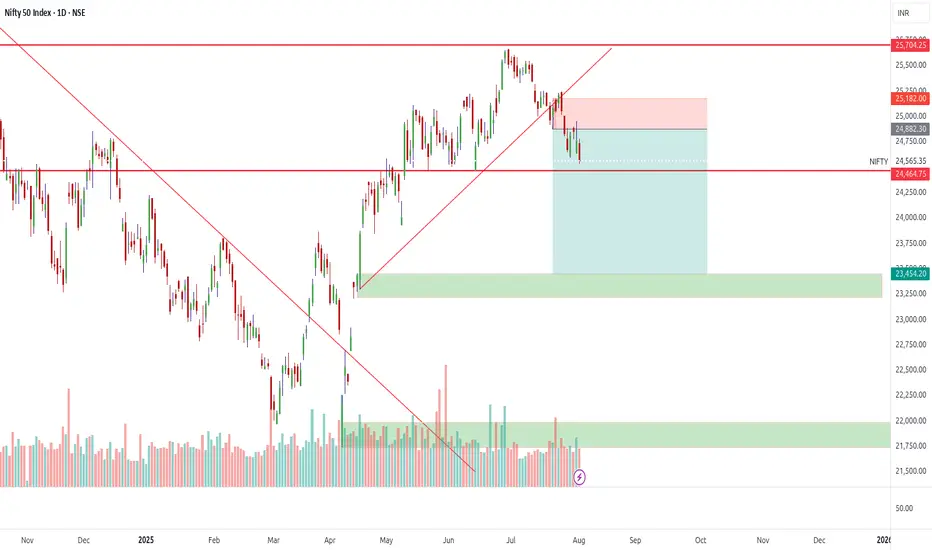
NIFTY Toot Sakta Hai?! | US-Russia War Impact ExplainedHey traders,
Serious geopolitical tension is brewing between the U.S. and Russia, and if things escalate, we could see a major shake-up in global markets — including our very own Nifty 50.
Here’s my view:
🔹 24,500 is the immediate level to watch.
If this breaks down with volume, 24,000 is next, and things could get ugly quickly.
🔻 In a worst-case escalation, Nifty may drop all the way to 23,500 – 21,000.
Yes — that deep. And it won’t be a straight line.
💡 My trading strategy?
I’m avoiding heavy longs
Hedging with puts
Staying in cash or safe sectors
Watching global cues, especially crude oil and the India VIX
📉 Protect capital first — opportunities will come later.
Like, comment your view, and don’t forget to subscribe for more real-time market updates. Stay sharp, stay safe!
#Nifty #StockMarketIndia #USRussiaWar #Geopolitics #NiftyAnalysis #TradingStrategy
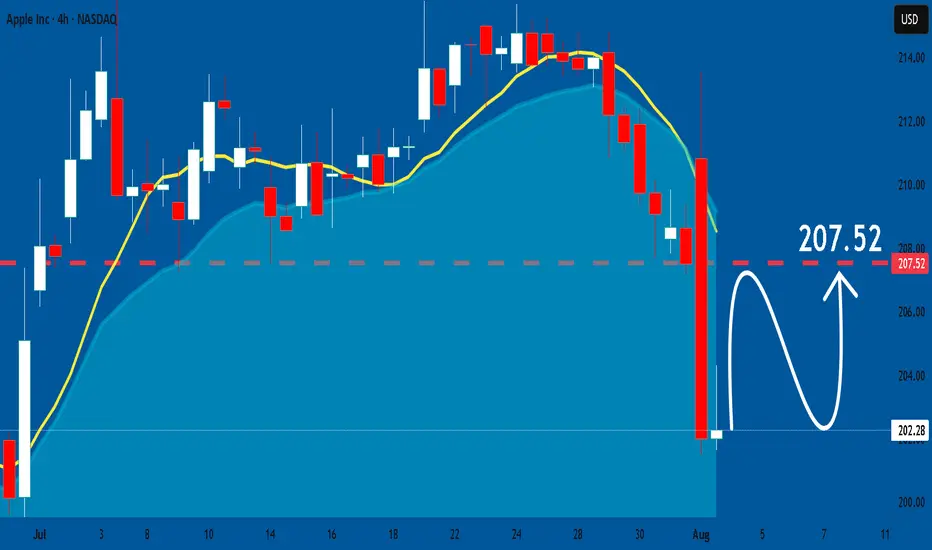
APPLE: Bullish Forecast & Bullish Scenario
The charts are full of distraction, disturbance and are a graveyard of fear and greed which shall not cloud our judgement on the current state of affairs in the APPLE pair price action which suggests a high likelihood of a coming move up.
Disclosure: I am part of Trade Nation's Influencer program and receive a monthly fee for using their TradingView charts in my analysis.
❤️ Please, support our work with like & comment! ❤️