EURUSD - Counter trend idea.-In the monthly (higher timeframes), EURUSD is bullish.
-In the weekly timeframe, the was a momentous price reaction at the 1w BoS, making it a very strong area of liquidity and unlikely to be broken further in the short term period but maybe tested.
In the the daily and timeframe EU is bearish, but it is just a possible higher timeframe retracement, but still we are looking for opportunities in that retracement too.
-Above is our low probability low risk idea. We are only risking 10 Pips.
Chart Patterns

USDCHFUSDCHF price is near the main support zone 0.79245-0.78590. If the price cannot break through the 0.78590 level, it is expected that the price will rebound. Consider buying the red zone.
🔥Trading futures, forex, CFDs and stocks carries a risk of loss.
Please consider carefully whether such trading is suitable for you.
>>GooD Luck 😊
❤️ Like and subscribe to never miss a new idea!

EURUSD - Scaling into Confluence ZoneTaking a look at EURUSD on the daily timeframe we had quite the rebound in EURUSD last Friday following the NFP report. However price action is now heading towards a cluster of resistance levels which is why I'm implement my scaling in technique using a specially designed and programmed EA that i use for MT5.
== TRADE PLAN ==
Scale-in with short positions and target a 0.5% growth on the account. In other words, once the basket arrives in profit by 0.5% CLOSE ALL.
Trade Safe - Trade Well
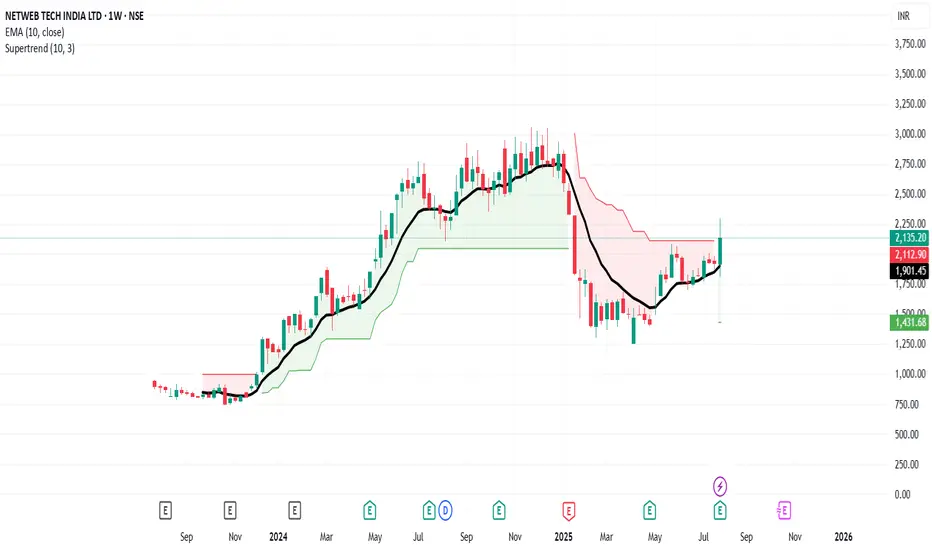
Long NETWEBSuperTrend has turned positive on the weekly chart, with the recent closing price trading above the 10 EMA
BUY NETWEB
Entry - 2296
SL - 1811
Target 3470 Tests zone Gold will going towards 3470/3480 zone for retesting area its because of fill imbalance over long term candle stick , Two area need to watched one 3470/3480 or 3520

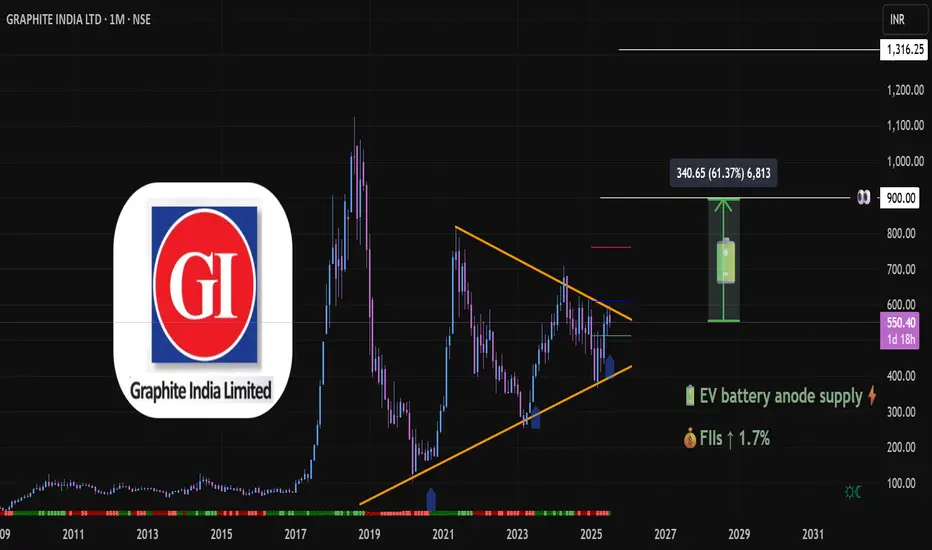
Graphite India (1M TF) - Big Technical Base ►NSE:GRAPHITE
⚙️ Materials: Commodity Cycle Turnaround
(Green energy metals, China recovery)
Sector context: India’s rising graphite demand (e.g. electrode expansion for steel, battery material on horizon) aligns well with Graphite India’s positioning.
►Graphite India is the largest producer of graphite electrodes in the country and one of the largest in the world.
At the time of charting NSE:GRAPHITE PA was at 550
PA in 1D TF has bounced from Support
Trend 1M TF: Long-term Symmetrical 📐triangle formation since 2018 highs — price now testing upper trendline
Monthly shows range‑bound to mild consolidation since topping near ₹623 and bouncing around ₹540‑560.
Multi-year consolidation forming a textbook volatility squeeze, often a precursor to explosive directional moves. Volume compression inside the triangle suggests strong hands accumulating.
Candlestick structure: Bullish engulfing-type recovery candle forming off the trendline support. Breakout Energy above 586 = potential energy. A monthly close👀 above the downtrend line may unlock significant upside ⇗ momentum.
Daily MACD turning positive, weekly and monthly crossovers 🟢suggest building momentum.
Monthly Resistance line 762🔴 Pivot line 🔵611 Support🟢512
₹575–586 is the breakout threshold. Above the pivot and away ⇗
Post-break, next projection target : ₹900 (≈+60%), followed by ₹1,300. (Text Book)
📊 Fundamental Alignment
🔋 EV Battery Anode Narrative: Global lithium/graphite demand surging → Graphite India well-positioned as key electrode supplier.
🌍 China Supply Risks = India graphite players gain global relevance.
💼 FIIs Inflow: Recent uptick (+1.7%) hints at sectoral re-rating in anticipation of capex cycles and commodity upturn.
📉 Valuation Context: After steep de-rating post-2018, current price offers favorable risk-reward compared to earnings expectations and sector re-alignment.
► Graphite electrodes are the main heating element used in an electric arc furnace
extremely high levels of heat generated in EAF.
Graphite electrodes are divided into 4 Types: RP Graphite electrodes, HP Graphite electrodes, SHP Graphite electrodes, UHP Graphite electrodes.
► Needle coke👀 is a key ingredient in the production of graphite electrodes for electric arc furnaces (EAFs) in the steel industry.
🧰 Strategic Outlook
►we'll follow this trade closely and within incoming week we'll up a close up view of 4h TF
Bias: Strongly Bullish on breakout; Neutral if it stalls below ₹550.
Targets: ₹900 (swing), ₹1,300 (positional)
ideal for swing/long-term portfolio adds
Alternate Case: Breakdown below🔻₹480 negates pattern; re-evaluate around ₹400 for demand re-entry.
Always DYOR
See you on the other side
💡 Reflective Close:
“What if true breakouts don’t come from hype — but from time, patience, and the quiet work of smart money preparing long before headlines catch up? Are you watching the price, or are you watching the behavior behind the price?”
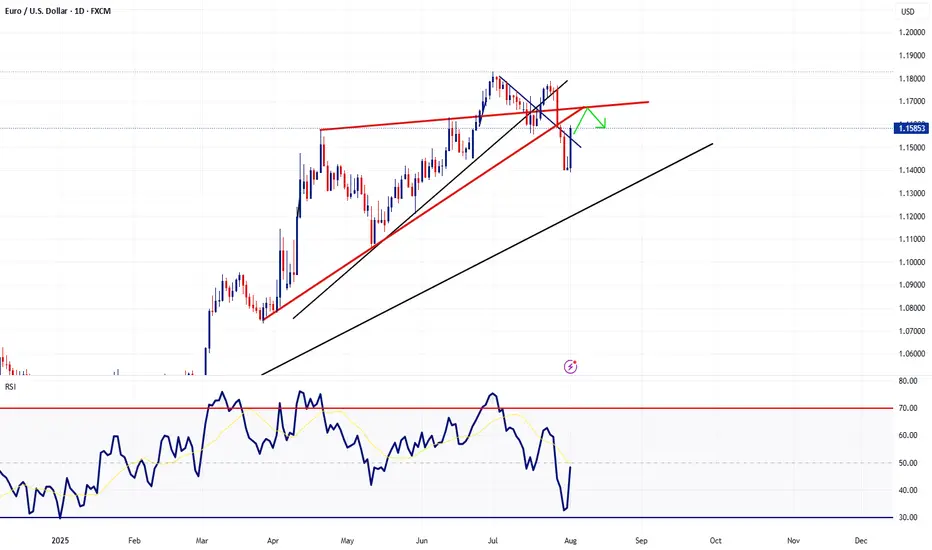
EURUSD Current Market Situation Technical Analysis Current Market Situation
The chart displays a Double Top pattern, a strong bearish reversal signal that often indicates the start of a downward move.
The price has already broken the neckline, and it is now approaching a retest of both the neckline and the broken trendline, which serves as a critical resistance area for potential bearish continuation.
Key Zones
Neckline Retest Zone: Around 1.1600, acting as immediate resistance.
Trendline Retest Zone: Between 1.1670 – 1.1700, serving as an additional resistance level to confirm the bearish bias.
Potential Scenarios
✅ Bearish Scenario (Preferred):
If price respects the retest zones and fails to break higher, we may see a decline toward:
Target 1: 1.1500
Target 2: 1.1400
Target 3: 1.1300
⚠ Bullish Scenario (Alternative):
A clear breakout and daily close above 1.1700 would invalidate the bearish outlook and could lead to a bullish reversal.
Conclusion
The market structure currently favors the bears.
Rejection from the neckline or trendline retest zones will provide a strong confirmation for sell positions.
⚠️ Trade at your own risk – We are not responsible for any losses.

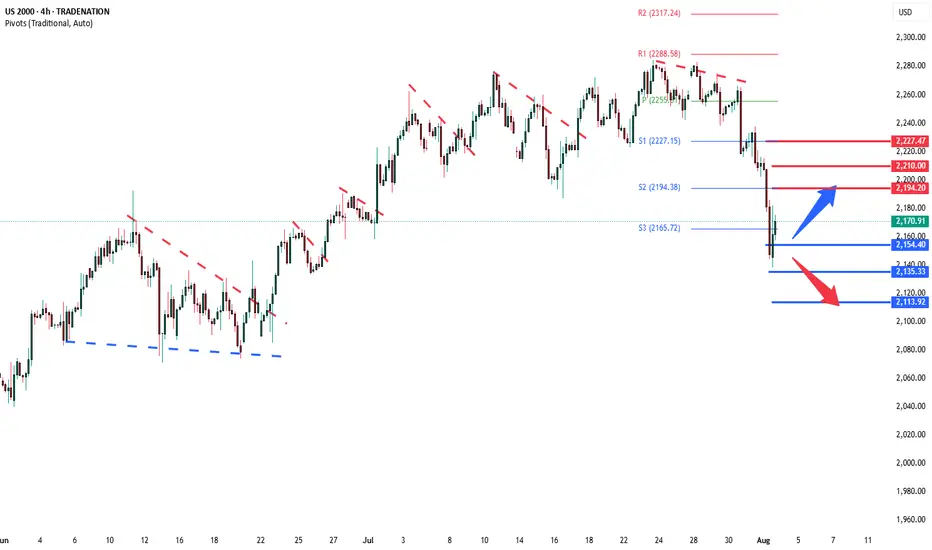
Russell2000 Key Trading levelsKey Support and Resistance Levels
Resistance Level 1: 2194
Resistance Level 2: 2210
Resistance Level 3: 2227
Support Level 1: 2154
Support Level 2: 2135
Support Level 3: 2113
This communication is for informational purposes only and should not be viewed as any form of recommendation as to a particular course of action or as investment advice. It is not intended as an offer or solicitation for the purchase or sale of any financial instrument or as an official confirmation of any transaction. Opinions, estimates and assumptions expressed herein are made as of the date of this communication and are subject to change without notice. This communication has been prepared based upon information, including market prices, data and other information, believed to be reliable; however, Trade Nation does not warrant its completeness or accuracy. All market prices and market data contained in or attached to this communication are indicative and subject to change without notice.
Stoxx50 sideways consolidation continuesKey Support and Resistance Levels
Resistance Level 1: 5464
Resistance Level 2: 5500
Resistance Level 3: 5580
Support Level 1: 5152
Support Level 2: 5097
Support Level 3: 5044
This communication is for informational purposes only and should not be viewed as any form of recommendation as to a particular course of action or as investment advice. It is not intended as an offer or solicitation for the purchase or sale of any financial instrument or as an official confirmation of any transaction. Opinions, estimates and assumptions expressed herein are made as of the date of this communication and are subject to change without notice. This communication has been prepared based upon information, including market prices, data and other information, believed to be reliable; however, Trade Nation does not warrant its completeness or accuracy. All market prices and market data contained in or attached to this communication are indicative and subject to change without notice.

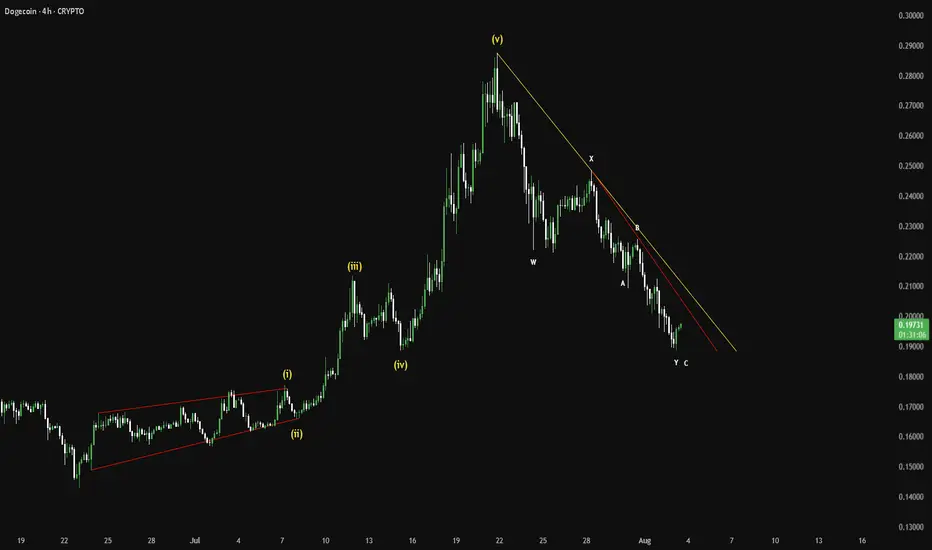
DOGE COIN made a bottom ? start of a new trend ?preferred counts
everything is on the chart , for this dogecoin if not holding then it will move down more
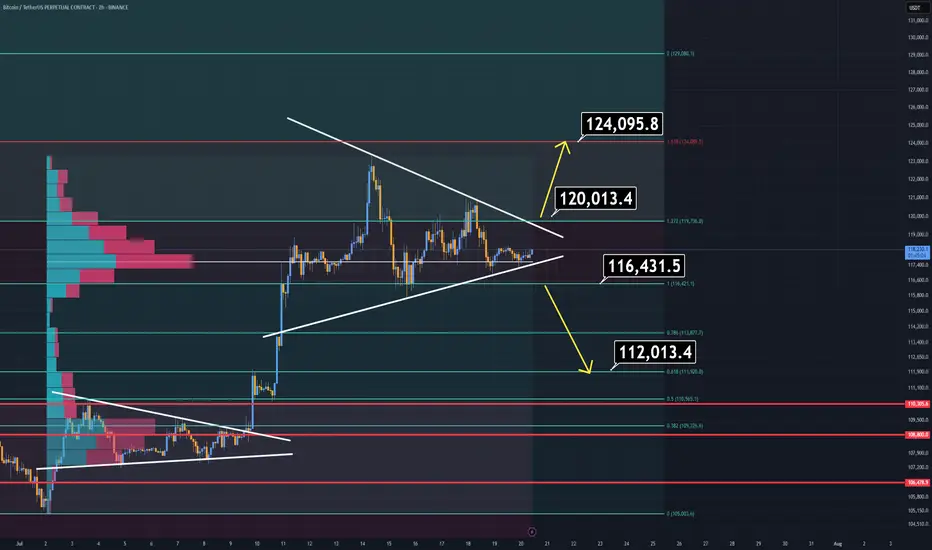
BTC Analysis (2H)Bitcoin is currently consolidating within a symmetrical triangle, suggesting indecision in the market. However, a breakout is imminent — and when it comes, it will likely be sharp.
🔹 Bullish Scenario:
A breakout above $120K would likely lead to a new All-Time High near $124K.
🔹 Bearish Scenario:
A breakdown below $116,400 opens the door for a quick drop toward the $112K–$110K zone, which should be considered a buy opportunity.
⚠️ Pro Tip:
There’s a volume imbalance just below the $116.4K level. If price breaks below it, the move down may be faster and more aggressive than expected — so plan accordingly.
Regardless of short-term volatility, the macro trend remains bullish, and Bitcoin will rise again.
Thanks for reading.
Bitcoin Price Analysis and Market Outlook (Next: $118,100)Bitcoin Price Analysis and Market Outlook (Next: $118,100)

Bitcoin Free Value Gaps UPDATE - near filled next level down
As mentioned previously, these are traditionaly used to find Entries into a market and so far, this has been the case again.
We have dipped to 112K so far and as yu can see, we can go to 103K with ease, should this be allowed by the Bulls.
I will say, the SOPR (Spent Output Profit Loss ) chart has offered a Bull wanting caution flag..
And yet, on the lower time frames, it has just also posted a Good Bull entry point.
This indicates Excellent entry points, Buying opportunities
Yes, PA may drop lower yet, but not massive ones.
It is an excellent example of ow to "Scale in"
Do not use all your money in one trade. Use 20%, wait, see where thelmarket goes. Buy again when ready.
This way, once your lowest Buy price goes into profit, it also starts to cancel out he losses on the other, higher priced Buys....and by the time all your recent buys are in profit, you are exponentially getting better profits.
For me, I am waiting to see if we arrive at the 110K zone before starting this, once the current FVG is filled.
Have a noce sunday

Bullish
Description
Hi traders
I think after the fake break that happened last week at 3280, we should be ready to move higher with a target of 3430-3450 and if the fundamentals are impressive, even a break of the previous high.
Of course, the resistance zone of 3385-3405 is in the way of the price.
I hope that the analysis I am providing is accurate and effective.
Possible positions this week
A:Suitable prices for BUY positions
1)3345-3340
2)3174-3150
B:Suitable prices for SELL positions
1)3385-3405(Of course, with approval from the market and the type of candles)
This is just an analysis and everyone is responsible for their own work.
Hoping for a good and profitable week.

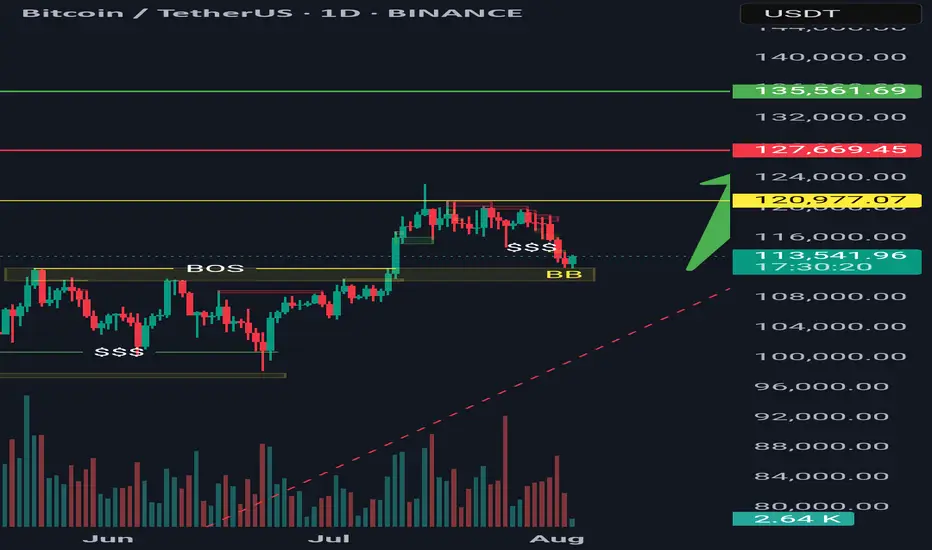
Bitcoin possible bullish momentPrice has pulled back into the Bullish Order Block.
A bounce from the 113K–111K zone is expected.
Targeting next levels of imbalance and liquidity:
TP1: 120,977 USDT
TP2: 127,669 USDT
TP3: 135,561 USDT
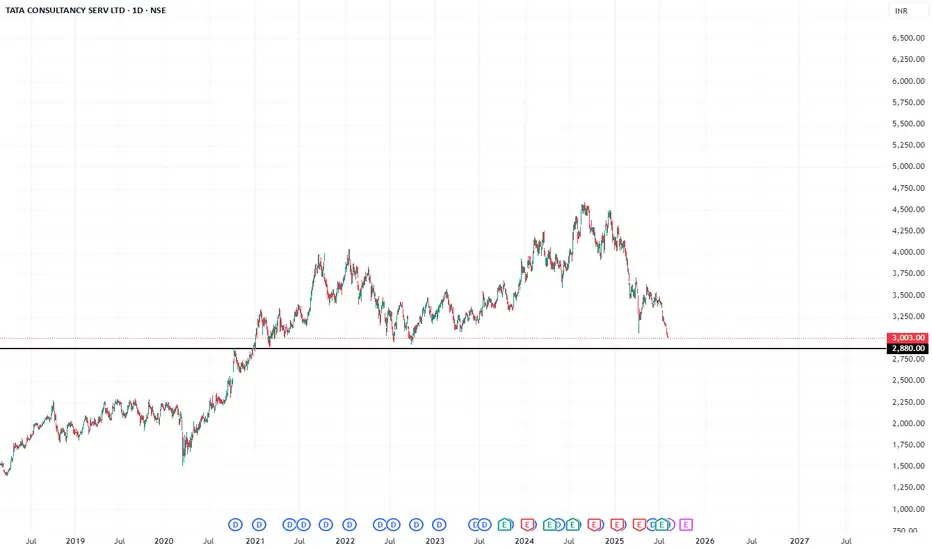
TCS Near Major Support !
TCS is approaching a critical multi-month support zone between ₹2,880–₹2,860. This level has previously acted as a reliable demand zone in June and July. A retest and breakdown below ₹2,875 may open the gates for further downside toward ₹2,810.
However, a bounce from this support — backed by volume and a strong daily close — could push the stock back to the ₹3,040–₹3,080 resistance range.
🔻 TCS – Approaching Major Support (Daily)
CMP: ₹2,890 (as of Aug 2, 2025)
Support Zone: ₹2,880 – ₹2,860
📌 Key Price Levels:
Major Support: ₹2,880 – ₹2,860
Resistance (Bounce Zone): ₹2,920
Breakdown Trigger: Below ₹2,860
Target (if breakdown): ₹2,810
Target (if bounce): ₹2,940 → ₹2,975
Stop Loss (Bounce Trade): ₹2,855
🧠 Setup Explanation:
TCS is nearing a multi-week demand zone around ₹2,880, previously tested in June and early July. Watch for price action confirmation — either a bounce with volume or a clean break below ₹2,860, which may invite further downside.
NZD-CHF Risky Long! Buy!
Hello,Traders!
NZD-CHF keeps falling and
Will hit the horizontal support
Of 0.4738 on Monday from
Where we will be expecting
A local rebound and a
Bullish move up
Buy!
Comment and subscribe to help us grow!
Check out other forecasts below too!
Disclosure: I am part of Trade Nation's Influencer program and receive a monthly fee for using their TradingView charts in my analysis.

EURUSD: Bears Will Push Lower
Remember that we can not, and should not impose our will on the market but rather listen to its whims and make profit by following it. And thus shall be done today on the EURUSD pair which is likely to be pushed down by the bears so we will sell!
Disclosure: I am part of Trade Nation's Influencer program and receive a monthly fee for using their TradingView charts in my analysis.
❤️ Please, support our work with like & comment! ❤️

TriangleIf price closes below the trendline(white line on chart)there is a possibility, for price to touch the Demand Zone below. If price breaks resistance around the 0.83 area the asset can touch the 1.00 area. Please be careful of fakeouts and liquidations and consolidations.

Bitcoin Long Position: Strong Trendline Support! Looking to take a long position on Bitcoin (BTC/USDT) as it bounces off the ascending trendline 🚀. The trendline has historically shown strong support levels, and it’s currently retesting it for a potential reversal.
Key Points:
Current Price: 112,580 USDT 💰
Support Zone: Trendline support is around 112,000 – 111,800 ⬇️
Target: Higher Highs near 116,322 (EMA 20 resistance level) 📈
Stop Loss: Set just below the trendline at 111,500 🔒
Trade Setup:
Entry: At 112,580 USDT
Stop Loss: 111,500 USDT
Target 1: 114,800 – 115,500 USDT
Target 2: 116,322 USDT (potential breakout)
Reasoning:
Trendline Rebound: BTC is testing a major trendline support.
Short-Term Momentum: Expecting a continuation after this test.
Risk Management: Tight stop below the trendline for safety.
🔔 Stay updated: Follow for more setups and updates! Happy trading!

ETHEREUM ETHUSDTTHE structure and strategy will never lie. Watch demand and supply roof .
from the top layers ,we have seen the 3touch supply roof sending Ethereum tanking again expect the retest of the broken supply from the bottom to provide buy opportunity
trading is 100% probability, please lower your expectations and know that any key level can fail.
#ethusdt #ethereum #bitcoin #btc #crypto

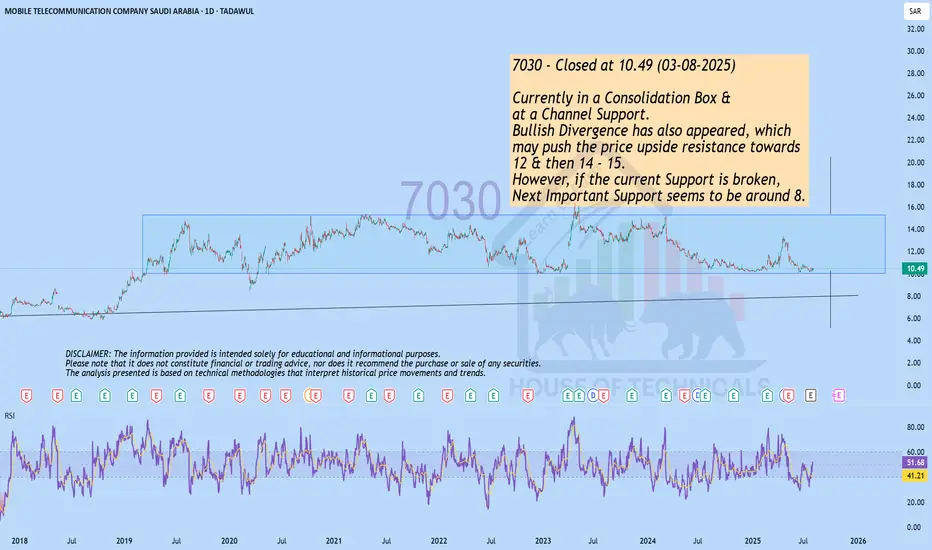
Currently in a Consolidation Box &..7030 - Closed at 10.49 (03-08-2025)
Currently in a Consolidation Box &
at a Channel Support.
Bullish Divergence has also appeared, which
may push the price upside resistance towards
12 & then 14 - 15.
However, if the current Support is broken,
Next Important Support seems to be around 8.
is BTC dead again ?I was really bullish until wave 4 didnt really bounce between the 38 and 50
suddenly very bearish
