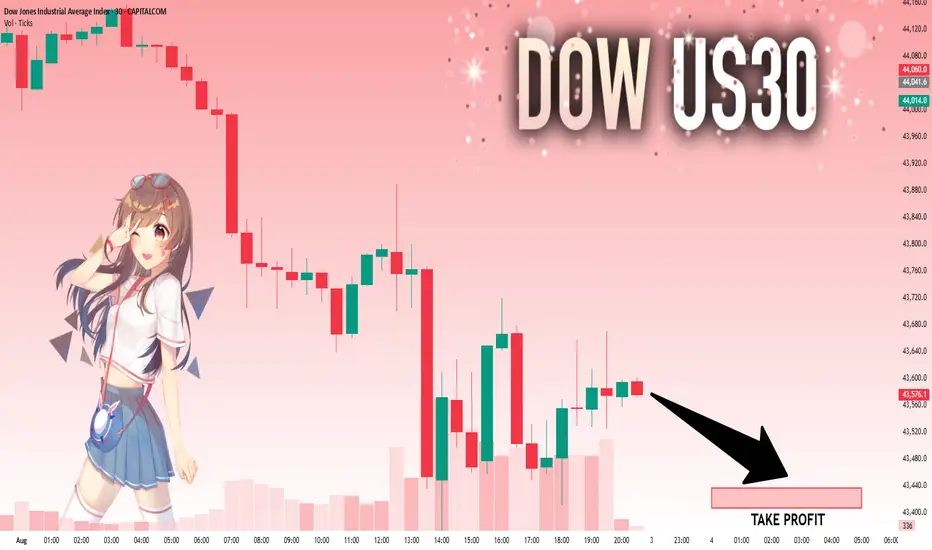
US30: Will Go Down! Short!
My dear friends,
Today we will analyse US30 together☺️
The recent price action suggests a shift in mid-term momentum. A break below the current local range around 47,577.1 will confirm the new direction downwards with the target being the next key level of 43,436.6 .and a reconvened placement of a stop-loss beyond the range.
❤️Sending you lots of Love and Hugs❤️
Chart Patterns
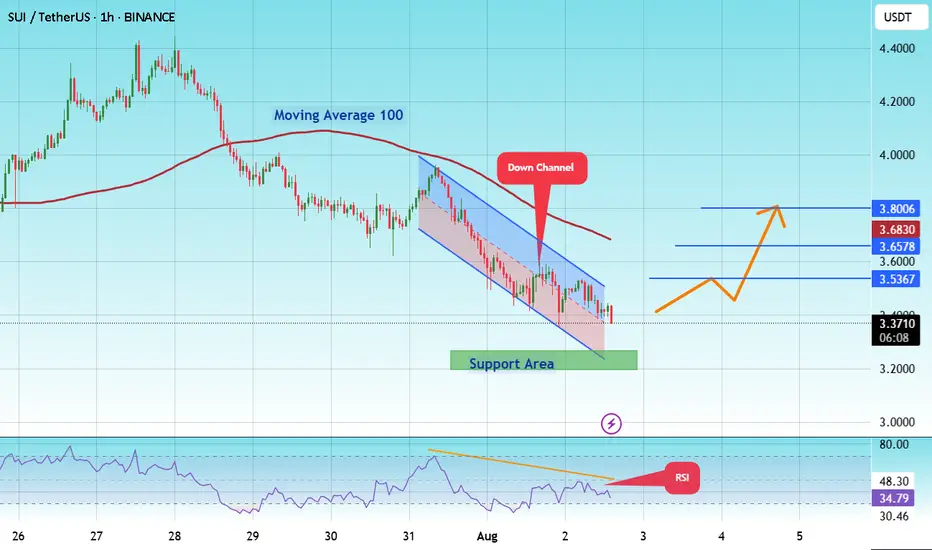
#SUI/USDT Update – Bounce Setup from Demand Zone?#SUI
The price is moving within a descending channel on the 1-hour frame and is expected to break and continue upward.
We have a trend to stabilize above the 100 moving average once again.
We have a downtrend on the RSI indicator that supports the upward break.
We have a support area at the lower boundary of the channel at 3.27, acting as strong support from which the price can rebound.
We have a major support area in green that pushed the price higher at 3.20.
Entry price: 3.38
First target: 3.58
Second target: 3.65
Third target: 3.80
To manage risk, don't forget stop loss and capital management.
When you reach the first target, save some profits and then change the stop order to an entry order.
For inquiries, please comment.
Thank you.
ETHUSDTDISTRIBUTION +ACCUMULITON= RE ACCUMULITON
Accumulation begins and reaccumulation is being completed and the Wyckoff structure is completed
Composite Academy and Analysis
Professor Ramtia Siddiqui
Aram Pizbin Professor
BINANCE:ETHUSDT

US100The US100, also known as the Nasdaq 100 Index, tracks the performance of the 100 largest non-financial companies listed on the Nasdaq Stock Exchange, primarily in the technology, consumer services, and healthcare sectors. It is a market-capitalization-weighted index and includes major corporations such as Apple, Microsoft, Amazon, NVIDIA, Meta, and Alphabet. As a tech-heavy index, the US100 is highly sensitive to changes in interest rates, innovation cycles, investor sentiment, and macroeconomic indicators, especially those related to inflation, employment, and monetary policy.
Over the past two decades, the Nasdaq 100 has experienced strong long-term growth, driven by the expansion of the digital economy, cloud computing, artificial intelligence, and e-commerce. After a steep correction in 2022 caused by inflation concerns and aggressive rate hikes by the Federal Reserve, the index rebounded in 2023 and 2024, supported by improving macroeconomic conditions, a stabilization in interest rates, and renewed investor confidence in tech and growth stocks. AI-driven investments, semiconductor breakthroughs, and tech-led productivity gains have further fueled its momentum.
As of August 2025, the US100 is trading at 22,747, marking a new historical high. This reflects strong earnings performance from major tech companies, continued innovation in AI and automation, and a more dovish outlook from the Federal Reserve, which has helped reduce pressure on growth equities. Despite its gains, the index remains vulnerable to volatility stemming from inflation surprises, geopolitical risks, and shifts in central bank policy. The Nasdaq 100 continues to be a key benchmark for growth-oriented investors and a barometer for the health of the global tech sector.

#LINK/USDT targeting 17.77 $ ?#LINK
The price is moving within a descending channel on the 1-hour frame and is expected to break and continue upward.
We have a trend to stabilize above the 100 moving average once again.
We have a downtrend on the RSI indicator that supports the upward break.
We have a support area at the lower boundary of the channel at 15.60, acting as strong support from which the price can rebound.
We have a major support area in green that pushed the price higher at 15.30.
Entry price: 15.84
First target: 16.47
Second target: 17.00
Third target: 17.77
To manage risk, don't forget stop loss and capital management.
When you reach the first target, save some profits and then change the stop order to an entry order.
For inquiries, please comment.
Thank you.

SILVER (XAGUSD): More Growth Ahead
It looks like Silver is going to continue growing next week,
following a strong bullish reaction to a key daily horizontal support.
The next strong resistance is 3748.
It will be the next goal for the buyers.
❤️Please, support my work with like, thank you!❤️
I am part of Trade Nation's Influencer program and receive a monthly fee for using their TradingView charts in my analysis.

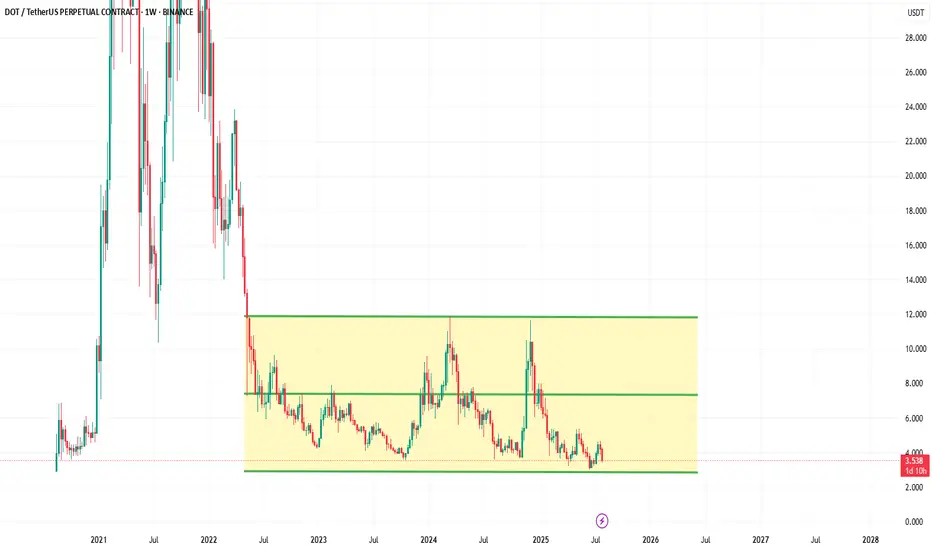
DOT is sitting at the bottom of the Weekly Channel💰 #DOT is sitting at the bottom of the Weekly Channel👀
Given the fact that market is in correction mode, it's literally the dip🔥
Target: 10$📈
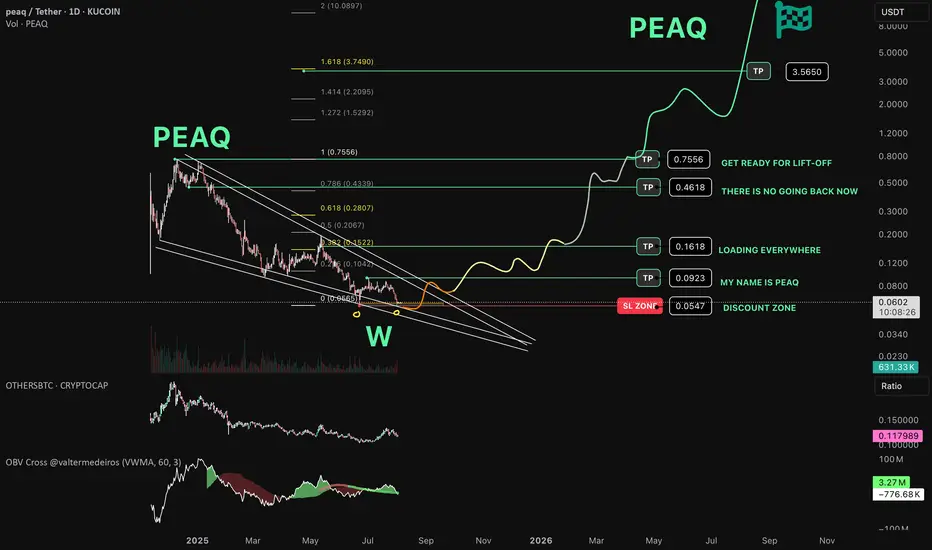
PEAQ Network about to make another pea(q) ? Bottom can be IN!
// ==================================
// ====THE===========================
// ========MACHINE=============^^====
// ===============NEEDS===TALK=======
// ====================TO============
// ==================================
Is this the time?
Chart Recap
🔍 Pattern:
Price formed a falling wedge pattern, which typically signals a potential bullish reversal.
A large W-shaped double bottom pattern is highlighted at the wedge's base, adding strength to the bullish thesis. Can this be the awaited bottom?
🟢 Accumulation & Support Zone :
"DISCOUNT ZONE" is marked near $0.0547, aligned with the wedge support.
Repeated touches at this level suggest strong buyer interest — also called "MY NAME IS PEAQ" and "LOADING EVERYWHERE"
🚀 Bullish Scenario & Targets:
If the wedge breakout plays out:
TP1: $0.0923 – early target near the local range high.
TP2: $0.1618 – aligns with the 0.382 Fib level.
Labeled as “LOADING EVERYWHERE”
TP3: $0.4618 – near the 0.618 retracement.
“THERE IS NO GOING BACK NOW”
TP4: $0.7556 – previous swing high.
“GET READY FOR LIFT-OFF”
TP5: $3.5650 – long-term Fib extension target (1.618).
Ultimate moonshot-level target.
TON/USDT – Daily Price Action Analysis🔹 Price has broken a major descending trendline and entered an ascending channel.
🔹 Currently testing the mid-range resistance zone around $3.60 – $3.70.
🔹 If buyers hold above this area, the next targets could be $4.40 – $4.80.
🔹 If rejected, key supports are at $3.20 and $2.90.

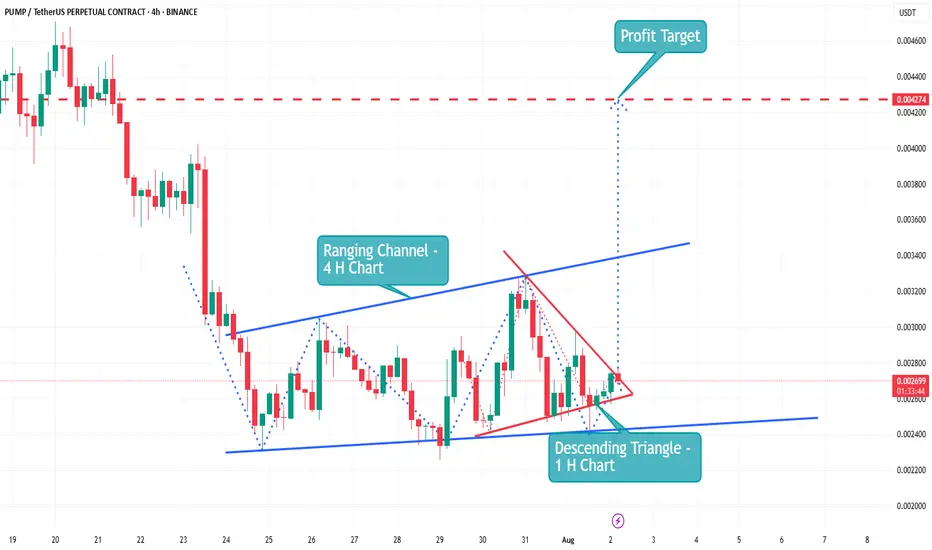
The Pump coin is now showing an upward trend | Live AnalysisPump ▶️
The Pump coin has now touched its All Time Low.🕯
The coin is now showing an upward trend.👀
🛫 a Descending Triangle is currently forming a breakout on the 1H chart.
🛫 Making a Ranging Channel on the 4 H Char
🛫 Make A CHoCH (1H)
🛫 Bullish OB (1H)
🛫 Buy Tag (1 H)
🛫 Making Golden Cross (1 H
EURUSDEUR/USD is the most traded currency pair in the world, representing the exchange rate between the euro (EUR) and the US dollar (USD). It reflects how many US dollars are required to purchase one euro. Introduced in 1999 with the launch of the euro, this pair has become a global benchmark due to the economic size and influence of both the Eurozone and the United States. It is highly liquid and closely watched by traders, investors, and policymakers, with its value shaped by monetary policy, interest rate differentials, macroeconomic indicators, and geopolitical developments.
Historically, EUR/USD has seen major swings. In the early 2000s, the pair fell to around 0.82 before rallying to a peak above 1.60 in 2008 during a period of dollar weakness. It then declined sharply during the European debt crisis. In 2022, amid aggressive interest rate hikes by the US Federal Reserve and rising global uncertainty, the pair briefly fell below parity, trading under 1.00 for the first time in nearly two decades. However, as inflation in the US began to ease and expectations of rate cuts grew, the euro gradually strengthened through 2023 and 2024.
As of August 2025, EUR/USD is trading around 1.15800. This reflects a moderate recovery of the euro from its lows, supported by a more stable Eurozone economy and a softer US dollar. The pair remains sensitive to central bank signals, particularly from the European Central Bank and the Federal Reserve, and is likely to continue reacting to shifts in monetary policy, inflation data, and global risk sentiment. EUR/USD remains a cornerstone of the forex market, widely used by traders for both short-term strategies and long-term positioning.

GBPUSD The Week Ahead Key Support and Resistance Levels
Resistance Level 1: 1.3370
Resistance Level 2: 1.3430
Resistance Level 3: 1.3480
Support Level 1: 1.3180
Support Level 2: 1.3140
Support Level 3: 1.3110
This communication is for informational purposes only and should not be viewed as any form of recommendation as to a particular course of action or as investment advice. It is not intended as an offer or solicitation for the purchase or sale of any financial instrument or as an official confirmation of any transaction. Opinions, estimates and assumptions expressed herein are made as of the date of this communication and are subject to change without notice. This communication has been prepared based upon information, including market prices, data and other information, believed to be reliable; however, Trade Nation does not warrant its completeness or accuracy. All market prices and market data contained in or attached to this communication are indicative and subject to change without notice.

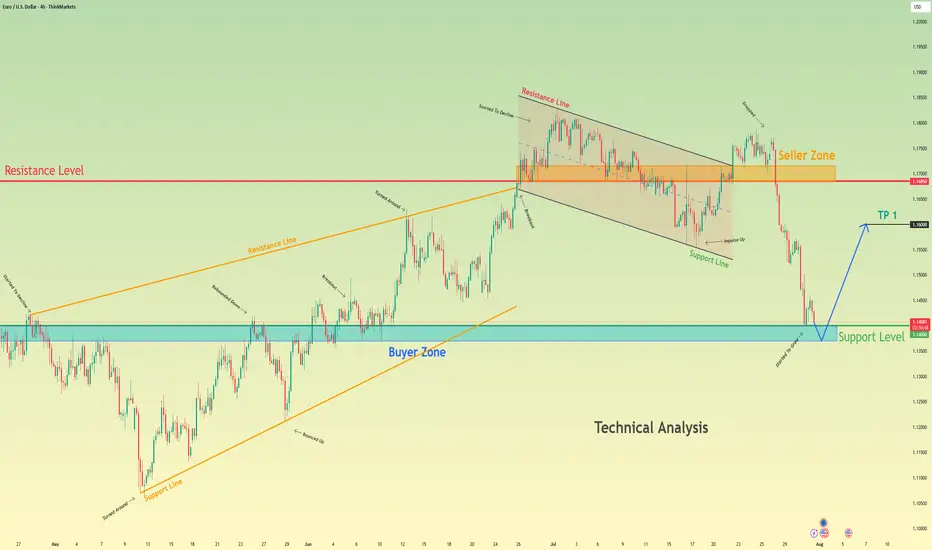
Euro bounce from buyer zone and start to move upHello traders, I want share with you my opinion about Euro. After a prolonged upward trend which formed a large rising wedge, the EURUSD faced a significant rejection from the seller zone near the 1.1685 resistance level. This failure to continue higher marked a key turning point, exhausting the bullish momentum and initiating a new bearish market phase. This new phase has since taken the form of a well-defined downward channel, within which the price has been undergoing a series of downward corrections and impulses. The most recent market action has been a sharp downward fall, accelerating the price's descent towards a critical area of historical significance. Currently, the pair is approaching the major support level at 1.1400, which also constitutes a strong buyer zone where demand has previously stepped in. The primary working hypothesis is a long, counter-trend scenario, which anticipates that the current bearish momentum will be absorbed by the strong demand within this buyer zone. A confirmed and strong rebound from this 1.1400 support area would signal a potential temporary bottom and the start of a significant upward correction. Therefore, the tp for this rebound is logically set at the 1.1600 level, a key psychological and technical point that represents a realistic first objective for a bounce of this nature. Please share this idea with your friends and click Boost 🚀
Disclaimer: As part of ThinkMarkets’ Influencer Program, I am sponsored to share and publish their charts in my analysis.
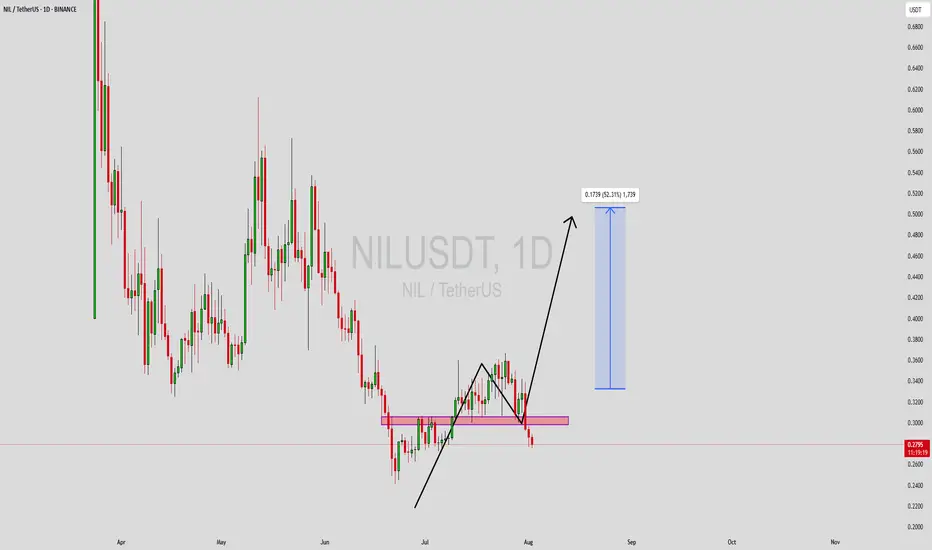
NILUSDT Forming Potential BullishNILUSDT is currently forming an interesting technical setup on the daily chart, hinting at a potential bullish move in the near term. The price structure recently broke out from a consolidation phase and tested the previous support-turned-resistance zone, which is now acting as a key demand area. The market has shown some short-term correction but is likely preparing for a bounce from this level, targeting a potential gain of 40% to 50%.
The projected move is supported by a healthy uptick in volume, suggesting accumulation and growing investor interest. With price action forming a potential higher low near the support zone, this area could become a strong launchpad for the next leg up. The market sentiment for NILUSDT seems to be shifting toward the bullish side, which aligns with the setup shown on the chart.
Technically, if buyers regain control and push the price above the recent local high, we may see rapid movement toward the target zone marked around a 52% gain from current levels. This makes NILUSDT a favorable candidate for short to mid-term traders looking to capitalize on breakout continuation setups.
Overall, NILUSDT appears to be at a crucial technical junction. The current zone could offer a good risk-to-reward entry opportunity for trend-following traders watching for bullish confirmations.
✅ Show your support by hitting the like button and
✅ Leaving a comment below! (What is You opinion about this Coin)
Your feedback and engagement keep me inspired to share more insightful market analysis with you!
EUR/USD Reversal or Trap? 4H Clean Breakdown InsidePrice just tapped into a high-probability sell zone after a corrective Wave 2 structure. With sellers already active at 1.16342 and 1.17635, this setup is not just textbook—but a potential goldmine for swing traders.
🔻 Is this Wave 3 continuation about to begin?
🔍 Liquidity swept. Zones respected. Structure still bearish.
⚠️ Many traders will miss the bigger picture here—will you?
👇 Drop your thoughts:
Are we about to break 1.13000?
Do you agree with the Elliott Wave count?
What’s your bias on DXY?
💬 I personally reply to every comment—let’s build this chart together.
🔥 If you caught the entry, show your entry point and reasoning—let’s level up as a team.

Warning: SPX500 May Have Peaked—Here’s What the Charts SayThe S&P 500 (SPX500) may have reached its peak. In this video, I reveal the technical evidence pointing to a potential reversal—including monthly bearish divergence, daily and weekly reversal candles, and confirmation from key indicators.
This isn’t just noise—these signals align across timeframes, suggesting a shift in momentum that could lead to significant downside. I’ll walk you through the charts, explain the implications for traders and investors, and highlight critical support levels to watch.
Thank you for watching and have a great trading week. Cheers!!

Silver The Week AheadKey Support and Resistance Levels
Resistance Level 1: 3756
Resistance Level 2: 3855
Resistance Level 3: 3915
Support Level 1: 3600
Support Level 2: 3544
Support Level 3: 3480
This communication is for informational purposes only and should not be viewed as any form of recommendation as to a particular course of action or as investment advice. It is not intended as an offer or solicitation for the purchase or sale of any financial instrument or as an official confirmation of any transaction. Opinions, estimates and assumptions expressed herein are made as of the date of this communication and are subject to change without notice. This communication has been prepared based upon information, including market prices, data and other information, believed to be reliable; however, Trade Nation does not warrant its completeness or accuracy. All market prices and market data contained in or attached to this communication are indicative and subject to change without notice.

MDTUSDT Forming Bullish WaveMDTUSDT is currently forming a bullish wave pattern, indicating a strong potential for continued upward momentum. This wave structure reflects healthy market cycles, with higher highs and higher lows suggesting that bulls are steadily gaining control. As this wave pattern matures, the current market setup hints at a possible breakout, which could push prices significantly higher in the near term.
The volume backing MDTUSDT is robust, which provides a solid confirmation for the ongoing trend. Good volume during the accumulation and breakout phases is essential for sustaining a bullish wave. If the pair maintains its current buying pressure, traders could expect a strong rally, with a projected gain between 90% to 100% based on historical wave completions and resistance breakouts.
Investors and traders have started showing increasing interest in MDT, further validating its bullish potential. This growing attention not only boosts market confidence but also contributes to stronger liquidity, which is critical for smooth and sustained upward movement. Technical traders watching for confirmation of the next wave will likely key in on breakout zones and RSI/volume confluences.
In summary, MDTUSDT is showing signs of entering a powerful bullish continuation phase, supported by strong volume and increasing market interest. As the wave structure plays out, this pair could offer an excellent opportunity for swing traders aiming for mid-to-high double-digit returns.
✅ Show your support by hitting the like button and
✅ Leaving a comment below! (What is You opinion about this Coin)
Your feedback and engagement keep me inspired to share more insightful market analysis with you!

DowJones The Week Ahead Key Support and Resistance Levels
Resistance Level 1: 44390
Resistance Level 2: 44720
Resistance Level 3: 45100
Support Level 1: 43360
Support Level 2: 43140
Support Level 3: 42800
This communication is for informational purposes only and should not be viewed as any form of recommendation as to a particular course of action or as investment advice. It is not intended as an offer or solicitation for the purchase or sale of any financial instrument or as an official confirmation of any transaction. Opinions, estimates and assumptions expressed herein are made as of the date of this communication and are subject to change without notice. This communication has been prepared based upon information, including market prices, data and other information, believed to be reliable; however, Trade Nation does not warrant its completeness or accuracy. All market prices and market data contained in or attached to this communication are indicative and subject to change without notice.

Blue Boxes of ConsolidationIt seems the last two major moves on the chart (in the blue boxes) there was heavy consolidation for seven to 10 candlesticks, in this chart seven to ten weeks before a breakout. The bears now have a strong bearish candle but it is still in a consolidation pattern. The Bulls still have a trendline that held from April 2024 where price has not closed below it (please see SMA curve in black on the chart). If you turn on the 50 EMA price is still oscillating around it. And price is still in the Fibonacci golden zone. The bears need a bearish close with follow through below 12.40 and the bulls need a bullish close above 13.65 to hopefully kick off their party. The Bulls have a historical trendline and the Bears have a bearish MACD(Chris Moody) and a Braid filter that just flashed red and a recent strong bearish candle.

Gold The Week Ahead Key Support and Resistance Levels
Resistance Level 1: 3386
Resistance Level 2: 3410
Resistance Level 3: 3438
Support Level 1: 3315
Support Level 2: 3295
Support Level 3: 3268
This communication is for informational purposes only and should not be viewed as any form of recommendation as to a particular course of action or as investment advice. It is not intended as an offer or solicitation for the purchase or sale of any financial instrument or as an official confirmation of any transaction. Opinions, estimates and assumptions expressed herein are made as of the date of this communication and are subject to change without notice. This communication has been prepared based upon information, including market prices, data and other information, believed to be reliable; however, Trade Nation does not warrant its completeness or accuracy. All market prices and market data contained in or attached to this communication are indicative and subject to change without notice.

GOLD: NEW WEEK TECHNICAL BIAS (MARKET OPEN)CONTEXT
▪︎ HTFs Bias: Bullish stance remains intact until a valid structural breach occurs.
▪︎ Monthly Context: Despite consistent upper wick rejections, price continues to close above prior monthly opens — suggesting bullish resilience.
▪︎ Weekly View: Current price action reflects a Value Compression Phase (VCP) within the premium zone of the active range, implying potential buildup for a bullish Impulse Drive.
▪︎ Daily Alignment: Daily price behavior mirrors the Weekly context, supporting a continuation thesis.
Preferred Scenario: Leaning towards a Retrace Precision Entry (RPE) before the Ascend Sequence resumes. Watching:
• Point A (shallow pullback) near B/C level, or
• Point B (deep pullback) into the pending Rejection Zone (ARB).
Invalidation Trigger: A structural breach below 3336, backed by bearish momentum and microstructure shift, targets first 3280, then levels below.
Uncertainty Variable: Will price first sweep 3433.2 before retracing? Or will it retrace from market open? This remains unclear and demands a patient, reactive stance.
📌 Disclaimer: This is a strategic directional bias, not financial advice. Execute only with confirmation and proper risk management.

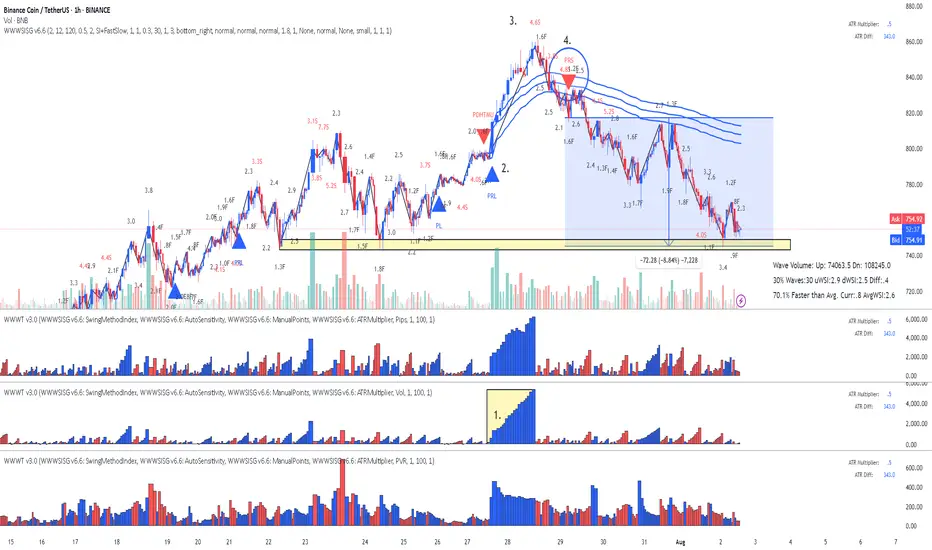
BNB Binance Coin: Lesson 15 methodology did the job again
Lesson 15 methodology (annotations in sync with the chart):
1. Largest up volume wave after a while - sellers might be in there.
2. Placed AVWAP and waited for price to cross downwards and pullback again on AVWAP
3. HTMU (hard to move up) - Abnormal Speed Index 4.6S at the top
4. Entry short signal PRS with abnormal SI 4.8.2 (price has a hard time to move up - absorption)
Simple as that. Enjoy!