Gold Eyes QML Resistance: Ready for a PullbackHelloooo!
Gold, after gapping up strongly, has now entered the green QML (Quasimodo Level) supply zone at roughly 3,380–3,390. This zone has acted as resistance before, so a reaction here makes perfect sense.
What I see:
Engulfed Level (3,315.66): Earlier support that got taken out. This is our logical pullback target once the QML zone does its job.
Hurricane Move: The big up-spike looks exhausted now that it’s hit the QML.
Bearish Reversal Odds: if sellers step in around current levels, expect a drop back toward 3,315.
Plan: Watch for bearish candles or a failed rally inside the 3,380–3,390 area. If we see clear rejection, target a swift move down to 3,315, with a further slide possible to the 3,260 demand zone if momentum holds.
Chart Patterns

Adding to our first bitcoin sell position now We are adding to our first sell position on bitcoin because we are to see more sell off from here

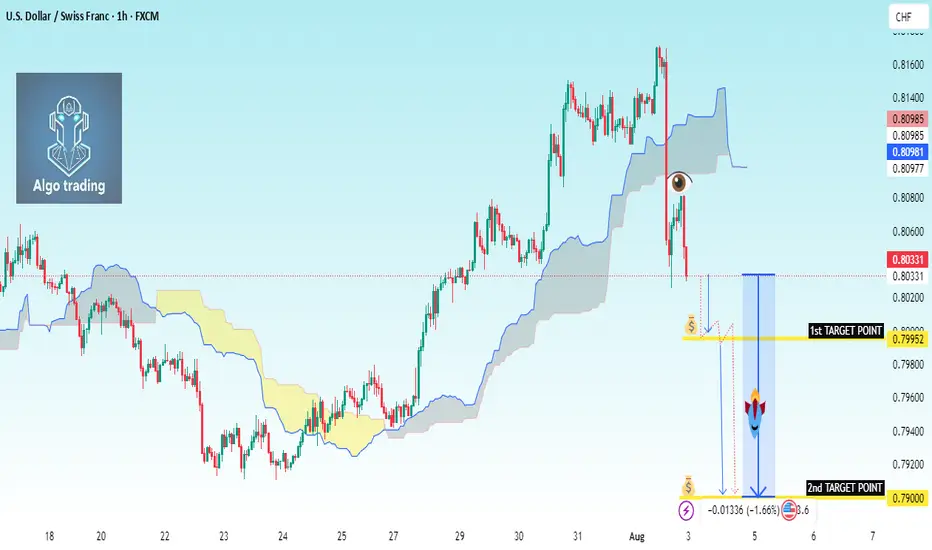
Sell Setup – USD/CHF (1H Timeframe)Chart Summary (1H – USD/CHF)
The pair was bullish, then got sharply rejected near 0.8100.
Price is now inside the Ichimoku Cloud, which means indecision.
Bearish signs:
Price failing to push back above cloud
Chikou Span (lagging line) is heading below candles
Flat Kijun-sen + bearish twist forming in the cloud
---
🔻 Sell Setup (Only Sell Focus)
📍 Sell Entry
Entry price: 0.7990
Reason: Break below Ichimoku cloud base and recent structure support
Confirmation of bearish move starting
🛑 Stop Loss
SL: 0.8055
Above the Kijun-sen and recent minor high
Protects against false breakdowns
🎯 Take Profit
TP1: 0.7950 – First nearby support
TP2: 0.7900 – Strong previous support area
---
📊 Trade Plan Summary
Component Price
Sell Entry 0.7990
Stop Loss 0.8055
Take Profit 1 0.7950
Take Profit 2 0.7900
---
✅ Entry Confirmation Checklist
Before entering the trade, confirm these:
❗ 1H candle closes below 0.7990
📉 Bearish candle shape (strong body, not a doji)
🟡 Chikou Span below price
☁ Cloud is red (future kumo bearish twisd
Major U.S. News Ahead—Will EURUSD Pivot?Good morning, my friends 👋
Here’s my EURUSD market analysis 📉
Currently, the pair is in a downtrend. I expect this downward move to end around 1.14899 or 1.14536, where a potential buying opportunity may emerge. I personally plan to enter a buy position once price reaches those zones 💼
Also, keep an eye on major U.S. economic reports being released today—they could trigger increased volatility 🔔
Every like you send is a huge source of motivation for me to keep sharing high-quality analysis 🙏 Thanks to everyone supporting the channel 💙

Bitcoin long again from 114k.Got stopped from the previous long , seems like btc wanted to sweep these 4h lows and continue higher .
Lets wait and enjoy the show in the upcoming months.

BTCUSDT: Good Opportunity to buy Bitcoin has dropped sharply since NFP data came out. We can now see price reversing nicely from 109k area.

JUST HODL IT BITCOINTrendline breakout from 2017 and 2021 local highs has occurred and is being retested

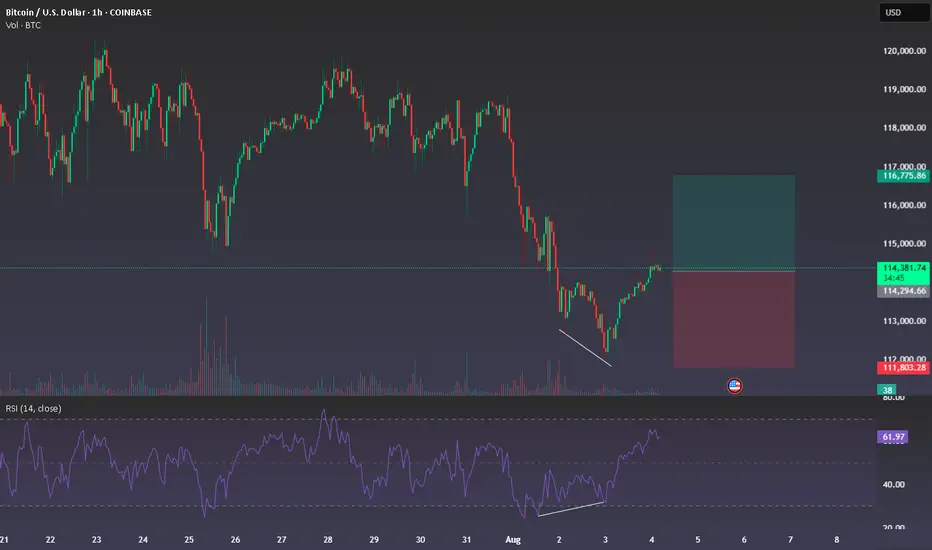
BTC Long – Bullish Divergence 1H Looking for long from 114300 zone
1H chart showing bullish divergence
also price broke short downtrend with nice momentum
Timeframe: 1H
Entry: 114300
Target (TP): 116850
Stop (SL): 111700
Only sharing my view, not any financial advise, thx
GBP/CAD - H4 - Bearish Flag (26.07.2025)The GBP/CAD Pair on the H4 timeframe presents a Potential Selling Opportunity due to a recent Formation of a Bearish Flag Pattern. This suggests a shift in momentum towards the downside in the coming Days.
Possible Short Trade:
Entry: Consider Entering A Short Position around Trendline Of The Pattern.
Target Levels:
1st Support – 1.8242
2nd Support – 1.8139
🎁 Please hit the like button and
🎁 Leave a comment to support for My Post !
Your likes and comments are incredibly motivating and will encourage me to share more analysis with you.
Best Regards, KABHI_TA_TRADING
Thank you.
Disclosure: I am part of Trade Nation's Influencer program and receive a monthly fee for using their TradingView charts in my analysis.

SOLANA's Situation, A Comprehensive Analysis !!!The price on the 3d timeframe is within an ascending triangle, which can be promising. If the price breaks this pattern with bullish candles, it could easily rise by the distance of AB=CD .
Best regards CobraVanguard.💚

BTCUSD going to touch 116,800BITSTAMP:BTCUSD Long trade, with my back testing of this strategy, BTCUSD need to touch 116,800
This is good trade, don't overload your risk like greedy, be disciplined trader, this is good trade.
Use proper risk management
Looks like good trade.
Lets monitor.
Use proper risk management.
Disclaimer: only idea, not advice

its btc short according to mirrior concept A Bitcoin short position based on Fibonacci levels and market sentiment is a trading strategy to profit from a price drop.
It involves:
1. **Technical Analysis:** Using Fibonacci retracement levels (e.g., 61.8%) to identify a potential price reversal point after a bounce.
2. **Sentiment Analysis:** Confirming the reversal signal by checking for "extreme greed" in the market, which suggests overbought conditions and an impending correction.
A trader enters a short trade when both signals align, expecting the price to fall from that key resistance level.

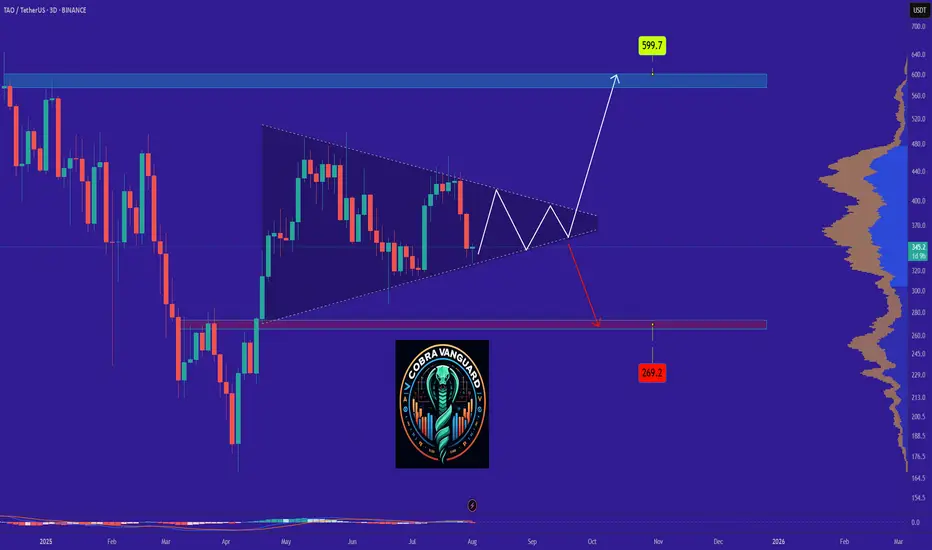
TAO - Time to buy again!The triangle pattern will break in the direction it is breached, and the price will move in that direction. In my opinion, the price could be bullish and may up to $600.
Potential SellPepe has an M formation that is clear as day. Price has dropped to a level 0.00000986, pushed upwards to 0.00001055 and has started to form a wick on the resistance which is an indication that price might push downwards to complete the M formation.
If price pushes upwards past the resistance then the sell setup would be invalidated.

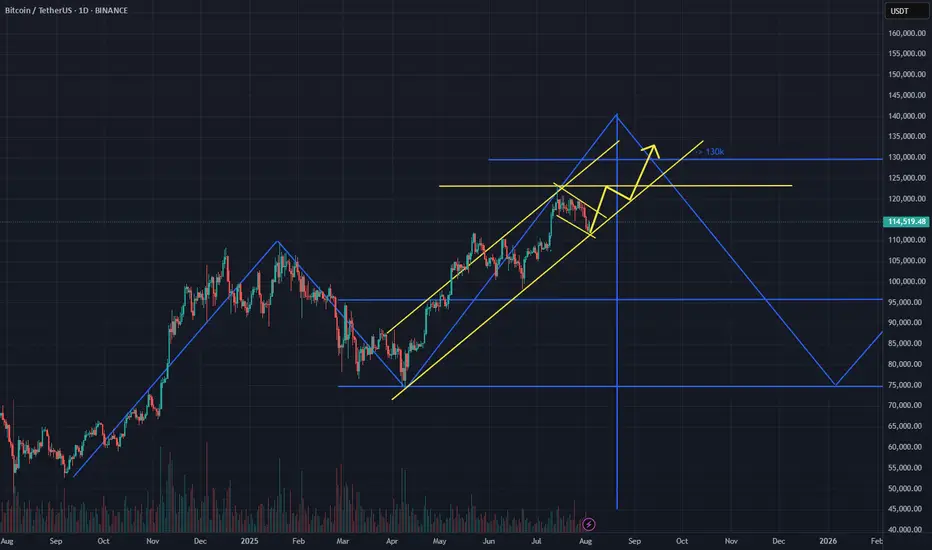
BTC DOMINANCE UPDATE- So, all elements are annotated throughout the graphic, like always.
- Timeline.
- Older Top Dom (2021) (red doted line).
- New Top Dom (2025) (red line).
- Some supports ( Orange Line ).
- Some Bottoms ( Green Lines ).
- Most important in chart : Fibonnacci Retracements.
- After this chart, I’ll drop links to my older BTC dominance posts.
- Not much to say, just look at the chart :
- In 2021, BTC.D formed a double top because Bitcoin spiked twice and hit two all-time highs.
- That doesn’t mean BTC.D will behave the same way in 2025. I don't expect another double top, but who knows.
- We could see a retracement down to the 45–47% range. That would likely signal the start of a new bear market.
- For now, i don’t see the end of the bull run yet. I’m mostly waiting for a strong BTC push in price, a fast dip in BTC Dominance, and the kickoff of Altseason.
— it’s going to be wild and fast! Just my personal opinion.
Stay Safe !
Happy Tr4Ding !

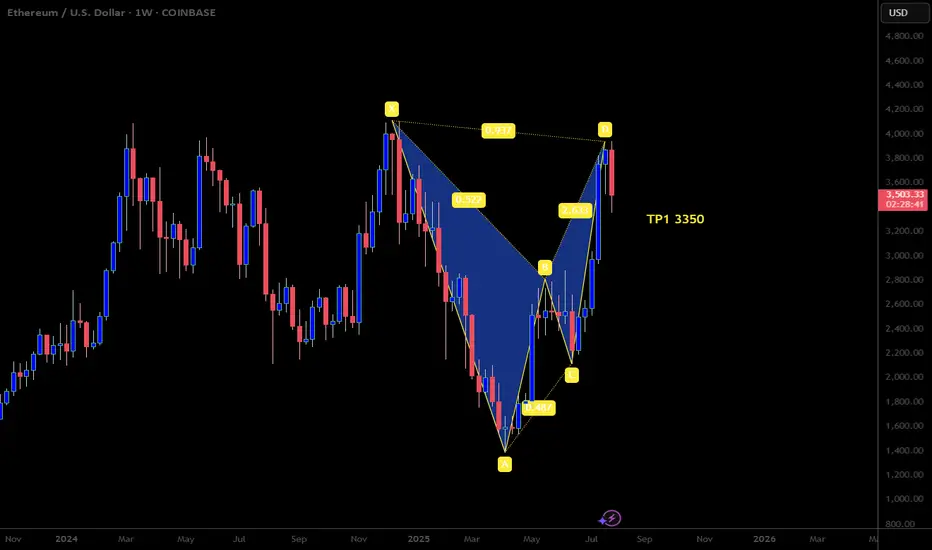
Bearish Bat Pattern on ETHUSDLooking to continue selling here with this beautiful harmonic bat pattern that just formed. We also got a bearish candle close on the weekly timeframe which gives us solid sells confirmation. Happy Trading
BTC Hits Premium Zone – Bearish Reversal Loading? BTC Hits Premium Zone – Bearish Reversal Loading?
🧠 Technical Breakdown:
🔹 1. Previous Market Structure & CHoCH
The chart shows a clear shift in structure (CHoCH) on the left, which marked the start of the bearish leg.
Break of Structure (BOS) confirms continuation of lower highs and lower lows until recent liquidity grab near the $112,551 zone.
Equal highs and liquidity above were taken out, making the move into the Premium Order Block zone highly significant.
🔹 2. Liquidity and Fair Value Gap (FVG) Zones
A major Liquidity + FVG zone was left unmitigated between $113,000–$112,000, and price is likely to revisit it.
This aligns with the target zone at $112,890, which is highlighted as a magnet for price to rebalance the inefficiency.
🔹 3. Order Block & Premium Supply Zone
A well-defined Order Block is marked just below the resistance zone near $115,166–$116,021.
Price is currently retracing into this zone, suggesting a potential reaction point for smart money to re-enter shorts.
Volume is expected to pick up here, and a reversal could initiate if price fails to break above this supply.
🔹 4. Volume Profile and Market Imbalance
Volume clusters are heaviest near the $114,000–$114,300 range, indicating high activity and previous accumulation/distribution.
Thin volume near the $112,551 zone further confirms price may drop quickly if rejection happens.
🔹 5. Support & Liquidity Sweep
Support zone around $112,551 is a previous liquidity pool and weak low that has not been fully cleared.
Price is likely to revisit this zone in the short term to clear liquidity and complete market rebalancing.
🔐 Institutional Narrative:
Smart money engineered a liquidity sweep to the downside, then caused a retracement into premium.
Now, BTC/USD is positioned in a high-risk zone where sell-side institutions may enter to push price lower.
If this order block holds, expect a rejection toward $112,890, followed by possible deeper continuation into the liquidity void below.
📌 Key Levels:
Level Price (USD)
Strong Resistance Zone 115,166 – 116,021
Order Block (Sell Area) 114,800 – 116,000 (approx.)
Immediate Support 113,000 – 112,551
Target (Liquidity Zone) 112,890
Weak Low (Final Sweep) 112,000
📉 Trade Outlook & Strategy:
🔺 If price reacts bearishly at Order Block:
Look for lower timeframe BOS/CHoCH confirmation.
Entry: Short on rejection at or near $115,000–$115,500
Target 1: $112,890
Target 2: $112,000 (extended liquidity sweep)
Stop-loss: Above $116,200 (invalidates bearish OB)
🔻 If price breaks and closes above $116,021 with momentum:
Structure flips bullish, and the OB is invalidated.
Look for long setups on retracement to $114,000 zone.
🧭 Conclusion:
BTC/USD is currently trading within a Premium Zone, testing a strong Order Block below key resistance. Price may face a bearish reaction, targeting the liquidity zone at $112,890. Smart money footprints suggest a potential trap for breakout buyers, and if momentum fades, we can expect a downside reversal to sweep remaining liquidity.

Ripening SellXrp had formed an M formation above, has retest current happen with a huge bullish candle upwards but, if you look to your immediate left-hand side you will see that the level 2.9635 is a point of reversal both with your immediate left-hand and further left.
Time will only tell with the way the candle will close. And if the setup is not invalidated, we project price movi g all the way to 2.2348

SOLUSDT CHART ANALYSİSISTRADING CRYPTO PROFITABLE?
Crypto trading is profitable but only if done correctly. Follow the
steps, strategies, and tips shared throughout our guide, and you will be
in a better position to make profitable trades. And a golden rule:
Plan your trade, trade your plan.
Never Forget: 90/90/90 trading rule.
90% of traders will lose 90% of their account value within 90
days.
1. No matter how much profit you make; what matters is how
much you keep.
2. No matter how much you keep, what matters is how much you
re-invest.
3. No matter how much you re-invested, what matters is your
total return on investment (ROI).

BTCUSD long my predict up to 128100
long possible entry 115150
take profit 128100
stop loss 113000
swing long

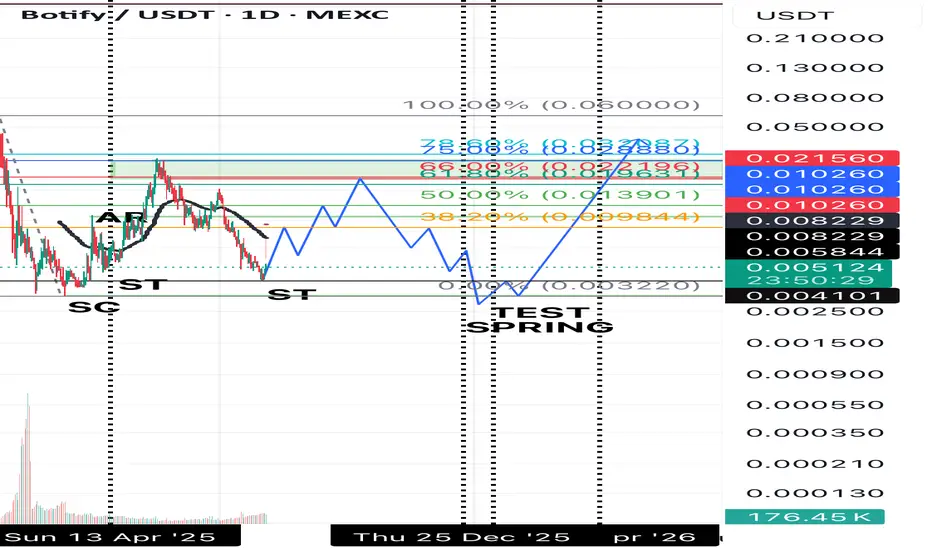
Botify looking good Following the Wyckoff method this is what I would be looking for sell before the massive drop then rebuy for the bull run .
ENS 8H TF - Expect Further Downtrend
▶️ The downtrend is currently held by green support just above 24.00, but there are no signs that the decline is over.
▶️ The move from blue resistance to green support showed strong momentum, suggesting it may be blue wave A of a downside ABC pattern.
▶️ This structure implies that a corrective blue wave B may follow, eventually leading to a blue wave C to the downside.
▶️ The yellow ascending trendline, originating at the April low, is being monitored as a potential target for blue wave C.
▶️ However, it’s too early to confirm this path... further price action is needed to validate the ABC scenario.

Bitcoin Price Outlook: Bull Flag Pattern Hints at Potential BreaBTC price Outlook: Bull Flag Pattern Hints at Potential Breakout Toward $129K
The local format of the corridor is interrupted by a wide, stronger one, based on which one can conclude about a rebound, and it is quite possible that this will happen tomorrow, during the opening of markets and trading
Also on the local BTC chart, this figure forms an incompletely formed "Bullish Flag" pattern, which also indicates growth
Also, this scenario does not contradict my previous analysis, where a global "Head and Shoulders" pattern is emerging on a 5-year time frame
Current price: $114.227
Expected according to the local scenario $123k and the price according to the global "Head and Shoulders" pattern remains within the same limits of $124k or $129k
Low probability of breaking through the $112k level, since this mark is the bottom of the ascending corridor
This analysis is based on the technical pattern and also incorporates AI to provide more accurate results.