PUMP/USDT: Whales Buy the Dip as Price Holds Key LevelBINANCE:PUMPUSDT.P price has taken a steep 18% hit in the last 24 hours, but the 2-hour chart shows BINANCE:PUMPUSDT.P price action clinging to a critical Fibonacci support near $0.00259. The token is still trading inside an ascending channel, hinting that the bullish structure hasn’t fully broken yet.
Whales have been scooping up the dip aggressively, adding 5.4 billion PUMP tokens over the past week (a 35.8% jump in their holdings). Despite retail selling pushing netflows positive intraday, big wallets continue to absorb supply. Daily accumulation is also up 3.2% in the last 24 hours, reinforcing the demand floor near current levels.
Meanwhile, long positions dominate the liquidation setup, with $7.88 billion in longs versus just $3.6 billion in shorts. If BINANCE:PUMPUSDT.P price bounces, a cascade of short liquidations could amplify the recovery rally. But failure to defend $0.00259 risks opening the door to $0.00241, putting bulls on the back foot.
For now, the $0.00259–$0.00260 zone is the make-or-break level. Holding above keeps BINANCE:PUMPUSDT.P price inside the bullish channel, setting up a potential retest of $0.00284–$0.00294. A breakdown, however, could flip sentiment sharply bearish.
Chart Patterns

GBPJPY Will Fall!
HI,Traders !
#GBPJPY has retested a
Horizontal resistance level
Of 198.903 so we are
Locally bearish biased
And from the resistance we
We will be expecting a
Local bearish correction !
Comment and subscribe to help us grow !

#Nifty - Pivot Point: 25031.63Date: 18-07-2025
#Nifty Current Price: 25025
Pivot Point: 25031.63 Support: 24794.06 Resistance: 25270.32
#NiftyUpside Targets:
Target 1: 25376.92
Target 2: 25483.53
Target 3: 25652.99
Target 4: 25822.45
#NiftyDownside Targets:
Target 1: 24686.89
Target 2: 24579.73
Target 3: 24410.26
Target 4: 24240.80
#TradingView #Stocks #Equities #StockMarket #Investing #Trading #Nifty
#TechnicalAnalysis #StockCharts #Finance

Pengu supportLooks like we have had a few runs to the highs from breaks of downward channels. Ended up forming a double top but have found some seemingly strong support levels here at the top end of a previous pennant break.

XAUUSD ANNASIS OUTLOOK BULLISH 1/8/2025 XAUUSD – Trade in Progress
Long from $3,295 – targetting $3,355 / $3,365
+600+ pips potential on extended breakout
Bulls gaining strength above $3,300
Holding with confidence – structure supports it
#XAUUSD #GoldTrade #LiveSetup #TargetPending

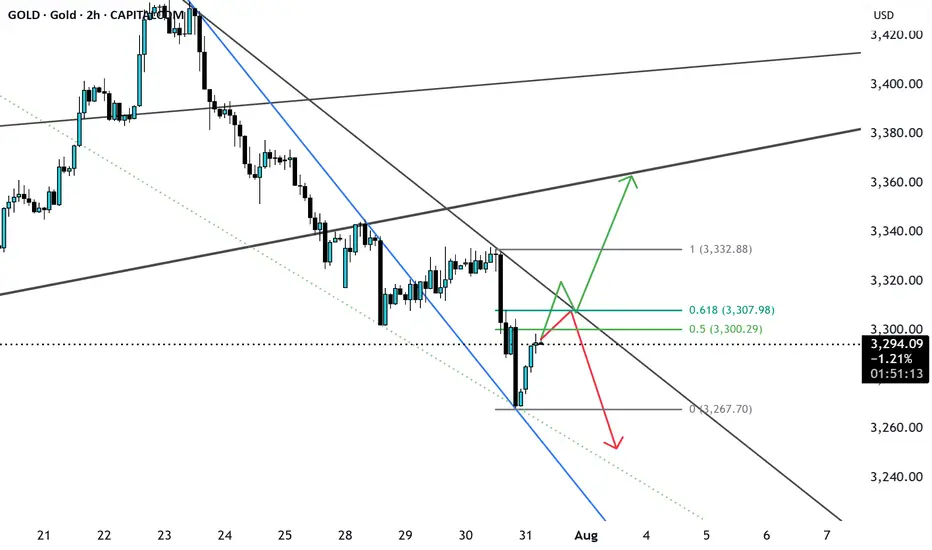
GOLD possible ScenarioCurrently gold has broken a major trendline and currently trading in bearish momentum, currently consolidating or pullback from support and may get rejected from 0.5 or 0.618 if bearish ahs to continue 3240-3250, if breaks the fib level along with trendline resistance can easily price can reach 3340 major resistance level. let us see.
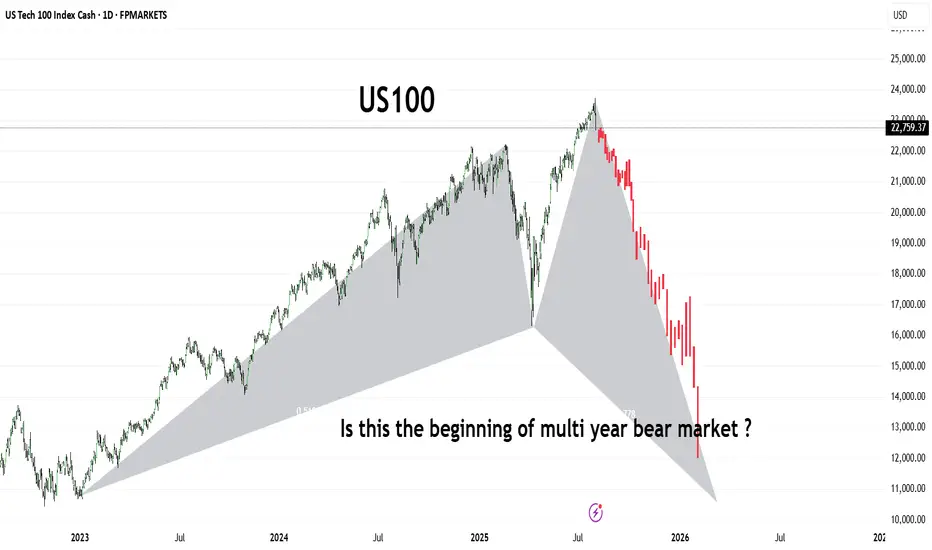
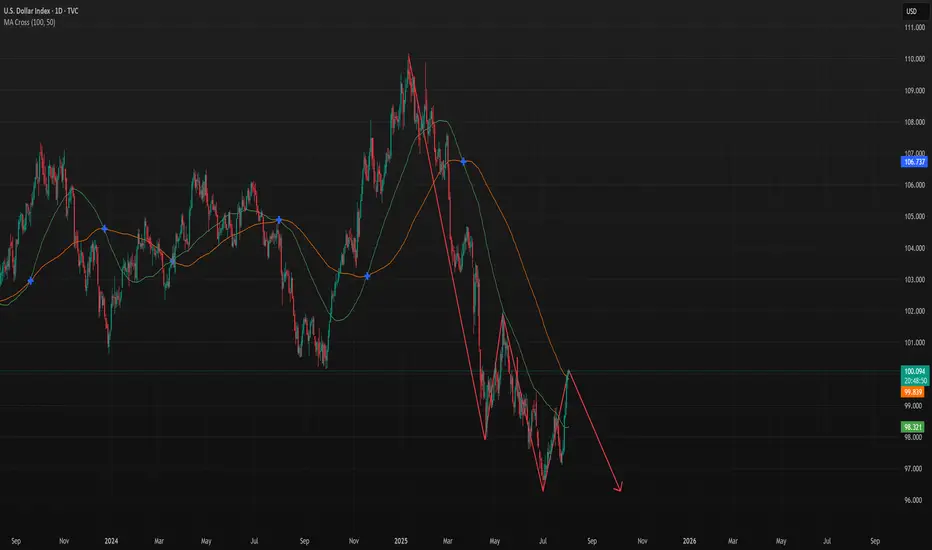
US100The US100 (Nasdaq 100) has shown a dramatic shift in trend, forming what appears to be a large-scale bearish harmonic pattern or potential M-top structure. After reaching its peak in mid-2025, the index has entered a sharp downward trajectory, shedding significant value in a short span.
This chart raises a critical question for long-term investors and traders:
Are we witnessing the early phase of a prolonged bear market that could stretch into 2026 and beyond?
🔻 Key Observations:
Bearish structure developing with aggressive selling pressure.
Potential breakdown from long-term support trendlines.
Momentum suggests institutional risk-off behavior.
Stay alert for macroeconomic cues, interest rate policy, and earnings season signals. A break below 13,000 could confirm a deeper bear cycle
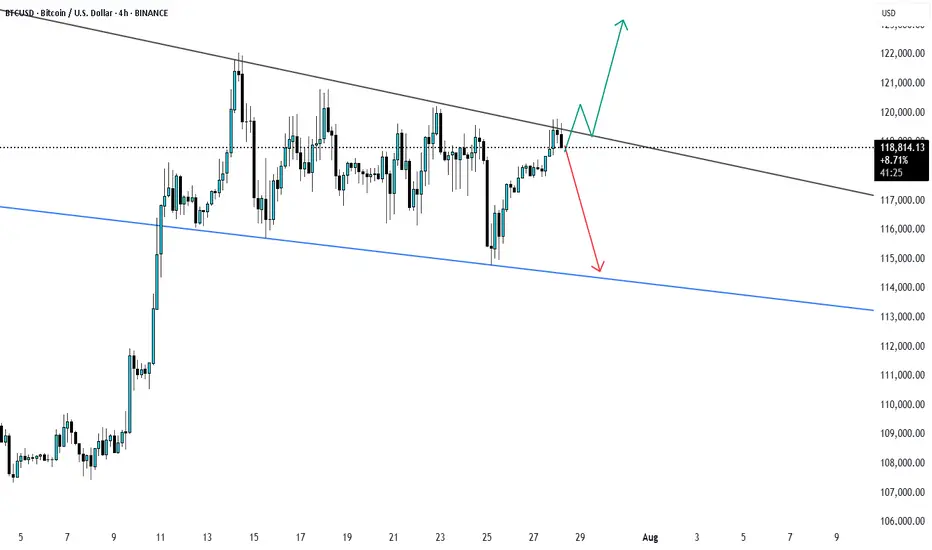
BTCUSD Possible scenario BTCUSD is trading in range bound way and soon may breakout of again go down. Enter buy only on breakout and retest til then bearish will continue.
BTCUSD--SHORT---short term SELL possibility
--entry is around green horizantal line
--TP is around black dotted line which is monthly support

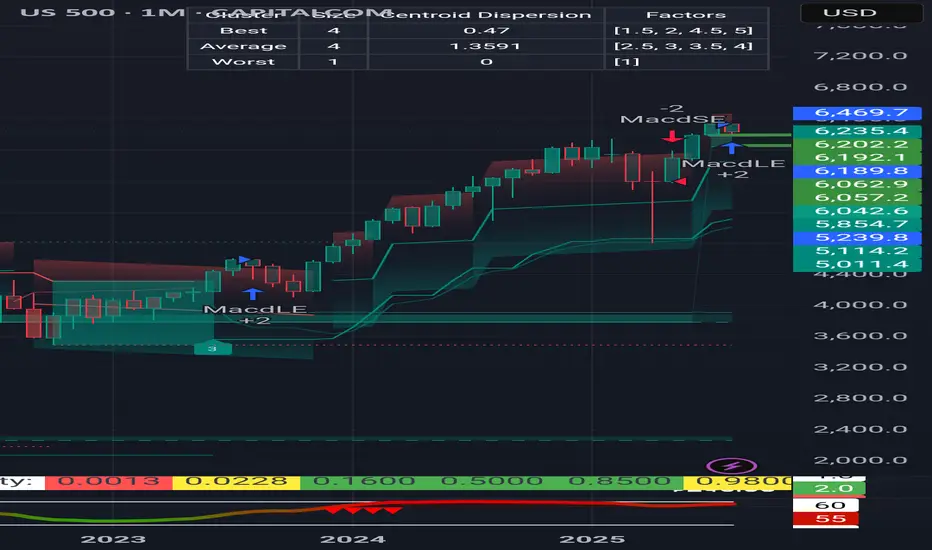
Correction will be to 6050-6190, probably the upper limit Now I notice something very important and things and the analyses of many actually coincide. Monthly support from the accumulated volume lies between 6050 and 6170. 4h indicators show a clear reversal. Separately, at these levels are the previous ATH. In my opinion, it is possible to stop even at 6180-6190. We will probably start with a gap on Monday. Now here comes the moment and over the weekend what will take place as conversations and statements in the media, but it is very likely that the minimum could happen as early as Monday night (USA time) or by Tuesday. I agree that this correction was necessary and should have happened as soon as possible because things became difficult even for bulls like me.
Bitcoin Bull Flag - will it collapse?Bitcoin is currently in a bull flag.
Will it hold — or collapse?
The weekly close will decide.
🔹 If BTC closes above the bull flag support: Possible continuation of the rally.
🔻 If BTC closes below the flag: Expect a deeper correction.
Stay sharp. The weekly close is key IMO.
No FA. DYOR! For educational purpose only.

NZD/USD Holds Above May LowNZD/USD halts the decline from earlier this week to hold above the May low (0.5847), with a move/close above the 0.5920 (61.8% Fibonacci extension) to 0.5930 (78.6% Fibonacci extension) region bringing the 0.6040 (61.8% Fibonacci retracement) to 0.6070 (61.8% Fibonacci extension) zone on the radar.
Next area of interest comes in around the July high (0.6120), but the rebound in NZD/USD may turn out to be temporary if it struggles to trade back above the 0.5920 (61.8% Fibonacci extension) to 0.5930 (78.6% Fibonacci extension) region.
A breach of the May low (0.5847) opens up 0.5830 (38.2% Fibonacci retracement), with the next area of interest coming in around 0.5740 (78.6% Fibonacci retracement) to 0.5760 (100% Fibonacci extension).
--- Written by David Song, Senior Strategist at FOREX.com

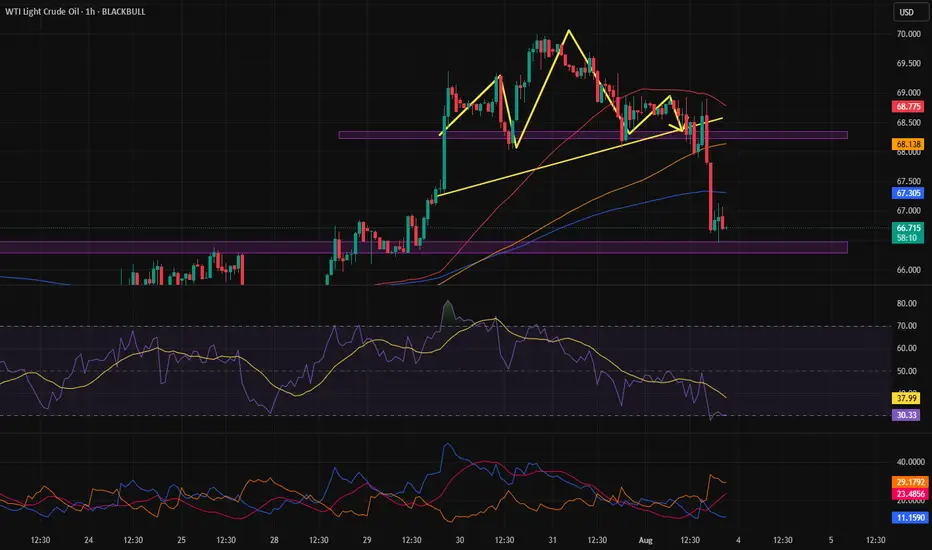
Pattern targetIn the previous analysis, we spotted a head and shoulders pattern and mentioned that if it gets activated, it will hit the pattern target — and that’s exactly what happened.
A clean and beautiful setup.
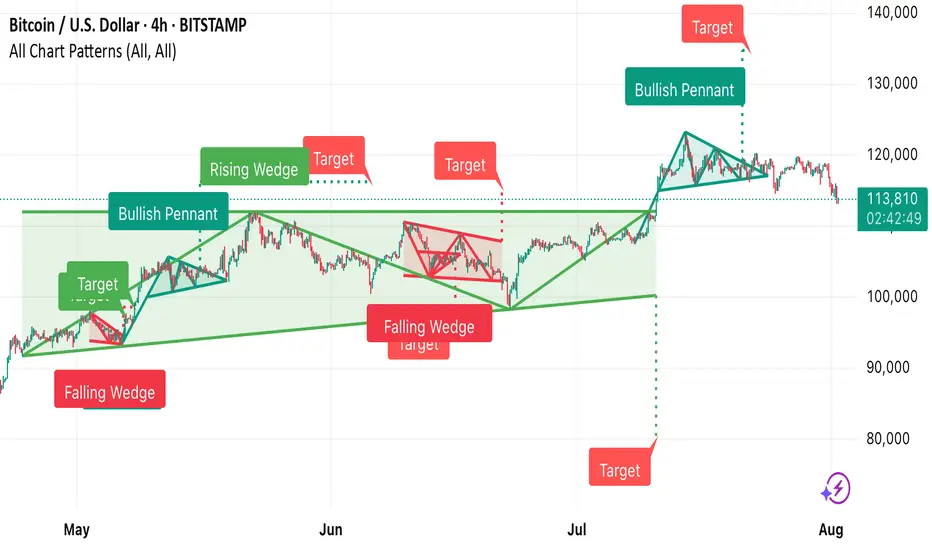
This Bitcoin 4-hour chart from TradingView shows multiple techni • Falling Wedge (early May) → Bullish breakout, target achieved.
• Bullish Pennant → Strong upward continuation.
• Rising Wedge (June) → Bearish breakdown, target met.
• Falling Wedge (mid-June) → Bullish breakout, target achieved.
• Bullish Pennant (late July) → Upward move toward the 140,000 target zone.
Currently, BTC is trading around 113,829, below recent highs, and near the dotted horizontal support zone from the last breakout.
Dow Jones Triple Top & Critical Trendline Break - Buy The Dip?Potential Tripple Top formation spotted on the Dow. This would represent a full fibonacci retracement, which leads me to believe a 38.2 retest is likely. If this 23.6 level can hold support and price does not close below the fib band (orange channel), then the bullish continuation to new all time highs can still happen in Q3/Q4 of this year. The clear trendline break dating back to April is very concerning (white line), leading me to believe more downside in the coming weeks.
Let me know what you think in the comments!
Thanks

GBP/NZD POTENTIONAL SHORT OPPORTUNITYThis is an idea for GBPNZD's potential short opportunity based on what the technicals indicate.
The trend has been emphasising its bullish approach for almost three years.
Price respected almost 11 times due to the strong resistance within 150 days between 2.265 & 2.275 and bounced off bullish OB on the daily chart and FVG on the weekly chart.
An institutional sharp decline on the weekly chart, followed by a clear wedge, can support a further drop once swept by bearish daily OB. A breakout to the micro wedge (orange) within a macro wedge can also help further down move.
Given that a bearish pin bar followed by a bearish doji is a strong warning signal of potential reversal or bearish continuation that appears inside the micro wedge.
TP1 is considered the first support at the bottom, where the daily OB and the weekly FVG meet at around 2.22000 or the area close to the trendline. If the price breaks through the trendline, TP2 and TP3 will be expected to be achieved.
TP2 may be located at the micro accumulation around 2.20000, and TP3 at the following major support around 2.15000-2.17000 that previously acted as both support and resistance.
Good luck and have a great weekend.

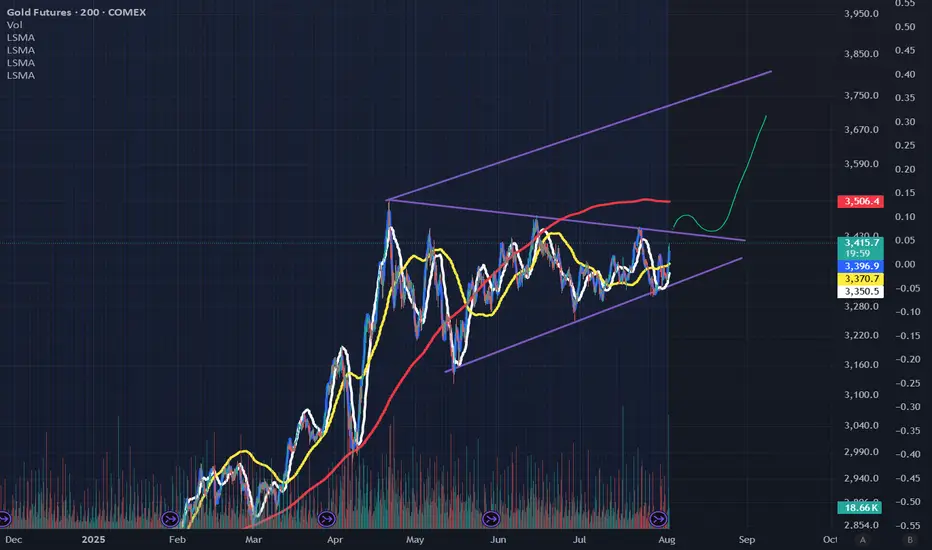
Gold completing a 4-month Bull Flag consolidation, 3800 next! We can see the classic bull flag consolidation pattern which has been going on ever since the stock market decided to go on a rager!
Even with that going on, smart money continues to buy gold on the dips as you should too.
Once Trump installs a phoney new BLS chief and moves to pressure the Fed by nominating a new governor after Kugler's departure the message will be clear:
1) the BLS and the Fed are no longer independent
2) the US dollar is going to tank
3) Gold is going to boom!
Good luck and happy trading!
USDCHFUSD/CHF Bullish Bias — Price is holding above demand with market structure showing higher highs and higher lows. COT data supports continued USD strength. As long as demand holds, expecting further upside towards next resistance.

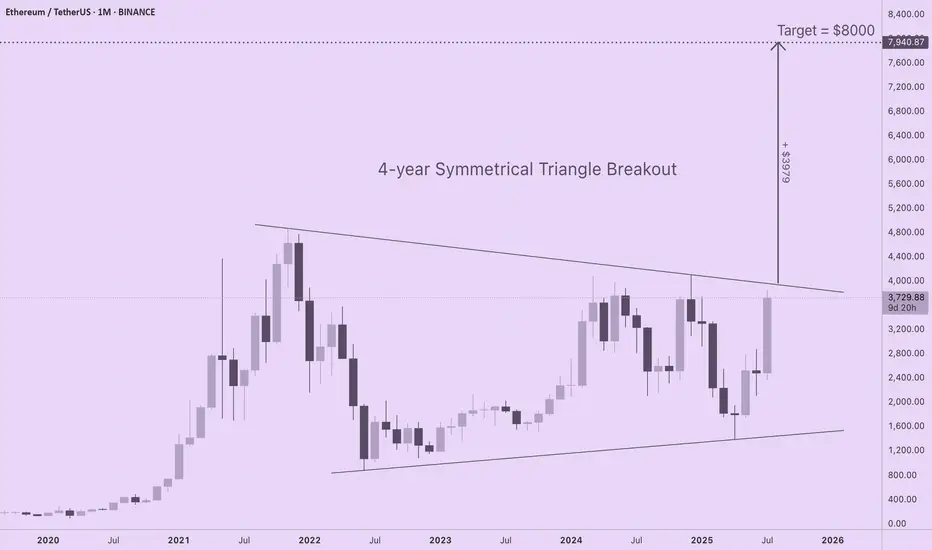
ETH Targets $8000 with 4-Year Symmetrical Triangle BreakoutIf you are seeking realistic ETH price targets based upon solid long-term market structure, check out this 4-year symmetrical triangle forming on the ETH/USD monthly chart. ETH is coiling for a major move to $8000, yet none of the CT "influencers" I follow are talking about this. I am new to technical analysis, so I am interested in learning your thoughts about this pattern and which tools or indicators you prefer for setting price discovery targets.
For those of you new to technical analysis, symmetrical triangle patterns can form on long timeframes (weeks, months, or years), indicating indecision between bulls and bears as price compresses within a continually narrowing range. A breakout from a symmetrical triangle typically follows the direction that preceded their formation, and the longer the consolidation period, the stronger the move.
The chart shows a strong euphoric phase in 2021 followed by a bear market low. Subsequent failure to reach previous ATHs is balanced by a pattern of higher lows. Since ETH was in an uptrend prior to triangle formation, odds are this is a continuation pattern, especially given profound shifts in capital flows and sentiment for the asset over the last several weeks.
With trendlines set at the price extremes, the height of the triangle is roughly $3980. If a breakout occurs at a price of $3960, ETH will target a price of $7940 (height of triangle + breakout price). A more conservative price target of $7000 is obtained by resetting the trendlines at the monthly opening and closing prices (omitting the wicks).
Regardless of the specific method for drawing the triangle, ETH is primed for a major move to the upside that has been four years in the making.
DXY - Possible Down Swing to continue furtherTVC:DXY
CMCMARKETS:USDCAD
OANDA:NZDUSD
CMCMARKETS:EURUSD
We may have a further down swing pattern forming let's continue to see if it passes the resistance area.
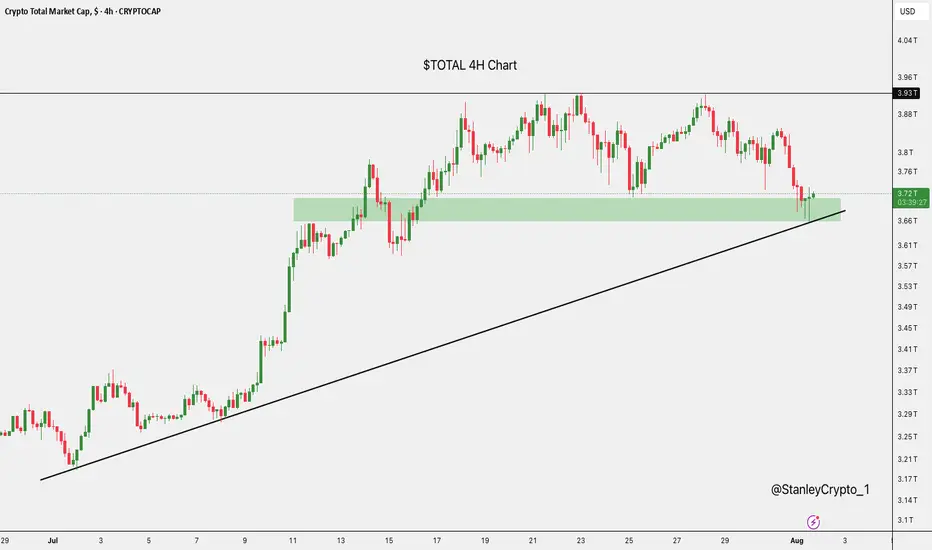
$TOTAL at Key SupportThe crypto market cap has just bounced off a strong support zone around $3.67T, right where it aligns with the rising trendline.
This area has held firm before, and it's doing the same now.
If it continues to hold, we could see a nice recovery.
But if it breaks down, there’s a risk of more downside ahead.
AVAXUSD at Support ? recent brok the resistanceAVAX has recently broken the Support and is likely to reverse from this support area let us see.

Bitcoin Free Value Gaps getting filled - 109 K target >
If you look back at the last time I posted a chart with Free Value Gaps ( FVG ) you will see an orange bar where PA currently sits...The reason it is no longer there is because it ogt "Filled"
It is much the sameidea as CME Gaps. Thay also get filled very often/
So, we can see 2 more FVG before 107K line and so, in the current market state and with the knowledge that in August, Markets often Dip, we may well see PA retreat to the Gap at 109K
What a superb buying oppertunity
End of post as I am enjoying an evening in the south of France, with wine and Fun..
What it stopping you ?
