Quick Bitcoin Analysis – 30-Minute TimeframeQuick Hey friends 👋
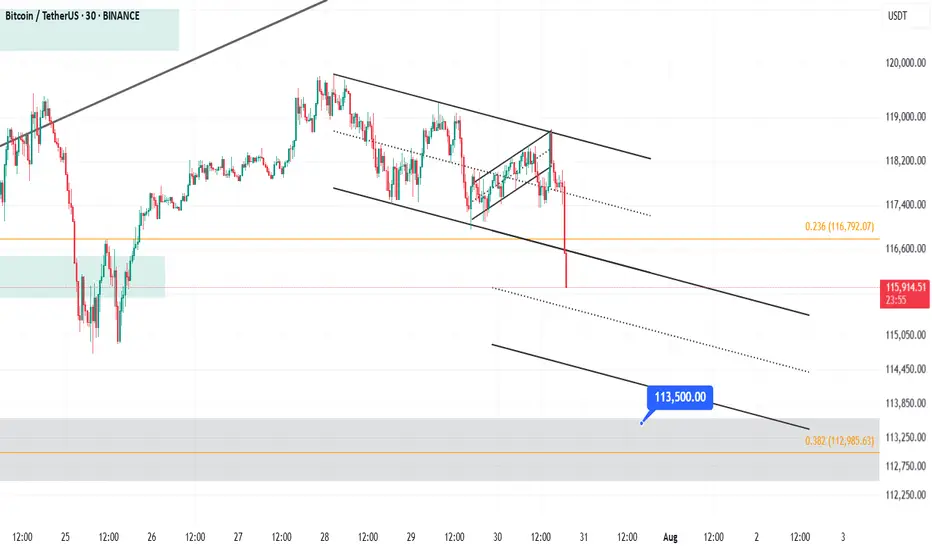
Bitcoin was recently moving inside a weak upward channel on the 30-minute chart. But now, it has broken below the channel with a strong bearish candle. This suggests we’re entering a short-term correction.
🔹 However, don’t forget — the overall trend is still bullish.
This drop looks more like a healthy pullback, not the start of a full downtrend.
🎯 Possible Targets for This Correction:
✅ Target 1: Around $114,500
(This comes from measuring the width of the broken channel.)
✅ Target 2: Strong support near $113,500
(This level has shown solid buyer interest in the past.)
📊 The RSI is also approaching the oversold zone, which means we might see a small bounce or slowdown in the drop soon.
📌 In short:
This is likely just a dip in a bigger uptrend. Be patient, watch key support zones, and don’t rush into trades.
Always stick to proper risk management! 💼
Bitcoin Analysis – 30-Minute Timeframe
Chart Patterns
GOLD CONTINUATION PATTERNHello folks, here we go again, This idea stuck in my head only today and its friday. rather shared it or none, but see the charts for stops and target. this might be your lucky day on my page.
Here is my idea, take it if you love to swing or watch it fade. Congrats were on 800 community or I got more followers because of this. and Previous idea we made a lot thats 1200 pips good for a month trade. lets see this August. my target is labeled this chart first at 3500 zone. next target will be posted on my notes or updated the idea. no charts until it breaks that labeled on chart. until it goes higher again.
You will never see this kind of idea for a month again. So follow on my page, I have some for you if you have small accounts.d m here
My goal is to target the highest TP will be above this new highs.

AUDUSD Technical & Order Flow AnalysisOur analysis is based on a multi-timeframe top-down approach and fundamental analysis.
Based on our assessment, the price is expected to return to the monthly level.
DISCLAIMER: This analysis may change at any time without notice and is solely intended to assist traders in making independent investment decisions. Please note that this is a prediction, and I have no obligation to act on it, nor should you.
Please support our analysis with a boost or comment!

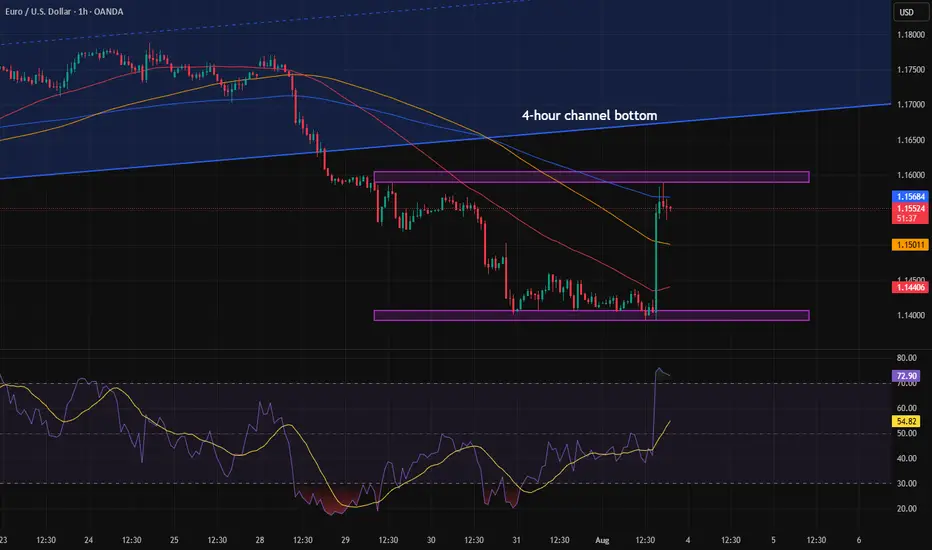
Head & Shoulders on EUR/USD daily!We're currently observing a significant Head & Shoulders pattern forming on the EUR/USD daily chart, with the price just breaking below the neckline on the right shoulder.
Applying standard Head & Shoulders trading principles, we measure the distance from the head's peak to the neckline and project that same range downward from the breakdown point. Based on this, the estimated target price (TP) for the trade lands around $1.135. The stop-loss will be positioned just above the right shoulder to manage risk effectively.
We'll be watching closely to see how this setup unfolds. 🍻

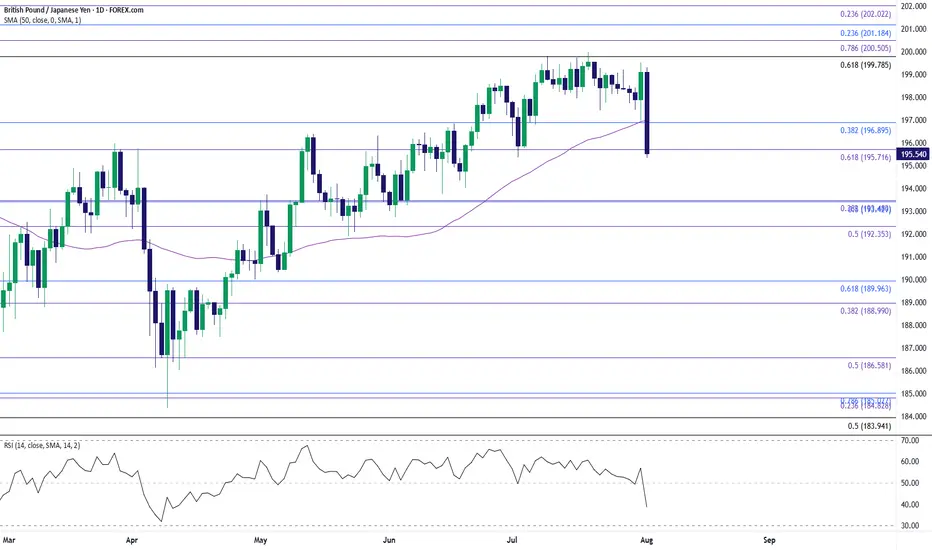
GBP/JPY Clears July LowGBP/JPY clears the July low (195.37) as it tumbles to a fresh weekly low (195.34), and a close below the 195.70 (61.8% Fibonacci extension) to 196.60 (23.6% Fibonacci extension) region may push the exchange rate toward the June low (192.73).
Failure to hold above the 192.40 (50% Fibonacci extension) to 193.50 (38.2% Fibonacci extension) zone may lead to a test of the May low (190.33), but the selloff in GBP/JPY may turn out to be temporary if it defends the rebound from the June low (192.73).
GBP/JPY may attempt to retrace the decline from the July high (199.98) should it hold/close above the 195.70 (61.8% Fibonacci extension) to 196.60 (23.6% Fibonacci extension) region, with a close above the 199.80 (61.8% Fibonacci retracement) to 200.50 (78.6% Fibonacci extension) region opening up 201.20 (23.6% Fibonacci retracement).
--- Written by David Song, Senior Strategist at FOREX.com
HBARSimiliar scenario to BYBIT:BTCUSDT.P just have to wait for the daily close.
I marked out a potential entry are with the red line, which is a 4H order block which COULD be tapped
Again I will update you on my entry ASAP
Do not forget to follow and like, it helps me alot.
Stay blessed

BTC - BIG OPPORTUNITY COMING SOON AGAIN!IF BTC does not hold the current low, 95% probability we will go for the green box. biggest support is around $110.000 guys. Once/should backtested we could see massive opportunity again on altcoins!

Trend decision after the newsAfter the news, the price nearly reached the bottom of the higher time frame channel and paused. We need to see whether the price can break into the channel or not. Personally, I don’t think that will happen. I believe a range will form within the marked zone, and then the price will drop further.
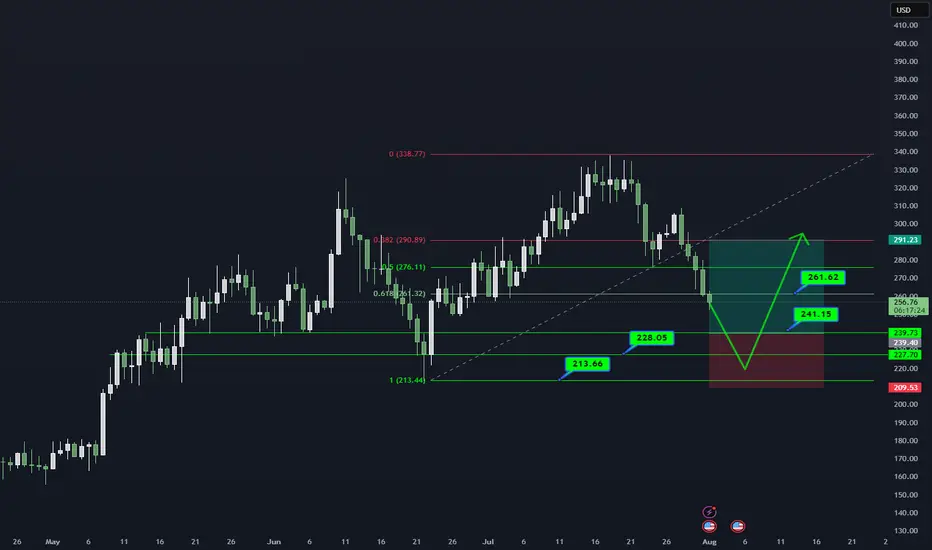
AAVE/USDT DAILY OUTLOOK📊 AAVE/USDT – DAILY TECHNICAL OUTLOOK
🔍 MARKET STRUCTURE
AAVE critical demand zone (241–228) par trade kar raha hai.
Higher timeframe trend bullish jab tak 213 strong base hold karta hai.
📌 KEY LEVELS TO WATCH
Support Zones: 241.15 → 228.05 → 213.66 (Major Base)
Resistance Zones: 261.62 → 291.23
Breakout Confirmation: Daily close above 261 could open path to 291.
🎯 TRADING PLAN (25% SCALING STRATEGY)
Entries ko 25% ke 4 parts me divide karein:
241.15
228.05
220–213 support range
Targets: 261.62 → 291.23
Stop Loss: Daily close below 213
⚠️ RISK MANAGEMENT NOTE
Spot trades safer. Leverage trading = technical gambling.
Capital preservation = long-term survival.
📖 QUOTE
"The big money is made by sitting, not trading." – Reminiscences of a Stock Operator
💬 WHAT’S YOUR VIEW ON AAVE?
Bullish bounce from demand zone or deeper retest ahead?
Share your thoughts in the comments!
#AAVE #CryptoTrading #Altcoins #TradingView #TechnicalAnalysis #CryptoCommunity #RiskManagement #SpotTrading
$ENPH About to make new highs Enphase trades inverse crypto and the crypto trade is coming to a quick end. Stored energy theory states during times of excess energy BTC will thrive. We are now in a new regime of AI energy cost and ENPHASE has the best batteries to scale. Minimum Target $550
Positions
1130 ENPH $50 Calls for 10/17/2025
511 ENPH $100 Calls for 01/15/2027

GBP weakness + USD gaining bullish momentumFX:GBPUSD 🧠 What’s Driving GBP Weakness?
❄️ Cooling Inflation: Slows BoE policy tightening
🔻 Contracting Manufacturing: PMI deep in the red
🛍️ Falling Retail Sales: UK consumers are pulling back
💼 Labor Market Cracking: Recent jobs data may be peak
💣 BoE Dovish Pivot Incoming: Markets are anticipating future cuts in 2025
🇺🇸 USD Strength: Fed holding steady, US macro much stronger than UK
🧭 Extra Confluence: USD Strength
USD is being supported by:
Strong US labor market 🟢
Higher for longer Fed 🟢
Global risk-off sentiment 🟢
Positive divergence in US CPI and Retail Sales 🟢
📌 GBPUSD is not just a GBP short — it’s a USD long play too.
🧩 Historical Price Action Pattern
In 2023 Q3, GBP/USD dropped nearly 700 pips in 6 weeks during similar macro shifts — soft BoE + strong USD.
We may be setting up for a repeat pattern now.
🗣️ What’s Your Take?
Are you looking to short GBP/USD this month?
Where’s your target or trigger zone?
Let’s compare setups ⤵️
I’m sharing more breakdowns weekly — follow for macro + technical convergence trades.

GBPJPY Fundamentally Bearish🧠 Macro-Fundamental Breakdown
🇬🇧 GBP (British Pound)
🔻 GDP Shrinking: UK growth has stalled with below-trend GDP prints 3 quarters in a row.
📉 PMI Weakness: Manufacturing and Services PMIs both under 50 = economic contraction
🧊 Retail Sales Down: UK consumer confidence and demand are cooling
💼 Labor Trouble: Unemployment ticking higher + BoE hinting at peaking rates
🪙 BoE Dovish Pivot?: Market now pricing possible cuts into early 2025.
🇯🇵 JPY (Japanese Yen)
🟢 Inflation is ticking higher
🔄 BoJ is cautiously shifting from ultra-loose policy
🛡️ Yen often strengthens in risk-off environments (which aligns with current market volatility)
🇯🇵 Tokyo CPI surprises have reinforced JPY support

CIRCLE Stablecoin Revolution Circle is more than a crypto firm—it’s building infrastructure for a regulated digital dollar economy. With transparent reserves, global licenses, deep financial integrations, and robust blockchain functionality, USDC is rapidly positioning itself as a cornerstone of future finance.
I see a longer term potential for a great investment opportunity given the coming banking revolution involving stable coins.
For a lower risk entry, after a nearly 40% decrease in less than a week, the stock price is currently supported at the VWAP from the original IPO release.
Should the trend continue higher, I would prefer to see a bounce here on the stock.

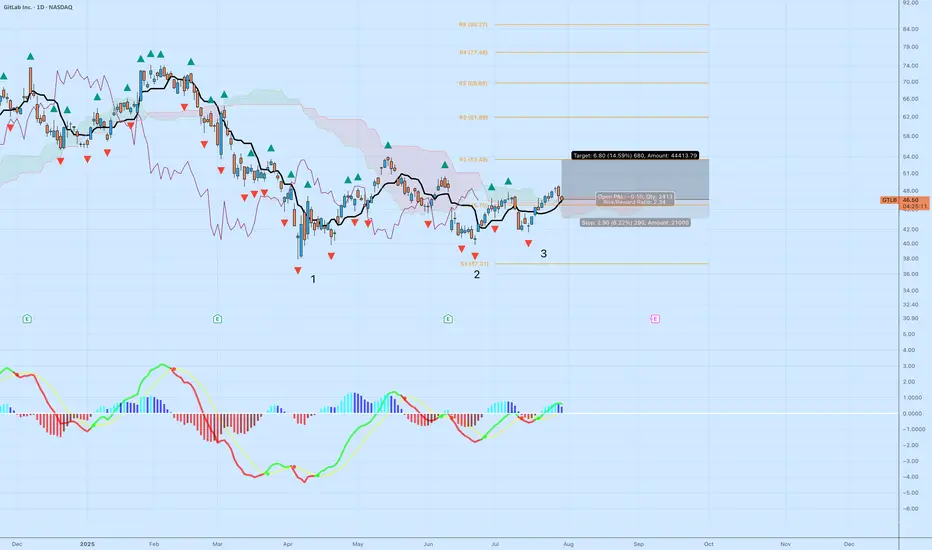
GTLB | Triple Bottom ReversalGitLab (GTLB) is setting up for a potential trend reversal following a textbook triple bottom pattern and a clean breakout above the cloud. Here's the technical breakdown:
Why This Setup Matters
Triple Bottom Pattern: Reversal structure is clear with three defined lows at ~$38, ~$40, and ~$41. The most recent leg up confirms buyers defending that zone.
Ichimoku Cloud: Price has broken above the Kumo with bullish Tenkan-Kijun cross. The leading span A is pointing up, and the cloud ahead is flat and thin — ideal conditions for continuation.
MACD Momentum: Histogram flipped positive again with green signal line crossover — a momentum shift from accumulation to breakout phase.
Trade Parameters
Entry: $46.53
Stop: $43.63 (below Tenkan and the neckline zone)
Target: $53.33
Risk:Reward Ratio: 2.34
Projected Move: +14.59%
Additional Confluence
Daily closes above cloud show growing strength from buyers.
Each bottom was followed by increasing MACD strength — a bullish divergence over time.
Pivot zone at R1 ($53.49) aligns with the price target, adding structure to the exit plan.
Risk Notes
Failure to hold $46 with volume could invalidate the breakout — watch for a retest.
If price closes below Tenkan, reevaluate the setup for weakness.
Volume confirmation needed on the next daily candle for strong conviction.
This is a technical breakout aligned with pattern recognition and trend metrics. Ideal for swing setups with controlled downside.
Gold Approaches Key Reversal Zone After Liquidity Sweep.Gold has recently broken out of a parallel channel during the New York session, followed by a strong upward move triggered by the NFP (Non-Farm Payroll) news event. Currently, the market is trading near a key trendline resistance zone. In this area, the price has also swept the liquidity residing above recent highs, indicating that potential buy-side liquidity has been taken out.
This level now becomes critical for observation. If the market forms a Market Structure Shift (MSS) or provides any valid bearish confirmation — such as a strong rejection candle, bearish engulfing, or a break of lower timeframe support — then there is a high probability that a downward move may follow from this zone.
As always, conduct your own research (DYOR) and wait for price action to confirm the bias before executing any trades. Acting on confirmation rather than assumptions protects both capital and strategy.

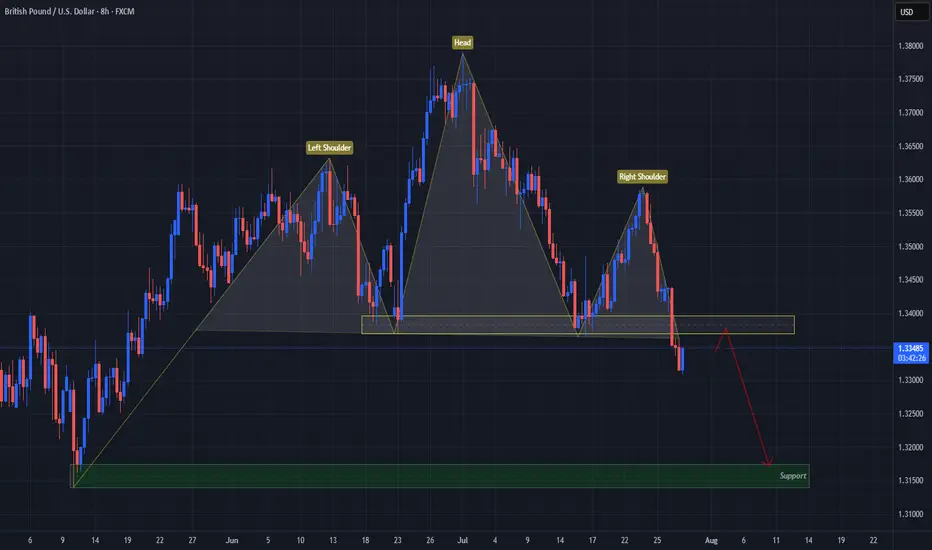
USD Turns GBP On Its "Head"FX:GBPUSD has formed a Head & Shoulders Pattern!
Price has already broken down below the "Neckline" to Confirm that Pattern.
Currently, Price is working its way back up to retest the Breakout and if the level is strong enough and holds, we could see Price follow through with its reversal to lower prices!
If the retest is successful, the May 12th Lows of 1.31741 - 1.31394 could be a good Support level to set as a Price Target.
Now we wait for a Retest!
HYPE - a major correction can be expected One of the most interesting tokens of the HYPE cycle. It initially fell to zero, then rebounded and began to set new all-time highs one after another. During corrections, it even outperformed Bitcoin.
But all good things come to an end sooner or later, and for HYPE, the time has probably come to cool down, and here's why:
➡️ HYPE broke its ascending flag pattern for the first time in four months, signaling a potential trend reversal.
➡️ Throughout the last month, HYPE's growth has been accompanied by a divergence in purchase volumes, indicating declining interest from buyers.
➡️ Money Flow, although in harmony with the scene, began a major fix of positions at the last ATH of $51, and in just a couple of days, the indicator fell into negative territory. Potentially breaking through its sloping support.
➡️ The main areas of interest are at the top, apparently attracting limit orders for shorts. And the first major support level has already been broken at $40.
➡️ The next major support is at $30, where we can expect an upward rebound.
📌 Conclusion:
HYPE has been growing for a very long time, against all odds, against the entire market. And the moment had to come when profit-taking would begin. $50 is a major psychological level, and liquidity has begun to leak out noticeably.
So perhaps this stage is already upon us. But I would not rush to look for buying opportunities, even on the spot. The token is very young, and we do not yet know its real price; it has been both $50 and $9. It is worth giving it time to trade so that we can find out its fair price over time.
Good health and big profits to all! 🔥

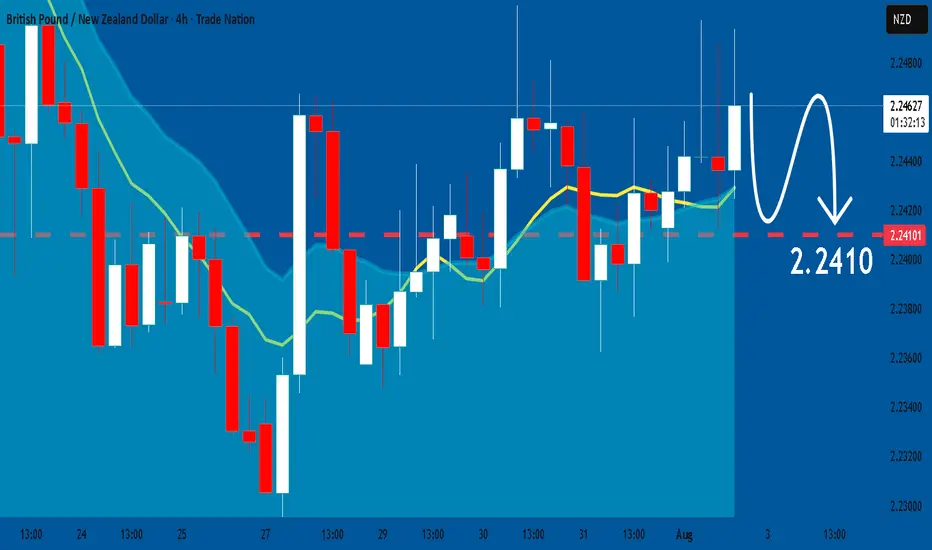
GBPNZD: Will Keep Falling! Here is Why:
The charts are full of distraction, disturbance and are a graveyard of fear and greed which shall not cloud our judgement on the current state of affairs in the GBPNZD pair price action which suggests a high likelihood of a coming move down.
Disclosure: I am part of Trade Nation's Influencer program and receive a monthly fee for using their TradingView charts in my analysis.
❤️ Please, support our work with like & comment! ❤️
Gold Market Holds Bearish Structure Below 3291Gold market continues to hold firm within the bearish channel, with 3291 acting as a supply zone, maintaining pressure down toward 3269. As long as this zone remains unbroken, bearish momentum stays in play.
🔍 Key Insight:
3291 = active supply resistance
3269 = short-term target if sentiment holds
follow for more insights , comment and boost idea

Daily Bitcoin AnalysisBitcoin is at support at $115,000. Personally, I think this support will not hold and it will reach the next level of 112,000. Why? Because the downward momentum of the price is high.
This is not financial advice

BNB/USDT 4H Chart: Rising Channel with Fractal Vibes!Hey traders! Binance Coin is showing some promising action that’s got me on the edge of my seat!
We’ve got a clear rising channel in play, with BNBUSDT moving beautifully in sync with a fractal line pattern shown above the chart — mirroring past price behavior like a roadmap! BNBUSDT is currently trading at $650 , I think price will continue bouncing between the channel’s support at $620-$600 and move upwards to the key resistance target at $700-$720 . A breakout above this resistance could send BNB soaring to new highs, potentially targeting $800 or beyond!
However, if BNB fails to break through, we might see a pullback to the channel support at $620-$600 .
Key Levels to Watch:
Resistance: $700-$720
Support: $620-$600
Breakout Target: $800+
Breakdown Risk: $600
Is BNB about to blast through $720, or will it retreat below support? Let’s hear your thoughts below!

Microvision Inc (MVIS).Stock on triggering Explosive Level.
🦈 Shark Harmonic shap Target price above 14$ .
Any breaking up Resistance level 1.21$ , Buying signal triggering, Explosive level = 1.95$
Highly recommended for Buying now 👌

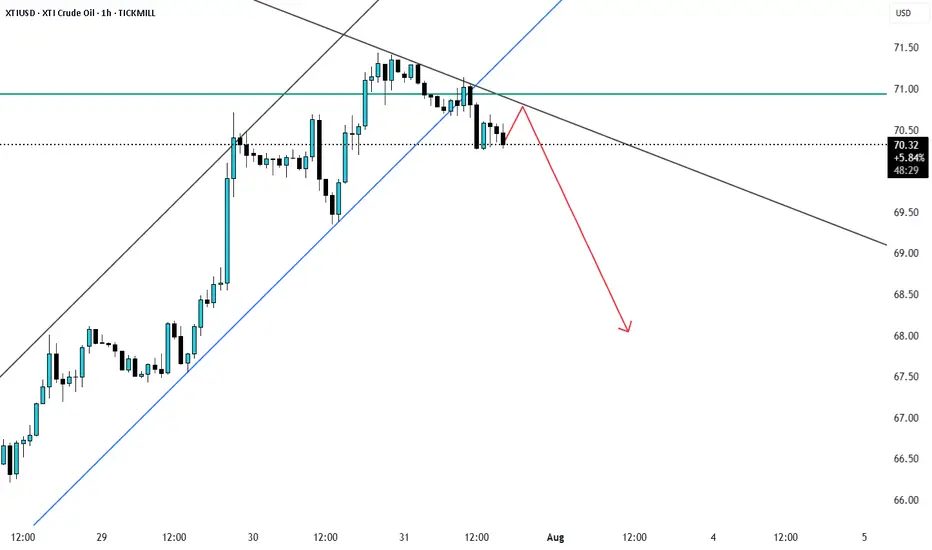
XTIUSD rejection from fib 0.5 XTIUSd recently pulled back to fib0.5 level and is currently looks to be reversering as support trendline broke and price may reject from here.