Latest Gold Price Update TodayHey everyone! Let’s take a closer look at what’s happening with gold today.
Over the past week, the global gold market experienced dramatic swings. Prices tumbled following cautious remarks from Federal Reserve Chair Jerome Powell, only to rebound sharply after disappointing U.S. employment data.
On Wednesday, the Fed held interest rates steady, and Powell stated, “We haven’t made any decisions for September.” Though brief, that statement hinted that a rate cut isn’t guaranteed — dashing investor hopes and sending gold to its lowest level in four weeks.
But by Friday, the narrative flipped. A weaker-than-expected jobs report triggered a powerful rally. Within just two minutes of the data release, gold surged by $30, closing the week at $3,361 — a gain of over 2% in a single day.
These moves highlight just how sensitive gold is to Fed signals. A slight shift in tone or a single data point can spark major volatility.
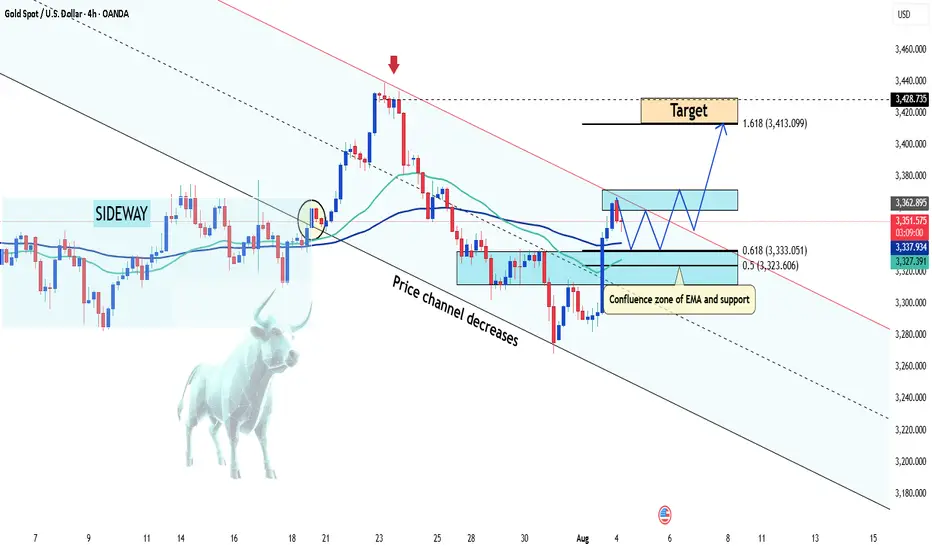
From a technical perspective, falling U.S. Treasury yields have allowed XAU/USD to regain bullish momentum, as the market reassesses Fed rate expectations after the weak NFP print. If gold successfully breaks out of its current channel after a short-term pullback, the next target could be $3,400 — or even higher.
Do you agree with this outlook? Share your thoughts in the comments.
Good luck and happy trading!
Chart Patterns
GOLD, BTC analysisWe saw a meaniful directional on our fav asset, after doing a thorough top down analysis, we looking to long BTC and Short Gold.


ETH/USDT – Bullish Reversal Potential from Fibonacci Confluence 💡 Idea:
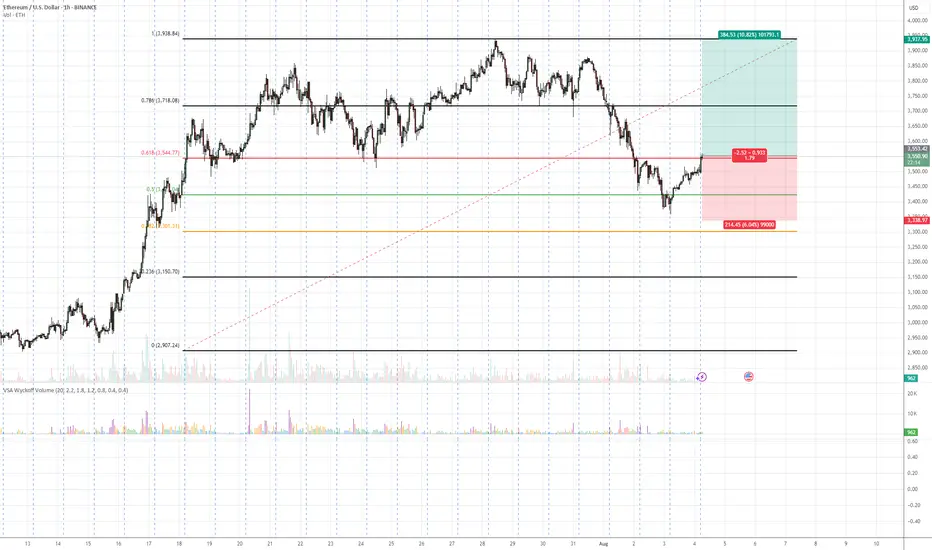
Ethereum is showing signs of demand absorption at a critical Fibonacci support cluster (0.5 – 0.618 retracement). VSA patterns confirm that selling pressure is being absorbed, hinting at a possible markup toward previous swing highs.
📍 Trade Setup:
Entry: Current levels near 3,551
Target: 3,937 (+10.82%)
Stop Loss: 3,338 (below last absorption zone)
R:R Ratio: ~1.79:1
📊 Technical Reasoning (VSA)
1. Stopping Volume at Fibonacci Support
ETH tested the 0.5–0.618 retracement zone from its prior bullish impulse.
Wide spread down-bars on high volume failed to produce significant downside progress, signaling professional buying.
2. No Supply Confirmation
Following the stopping volume, the market printed narrow range candles on decreasing volume, indicating supply exhaustion.
3. Demand Emergence
The recent push above short-term resistance came with increasing volume and wider up-bar spreads, suggesting the start of an accumulation-to-markup transition.
4. Structure & Fibonacci Confluence
Current rally aligns with the Fibonacci golden zone and past structural support.
📌 Trading Plan:
Enter on confirmed breakout above minor resistance with volume expansion.
Scale out partial profits near 3,800 and let remainder ride toward 3,937.
Keep stop below 3,338 to avoid being shaken out by false breakouts.
XAUUSD OUTLOOK BEARISH MOVE POSSIBLE 4/8/2025 XAUUSD Bearish Trade
Sell: $3363 → Hit: $3345
+180 pips secured – next target: $3335
Clean move, no noise
#XAUUSD #IntradaySell #GoldTrade

XLMUSDT 1H Market OutlookBINANCE:XLMUSDT
Trade Setup:
Target 1: 0.4513
Target 2: 0.4872
Target 3: 0.5231
Target 4: 0.1808
Stop Loss: 0.3795
Pattern: The chart indicates a "CHOCH" (Change of Character) pattern, suggesting a potential trend reversal or continuation depending on context.
Trend: Recent price action shows an upward movement after a dip, with the price approaching the entry level.

XAU? August
Hi
Last week Gold broke Trendline.
My plan : selling throughout this month.
Likely. Spike up >>> Testing of 3352 (range)
is a retest , make we think it's an uptrend.
So, I did asked AI ( on volatility & timing-)
Below are AI answers: (Malaysia time)
3 Aug 6 PM 35points
5 Aug 4 PM 37points
7 Aug 6 PM 40points
The rest need to figure, direction of the day.
the rest is your SL
All the best
Not a guru (>>> maybe AI is one :)

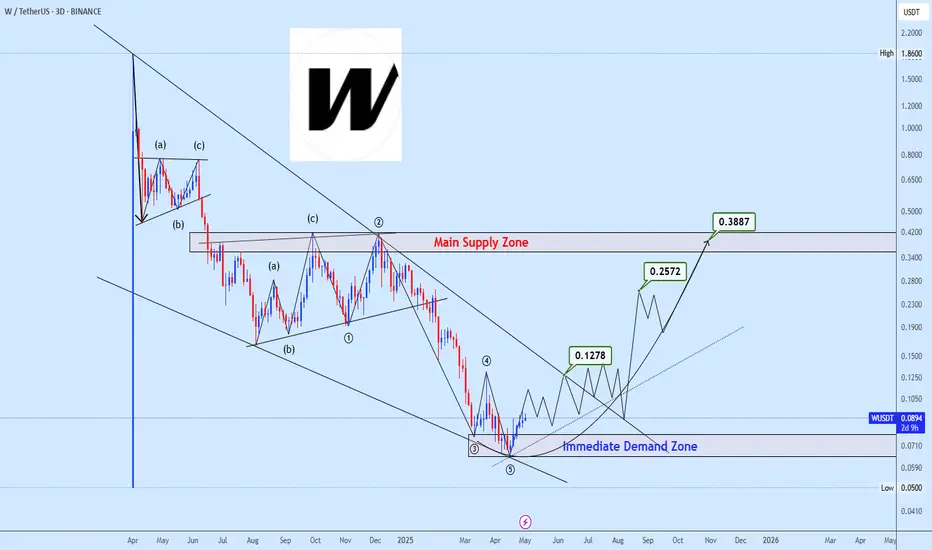
Bullish Setup Spotted on WUSDT Key Demand Zone in PlaySpotted potential falling wedge formation, a classic bullish reversal setup that has now completed its five-wave structure with a breakout from the lower trendline.
Focus remains on the Immediate Demand Zone as a critical area for re-accumulation. The projected path suggests steady bullish progression with price targeting 0.1278, then 0.2572, and ultimately 0.3887.
Main Supply Zone around the final target is the key level to watch for any major trend reversal or breakout continuation.


August 4, 2025 - XAUUSD GOLD Analysis and Potential OpportunitySummary:
Gold is currently in a sideways-to-bullish structure. Strong resistance remains around 3440–3450; if this level fails to break, it offers a high-probability shorting opportunity. Near-term focus is on the 3350 support level — if it breaks, bearish momentum may pick up and selling the pullback becomes ideal. If 3350 holds, consider buying the dip and targeting a test of 3375. Stay flexible and responsive to price action at key levels. Manage risk accordingly.
📍 Key Levels to Watch:
• 3400 – Resistance
• 3384 – Resistance
• 3375 – Key resistance
• 3365 – Resistance
• 3350 – Psychological level
• 3345 – Support
• 3334 – Key support
• 3323 – Support
• 3310 – Support
📈 Intraday Strategy
SELL if price breaks below 3350 → target 3340, then 3334, 3323, 3315
BUY if price holds above 3365 → target 3370, then 3375, 3384, 3394
👉 If you find this helpful or traded using this plan, a like would mean a lot and keep me motivated. Thanks for the support!
Disclaimer: This is my personal view, not financial advice. Always use proper risk control.

EURUSD seems back on track for long continuation.Price did tap into a bigger liquidity pool at around 1.142 and showed a strong change in momentum with an impulsive move to the upside. Price is now in a consolidation phase and left a small Liq.Point at 1.1516, which could act as a base for a continuation structure. The longer it takes for price to tap into said area, the better. I am now looking for a minimum of a 2-touch bullish continuation to enter a long trade into the previous highs.
*** **** *****
👉 The pairs I publish here are usually discussed in detail in my Weekly Forex Forecast (WFF) and are now showing further developments worth mentioning.
Remember, technical analysis is subjective; develop your own approach. I use this format primarily to hold myself accountable and to share my personal market views.
⚠ Ensure you have your own risk management in place and always stick to your trading plan.
*** **** *****

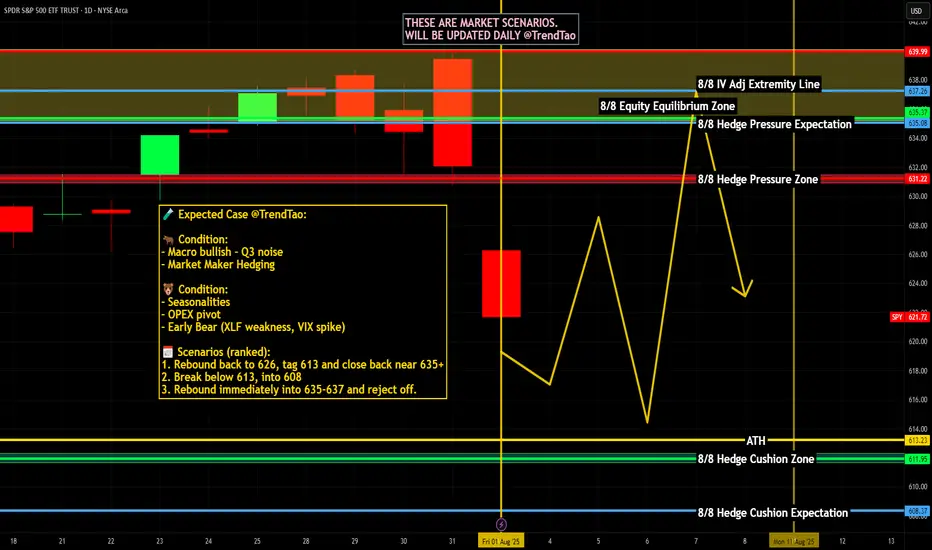
Weekly $SPY / $SPX Scenarios for August 4–8, 2025🔮 Weekly AMEX:SPY / SP:SPX Scenarios for August 4–8, 2025 🔮
🌍 Market-Moving News 🌍
📦 U.S. Tariffs Finalized as August 7 Deadline Nears
President Trump’s administration confirmed newly finalized tariff rates—ranging from 10% to over 40%—on dozens of countries, set to take effect starting August 7. The announcement has heightened global trade uncertainty and injected volatility into equity markets
📉 Weak Jobs Data Spurs Concern
July’s nonfarm payrolls came in at just 73,000 jobs added, far below expectations, while revisions to May and June data subtracted a combined 258,000 jobs. In response, the administration fired the Bureau of Labor Statistics head, escalating political risk around economic transparency
📈 U.S. Shows Resilience Amid Policy Chaos
Despite the tariff-era turbulence and labor softness, U.S. Q2 GDP rose by 3%—outperforming forecasts. Businesses racked up inventory as a hedge, absorbing initial price shocks. Still, concerns about sustained inflation pressures and waning consumer confidence linger
🎯 Earnings Week Spotlight on Tech & Industrial Names
Major companies reporting include Palantir (Monday), AMD, Uber, Disney, McDonald’s, Gilead, Pfizer, Constellation Energy, and Eli Lilly. Markets will watch for AI signals, consumer demand, and industrial trends
📊 Key Data Releases & Events 📊
📅 Monday, August 4
Factory Orders (June) — Critical for industrial demand and trade momentum.
📅 Tuesday, August 5
ISM U.S. Services PMI (July) — Thermometer for expansion in the biggest part of the economy.
S&P U.S. Services PMI (July, flash) — Preliminary signal on service-sector strength.
Trade Balance (June) — Watching for impact of tariffs and shifting cross-border flows.
📅 Thursday, August 7
Initial & Continuing Jobless Claims — Weekly labor-market readings post weak payroll report.
Productivity & Labor Costs (Q2) — Reflect business efficiency and wage trend shifts.
Wholesale Inventories (June) — Key for supply-chain and inventory cycle insights.
Consumer Credit (June) — Measures household borrowing resilience.
📅 Friday, August 8
Fed Speech: St. Louis Fed President Musalem — Market-watchers will look for cues on the near-term rate path.
⚠️ Disclaimer:
This weekly outlook is for educational and informational purposes only and should not be construed as financial advice. Always consult a licensed financial advisor before making investment decisions.
📌 #trading #stockmarket #economy #tariffs #jobs #earnings #inflation #Fed #technicalanalysis
Adding to our first bitcoin sell position now We are adding to our first sell position on bitcoin because we are to see more sell off from here

JUST HODL IT BITCOINTrendline breakout from 2017 and 2021 local highs has occurred and is being retested

BUY USDCHF for divergence bearish trend reversal STOP LOSS: 0.7BUY USDCHF for divergence bearish trend reversal STOP LOSS: 0.7937
Regular Bullish Divergence
In case of Regular Bullish Divergence:
* The Indicator shows Higher Lows
* Actual Market Price shows Lower Lows
We can see a strong divergence on the MACD already and There is a strong trend reversal on the daily time frame chart.....
The daily time frame is showing strength of trend reversal from this strong level of Support so we are looking for the trend reversal and correction push from here.....
TAKE PROFIT : take profit will be when the trend comes to an end, feel from to send me a direct DM if you have any question about take profit or anything...
Remember to risk only what you are comfortable with...

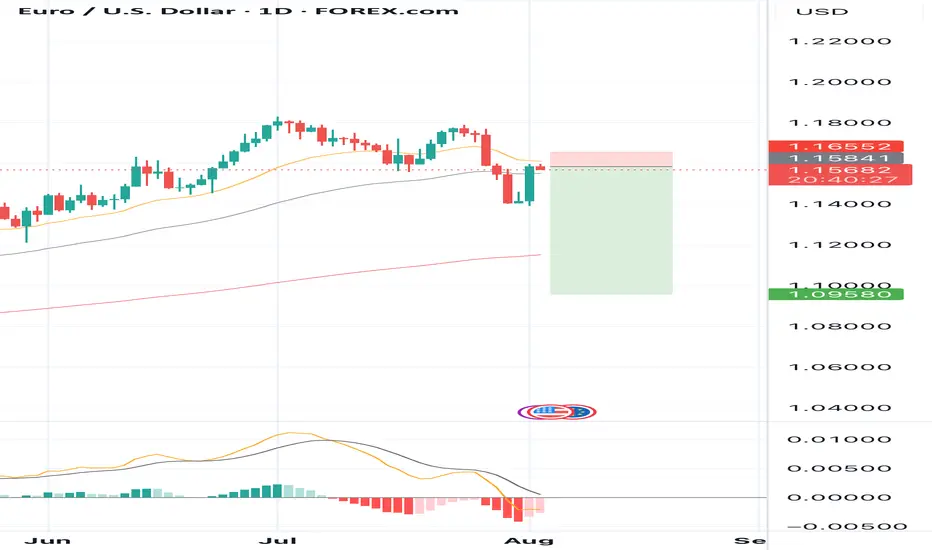
SELL EURUSD for bullish divergence trend reversal STOP LOSS: 1.1SELL EURUSD for bullish divergence trend reversal STOP LOSS: 1.1655
Regular Bearish Divergence
In case of Regular Bearish Divergence:
* The Indicator shows Lower Highs
* Actual Market Price shows Higher Highs
We can see a strong divergence on the MACD already and There is a strong trend reversal on the daily time frame chart.....
The daily time frame is showing strength of trend reversal from this level resistance so we are looking for the trend reversal and correction push from here .....
TAKE PROFIT: take profit will be when the trend comes to an end, feel from to send me a direct DM if you have any question about take profit or anything
Remember to risk only what you are comfortable with........
BTCUSD going to touch 116,800BITSTAMP:BTCUSD Long trade, with my back testing of this strategy, BTCUSD need to touch 116,800
This is good trade, don't overload your risk like greedy, be disciplined trader, this is good trade.
Use proper risk management
Looks like good trade.
Lets monitor.
Use proper risk management.
Disclaimer: only idea, not advice

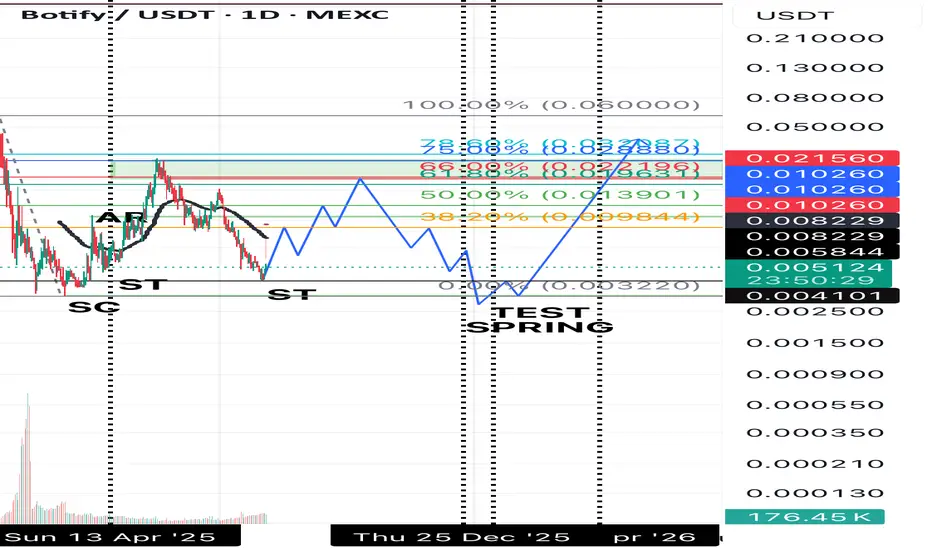
Botify looking good Following the Wyckoff method this is what I would be looking for sell before the massive drop then rebuy for the bull run .
ETC Bull DivsHidden bill divs established, MA, and fib support currently holding. Nice reversal setup.

GBPUSD showing clear downtrend - 4HMarket structure still bearish on GBPUSD
making consistent Lower Highs and Lower Lows
Price just bounced back near previous support area, now acting as resistance.
Planning to short from this zone, expecting downtrend to continue
Timeframe: 4H
Entry: 1.33068
Stop Loss: 1.36220
Take Profit: 1.29864
1:1 RR looks good with trend direction
This is just my personal view, not any financial advise

EURCAD Long CorrectionOANDA:EURCAD Long trade, with my back testing of this strategy, it hits multiple possible take profits, manage your position accordingly.
This is good trade, don't overload your risk like greedy, be disciplined trader, this is good trade.
Use proper risk management
Looks like good trade.
Lets monitor.
Use proper risk management.
Disclaimer: only idea, not advice
