Chart Patterns

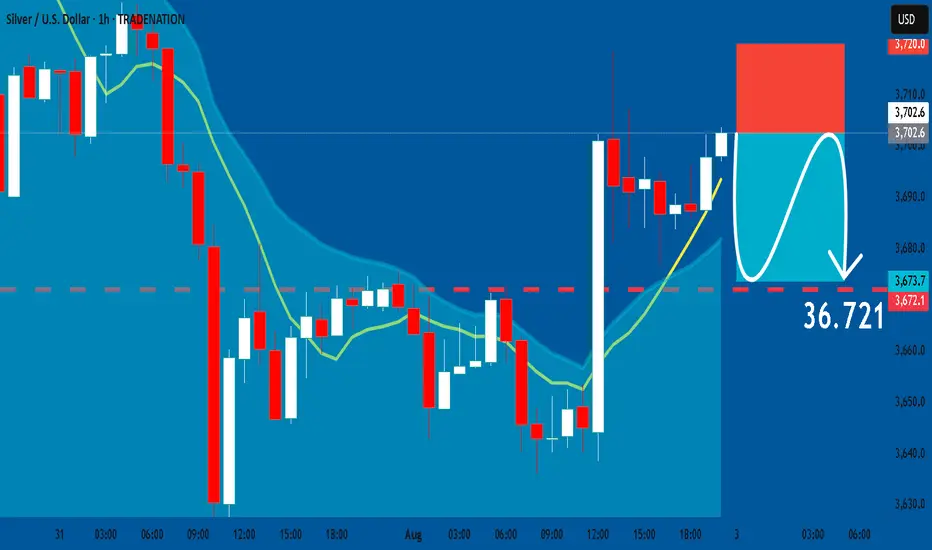
SILVER: Short Trade with Entry/SL/TP
SILVER
- Classic bearish formation
- Our team expects pullback
SUGGESTED TRADE:
Swing Trade
Short SILVER
Entry - 37.026
Sl - 37.200
Tp - 36.721
Our Risk - 1%
Start protection of your profits from lower levels
Disclosure: I am part of Trade Nation's Influencer program and receive a monthly fee for using their TradingView charts in my analysis.
❤️ Please, support our work with like & comment! ❤️
EURUSD Trading Opportunity! SELL!
My dear followers,
This is my opinion on the EURUSD next move:
The asset is approaching an important pivot point 1.1585
Bias - Bearish
Technical Indicators: Supper Trend generates a clear short signal while Pivot Point HL is currently determining the overall Bearish trend of the market.
Goal - 1.1497
About Used Indicators:
For more efficient signals, super-trend is used in combination with other indicators like Pivot Points.
Disclosure: I am part of Trade Nation's Influencer program and receive a monthly fee for using their TradingView charts in my analysis.
———————————
WISH YOU ALL LUCK

ETH 4H – MACD Histogram Caught The 54% Increase, Did You?The MACD Liquidity Tracker Strategy doesn’t just catch trends — it shows you how strong they are. On this ETH 4H chart, a textbook move unfolds:
🔹 Histogram flipped positive → Long entry triggered
🔹 Rising bars = building momentum
🔹 Tallest bar = momentum peak (July 21)
🔹 Shrinking bars signaled a weakening trend before price ever reversed
🔹 Histogram turned negative → clean exit at the top
The MACD histogram is a direct visual of momentum:
– Bars rising = acceleration
– Bars shrinking = exhaustion
– Crossing below 0 = confirmation of reversal
⚙️ Strategy Settings:
– MACD: 25 / 60 / 220
– EMA Filter: 50 / 9 / 3
– Entry Mode: Histogram + Crossover Combo

USDCHF looks like interesting.....Based on current market structure, price already close last week with formation Higher High. Thats show, market still in bullish momentum. And price already make a retracement through the cluster.
To avoid Stoploss Hunter, just set your SL below current market structure. and I personally close up position if price close with body candle.if just wick, I normally hold. Just refer current timeframe


#Bitcoin Sunday Update $BTC bounced from the $112,398 support #Bitcoin Sunday Update
CRYPTOCAP:BTC bounced from the $112,398 support and is now trading above $113,700. If it holds above this level, a push toward $120K is likely. However, if downside continues, next key support sits near $110K — both supports could trigger a rebound toward $120K. Stay alert for range play before breakout.

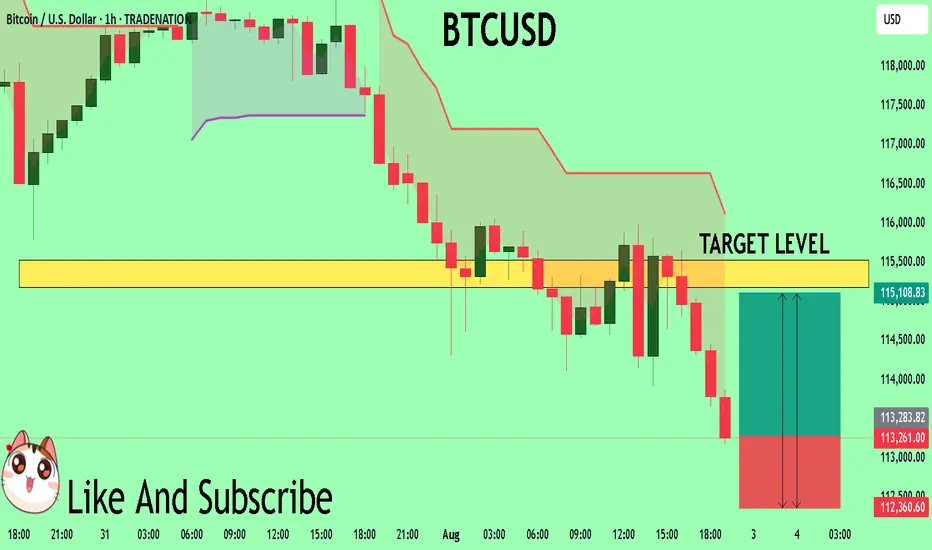
BTCUSD Will Explode! BUY!
My dear followers,
I analysed this chart on BTCUSD and concluded the following:
The market is trading on 11326 pivot level.
Bias - Bullish
Technical Indicators: Both Super Trend & Pivot HL indicate a highly probable Bullish continuation.
Target - 11517
Safe Stop Loss - 11236
About Used Indicators:
A super-trend indicator is plotted on either above or below the closing price to signal a buy or sell. The indicator changes color, based on whether or not you should be buying. If the super-trend indicator moves below the closing price, the indicator turns green, and it signals an entry point or points to buy.
Disclosure: I am part of Trade Nation's Influencer program and receive a monthly fee for using their TradingView charts in my analysis.
———————————
WISH YOU ALL LUCK
Gold looks like still having Bullish Momentum Based on current situation, XAUUSD looks like still having bullish momentum. looks at momentum candle, it like give early signal of next pole movement.
I just labelled two significant zone that I think, it is possible to create an edge. Even though, just wait for price action.

BTC -MACD Triggered the Breakout Early, MACD MasteryYou didn’t need 20 indicators. Just one system that actually worked.
The MACD Liquidity Tracker Strategy flipped long on BTC just before the latest 4H breakout — catching an 11.39% move with perfect histogram and EMA alignment.
🔍 Here’s what happened:
– Histogram flipped positive on July 23
– EMA filter cleared — clean long trigger
– Histogram rose into a momentum peak
– Strategy closed just before consolidation
This is exactly what the Liquidity Tracker was built for:
✅ Spot clean trend shifts
✅ Confirm strength via momentum
✅ Filter out noise using EMAs
⚙️ Settings Used:
– MACD: 25 Fast / 60 Slow / 220 Signal
– EMA Filter: 50 / 9 / 3
– Entry Mode: Histogram + Crossover Combo

BTC whats next ? a reversal in LTF
* **Blue Zone** = Minor bullish support or reaction zone
* **Yellow Zone** = Major bullish order block / demand zone
* **Red Zone** = Bearish supply zone or resistance
---
### 🧠 **Scenario Planning:**
#### ✅ If price **holds above the blue zone**:
* Expect a **bullish continuation**
* Target: **Red zone** (potential resistance or reversal area)
* Could be a scalp long opportunity with SL below blue
#### ❌ If price **breaks below the blue zone**:
* Expect a **drop toward yellow zone**
* Yellow zone could act as **bullish OB** and reversal point
* Possible long opportunity at yellow, targeting red again
---
### ⚠️ Key Considerations:
* Wait for **reaction confirmation** at blue or yellow before entering
* If BTC forms **bullish engulfing or BOS at yellow**, that’s your entry trigger
* Volume and market structure confirmation will strengthen conviction

SPY: Growth & Bullish Forecast
The price of SPY will most likely increase soon enough, due to the demand beginning to exceed supply which we can see by looking at the chart of the pair.
Disclosure: I am part of Trade Nation's Influencer program and receive a monthly fee for using their TradingView charts in my analysis.
❤️ Please, support our work with like & comment! ❤️

3rd August 2025 Daily Analysis For DxyDAILY DXY ANALYSIS FOR 3RD AUGUST 2025. Looking to see this setup play out completely on DXY . Will be focused on selling Gu and EU when the DXY setup start playing out

XAU/USD – Bullish Breakout Toward 3,440 Target🔹 Trend & Structure:
Market formed a Higher High (HH) followed by a Lower Low (LL), indicating bearish correction within a falling channel.
Price then created a Higher Low (HL) suggesting a potential trend reversal.
🔹 Channel Breakout:
Price broke above the descending channel, confirming bullish momentum.
A strong bullish candle closed above the 70 EMA, showing further strength.
🔹 Support Zone:
A support level between 3,314.485 – 3,335.703 is now established, which was previous resistance turned support.
🔹 Target Projection:
Using measured move strategy, the projected bullish target is around 3,439.802, a 3.09% move from the breakout zone.
🔹 Volume & Momentum:
Sharp bullish impulse indicates increased buying interest, supported by possible retest before continuation.
📈 Conclusion:
Bullish breakout confirmed. Ideal strategy:
🔹 Entry: On retest of the support zone (3,335 area)
🔹 Stop-loss: Below 3,314
🔹 Take-profit: Near 3,439
✅ Strategies used:
Trendline & Channel Analysis
Support/Resistance.
EMA (70) confirmation.
Price Action (HH, LL, HL)
Measured Move Target.

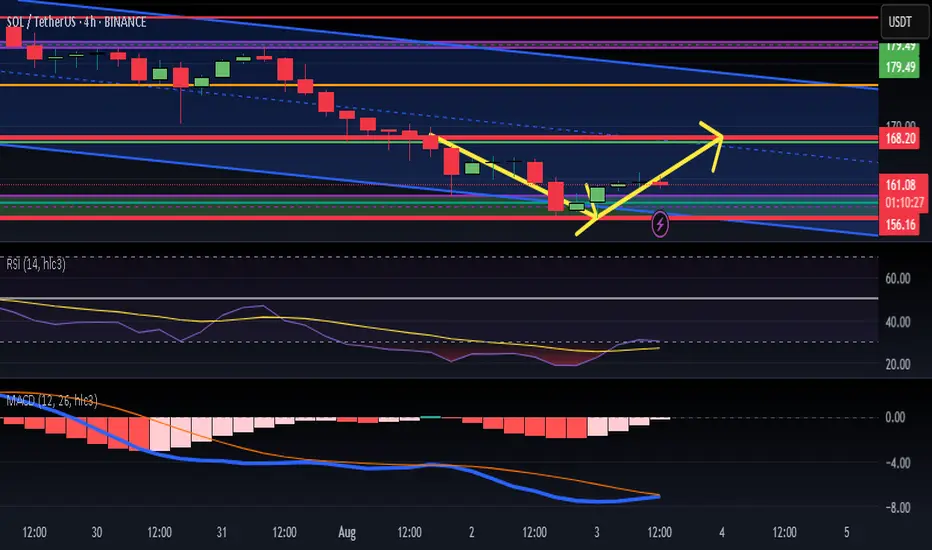
two important level keywe stuck in two level important main support in 61.8 fib 157 and daily resistance in 167 i think market will try resistance three time and will try two time resistance in 167 and bullish trend is start
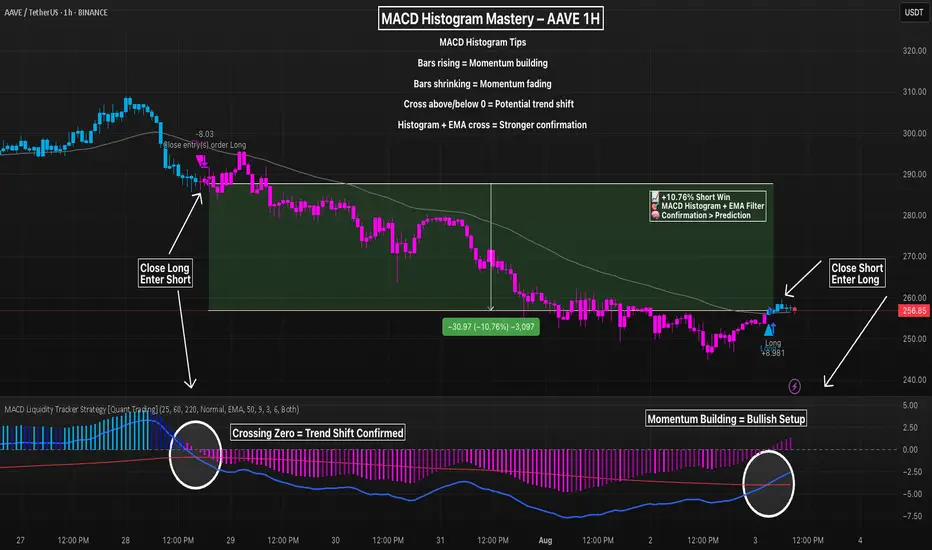
Master MACD Histogram + EMA Filter To Filter Out NoiseThe MACD histogram isn’t just noise — it’s a leading signal for momentum shifts when interpreted correctly. On this AAVE 1H chart, a textbook transition plays out:
– Rising histogram fades → crosses below 0
– EMA filter confirms trend shift
– Strategy flips short at the peak, locks in a +10.76% move
The recent long trigger occurs only after the histogram begins rising, crosses above zero, and price breaks back above the 50/9/3 EMA filter.
💡 Histogram Tips:
– Rising bars = bullish momentum building
– Shrinking bars = momentum weakening
– Crossing the zero line = potential trend reversal
– Best results come when histogram + EMAs align
⚙️ Settings Used:
MACD: 25 / 60 / 220
EMA Filter: 50 / 9 / 3
Entry Mode: Both (Histogram + Crossover Confluence)
📈 Use histogram transitions as an early signal — but always confirm with trend filters to avoid fakeouts.
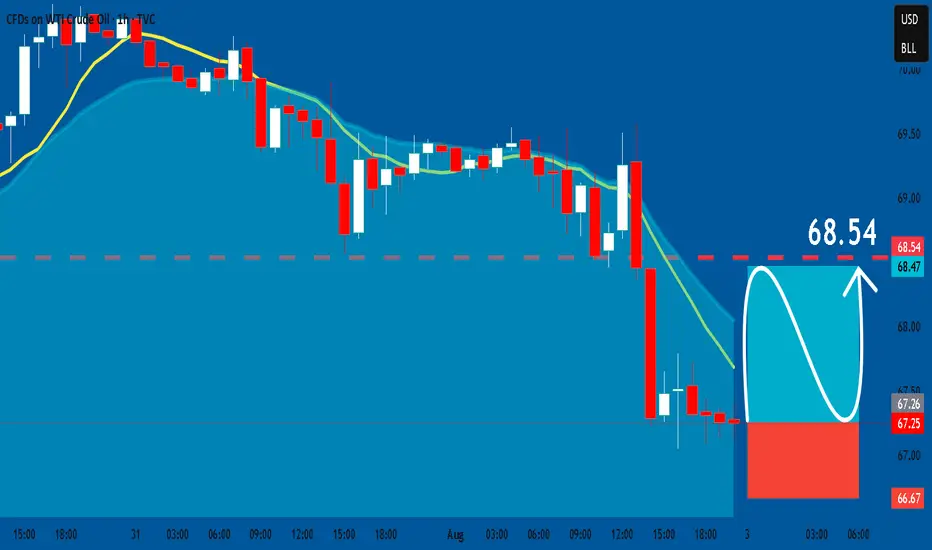
USOIL: Long Trade with Entry/SL/TP
USOIL
- Classic bullish pattern
- Our team expects retracement
SUGGESTED TRADE:
Swing Trade
Buy USOIL
Entry - 67.25
Stop - 66.67
Take - 68.53
Our Risk - 1%
Start protection of your profits from lower levels
Disclosure: I am part of Trade Nation's Influencer program and receive a monthly fee for using their TradingView charts in my analysis.
❤️ Please, support our work with like & comment! ❤️

#BitcoinDate: 03-08-2025
#Bitcoin Current Price:113646
Pivot Point: 112812 Support: 111359 Resistance: 114274
Upside Targets:
🎯Target 1: 115329
🎯Target 2: 116384
🎯Target 3: 117724
🎯Target 4: 119063
Downside Targets:
🎯Target 1: 110300
🎯Target 2: 109240
🎯Target 3: 107901
🎯Target 4: 106561
#TradingView #Nifty #BankNifty #DJI #NDQ #SENSEX #DAX #USOIL #GOLD #SILVER
#BHEL #HUDCO #LT #LTF #ABB #DIXON #SIEMENS #BALKRISIND #MRF #DIVISLAB
#MARUTI #HAL #SHREECEM #JSWSTEEL #MPHASIS #NATIONALUM #BALRAMCHIN #TRIVENI
#USDINR #EURUSD #USDJPY #NIFTY_MID_SELECT
#SOLANA #ETHEREUM #BTCUSD #MATICUSDT #XRPUSDT
#Crypto #Bitcoin #BTC #CryptoTA #TradingView #PivotPoints #SupportResistance

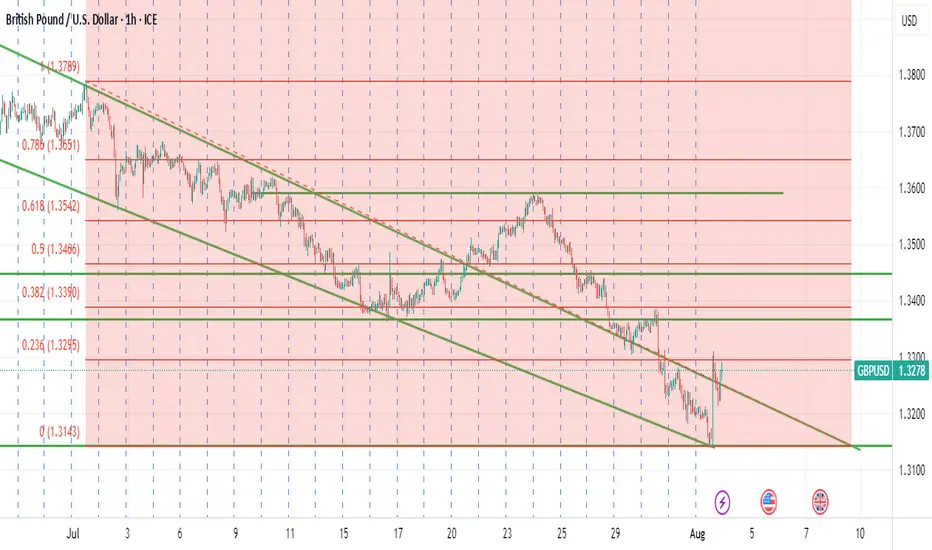
GBPUSD MONDAY ENTRY Looking for price to break through the fib area for a long position. Fundamentals are showing that price will continue to be bullish because of the NFP release last Friday as well as the trade deals.
Mid-Term Analysis on Gold (XAUUSD) (Weekly Chart)In this post I have laid out the two main Smart Wave Counts and scenarios for this pair. Note that the invalidation levels are to be monitored for confirmation of the counter cases.

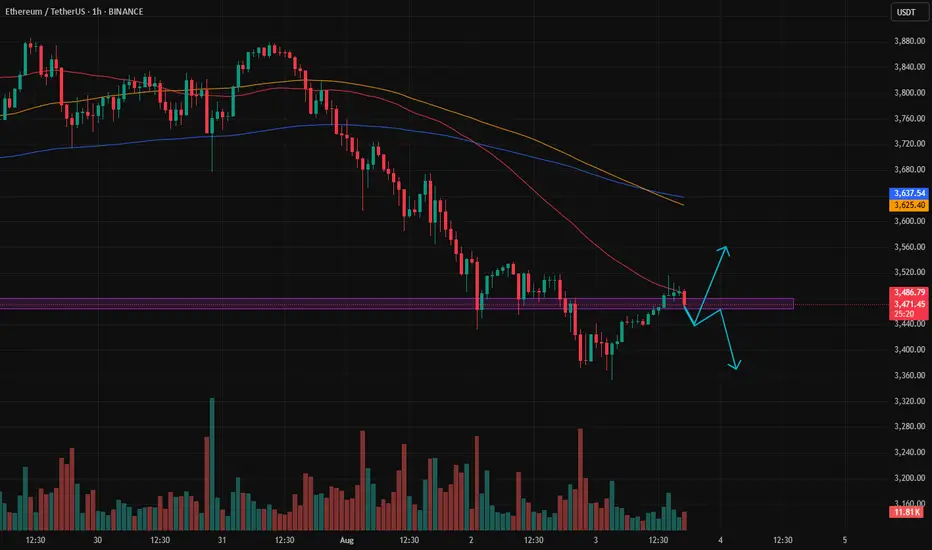
Patience to identify the market trendBased on the previous analysis, after hitting the sell target, the price made an upward correction.
Right now, it’s unclear whether we’re seeing the beginning of a trend reversal to the upside, or if the price is going to drop back below the zone, giving us another short opportunity.
If it does drop again, there’s a possibility it could fall as far as 3000.
We need to be patient and let the market show its hand — then we can respond accordingly.