Chart Patterns

#BitcoinDate: 03-08-2025
#Bitcoin Current Price:113646
Pivot Point: 112812 Support: 111359 Resistance: 114274
Upside Targets:
🎯Target 1: 115329
🎯Target 2: 116384
🎯Target 3: 117724
🎯Target 4: 119063
Downside Targets:
🎯Target 1: 110300
🎯Target 2: 109240
🎯Target 3: 107901
🎯Target 4: 106561
#TradingView #Nifty #BankNifty #DJI #NDQ #SENSEX #DAX #USOIL #GOLD #SILVER
#BHEL #HUDCO #LT #LTF #ABB #DIXON #SIEMENS #BALKRISIND #MRF #DIVISLAB
#MARUTI #HAL #SHREECEM #JSWSTEEL #MPHASIS #NATIONALUM #BALRAMCHIN #TRIVENI
#USDINR #EURUSD #USDJPY #NIFTY_MID_SELECT
#SOLANA #ETHEREUM #BTCUSD #MATICUSDT #XRPUSDT
#Crypto #Bitcoin #BTC #CryptoTA #TradingView #PivotPoints #SupportResistance

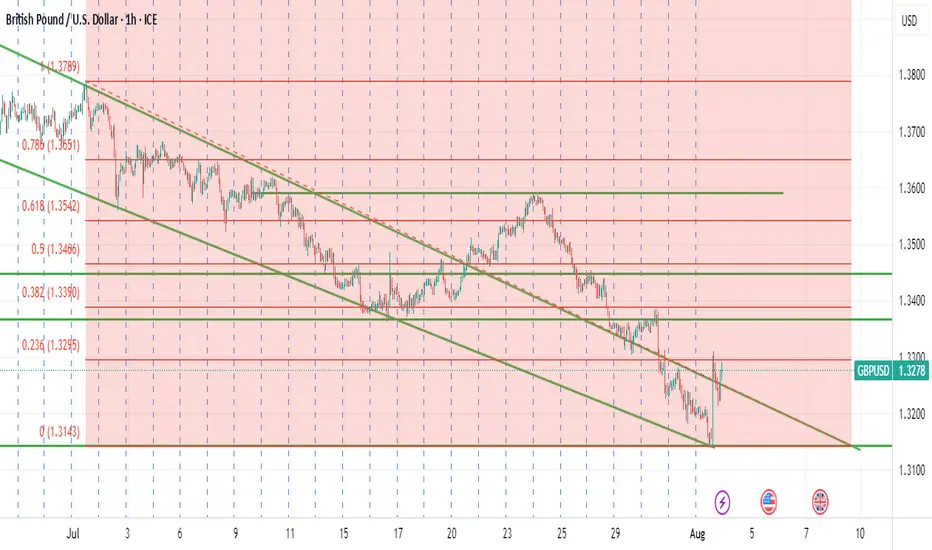
GBPUSD MONDAY ENTRY Looking for price to break through the fib area for a long position. Fundamentals are showing that price will continue to be bullish because of the NFP release last Friday as well as the trade deals.
Mid-Term Analysis on Gold (XAUUSD) (Weekly Chart)In this post I have laid out the two main Smart Wave Counts and scenarios for this pair. Note that the invalidation levels are to be monitored for confirmation of the counter cases.

Patience to identify the market trendBased on the previous analysis, after hitting the sell target, the price made an upward correction.
Right now, it’s unclear whether we’re seeing the beginning of a trend reversal to the upside, or if the price is going to drop back below the zone, giving us another short opportunity.
If it does drop again, there’s a possibility it could fall as far as 3000.
We need to be patient and let the market show its hand — then we can respond accordingly.
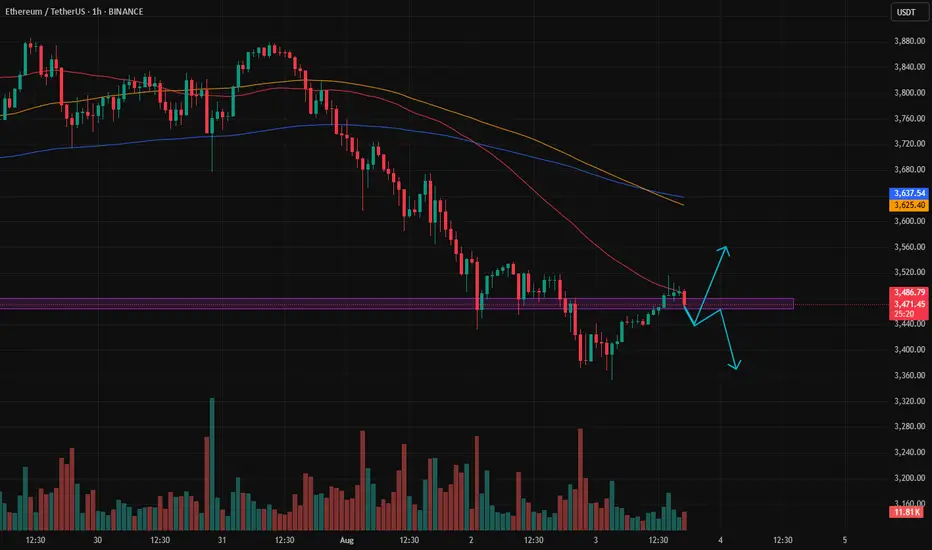
EURUSD testing necklineEURUSD has made the move we were waiting for . it went to test our neckline of the double bottom or M pattern , now we just need to wait for confirmation for the longterm sell before we enter


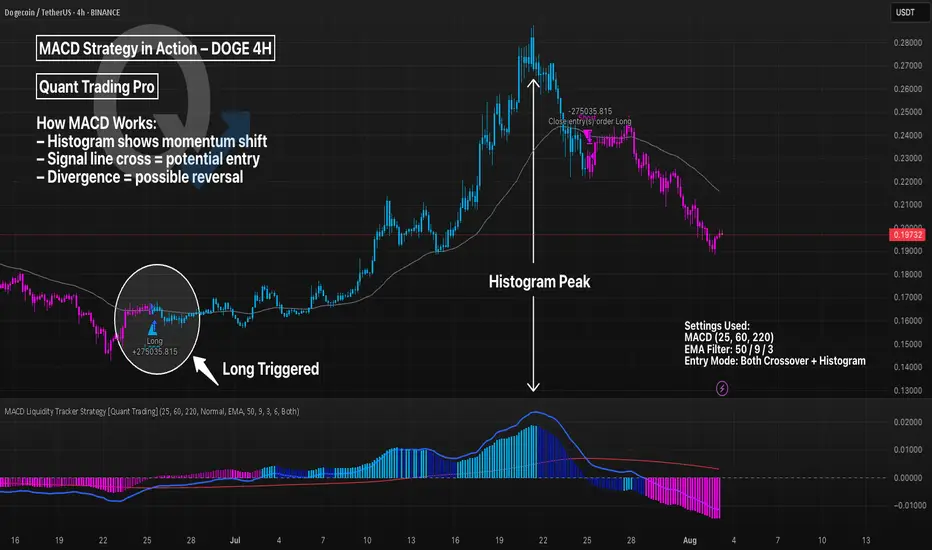
MACD Liquidity Strategy in Action – DOGE 4HThe MACD (Moving Average Convergence Divergence) is a trend-following momentum indicator. It uses two EMAs to generate signals via crossovers and histogram shifts.
This chart shows DOGE 4H with a long-only MACD Liquidity Tracker Strategy, using:
Fast EMA: 25
Slow EMA: 60
Signal Line: 220
These longer settings reduce noise and provide higher-conviction swing entries, though at the cost of late signals.
💡 Tweak Tip:
Lower values (e.g. 12/26/9) = more signals, better for scalping
Higher values (e.g. 25/60/220) = fewer signals, better trend filtering
Adjust the EMA filter (50/9/3 here) to match asset volatility
📊 Use MACD for:
Trend continuation confirmation
Exit timing via histogram fading
Divergence spotting (momentum vs price)
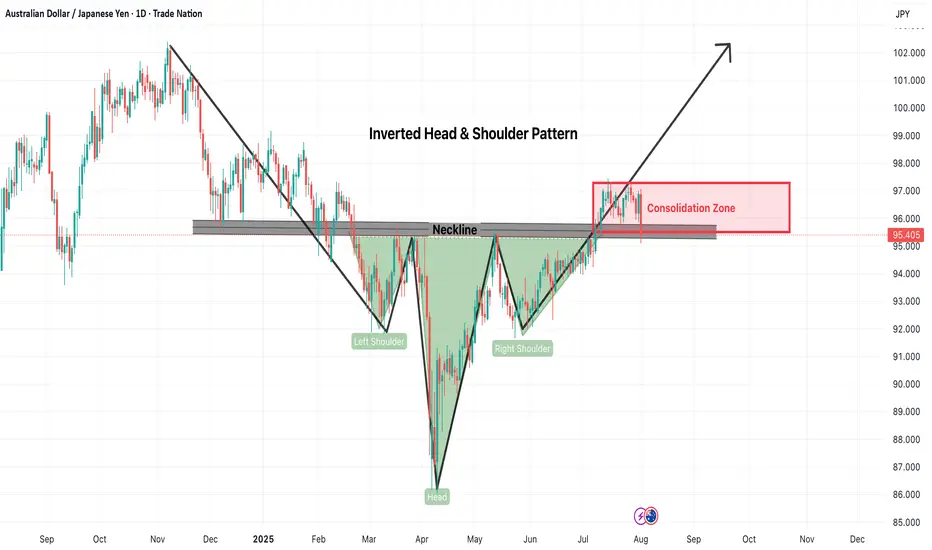
AUDJPY-Inverted Head & Shoulders Pattern at Reversal levelThe AUDJPY pair has formed a classic Inverted Head and Shoulders pattern, typically a strong bullish reversal signal. As seen on the daily chart, the left shoulder, head, and right shoulder have all developed with a clearly defined neckline near the 95.80–96.00 zone. Price action recently broke above this neckline but has since entered a consolidation phase between 95.00–97.00.
Bullish Scenario (Breakout Confirmation)
If AUDJPY decisively breaks above the 97.00 resistance with strong bullish momentum and volume, the inverted head and shoulders pattern will be fully confirmed. In this case, traders can expect an upward continuation toward:
Short-term Target: 99.00
Medium-term Target: 101.00
Measured Move Target: ~102.00 based on pattern height
Risk:
False breakout followed by quick pullback under neckline
Sudden JPY strength due to geopolitical or fundamental news
AUD weakness due to interest rate decisions or economic data
Sideways/Neutral Scenario (Extended Consolidation)
Another possibility is that AUDJPY continues to range between 95.00–97.00 for an extended period without a decisive breakout. This may happen if the market awaits more macroeconomic cues or central bank guidance.
Risk:
Whipsaws and fakeouts within the range
Frustration due to lack of clear direction
Risk Management Tips:
Wait for confirmation: Only trade post breakout or breakdown with candle close above 97.00 or below 95.00
Use tight stop-loss: Keep stops just below support or above resistance zones
Position sizing: Avoid overleveraging in rangebound conditions
Diversify exposure: Don’t put all capital into one trade setup
Conclusion:
AUDJPY is at a critical decision point. The inverted head and shoulders structure is bullish in nature, but the current consolidation adds uncertainty. Traders should stay alert for either a breakout for trend continuation or a breakdown invalidating the setup. Use proper risk management in all cases.
=================================================================
Disclosure: I am part of Trade Nation's Influencer program and receive a monthly fee for using their TradingView charts in my analysis.
=================================================================
Bitcoin will reach 128,000 points!Bitcoin is currently trading in a very specific zone that resembles a classic bull flag continuation pattern, similar to the one we saw during last year’s rally.
Back then, a slow-forming bull flag broke to the upside, pushed to new all-time highs, and then retested the top of the same flag before continuing higher.
Now, we are witnessing a similar setup, but this time the formation has developed much faster.
The key difference:
While last year’s bull flag took a longer time to mature, the current one is more compressed, indicating a potentially sharper move if confirmed.
The $108K daily level is critical.
As long as Bitcoin remains above this level, the structure favors a new rally.
This could be the start of another impulsive leg, targeting the $128K Area.

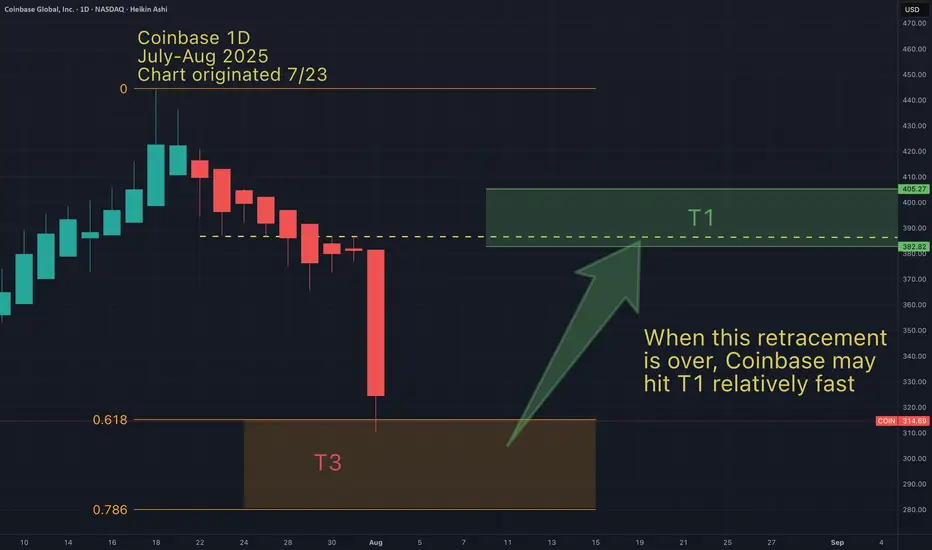
Coinbase dumped to my T3 range. Here is my Bullish targetCoinbase is in my range for a big bounce soon.
Could go a little lower, but I expect around a 25% bounce as soon as the retracement is done.
I anticipate Coinbase to go straight up to my bullish T1 target (around $400 +/- $10).
May the trends be with you.
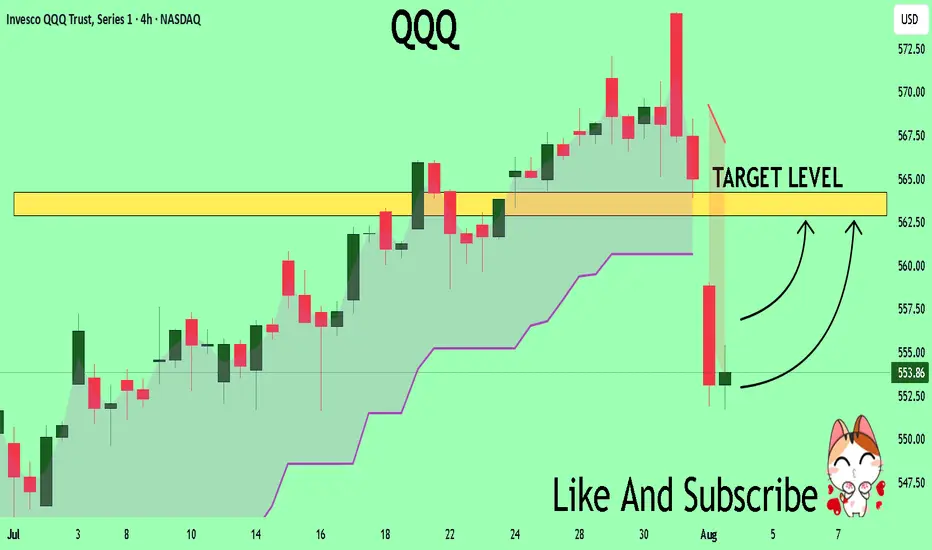
QQQ The Target Is UP! BUY!
My dear friends,
Please, find my technical outlook for QQQ below:
The instrument tests an important psychological level 553.86
Bias - Bullish
Technical Indicators: Supper Trend gives a precise Bullish signal, while Pivot Point HL predicts price changes and potential reversals in the market.
Target - 562.88
About Used Indicators:
Super-trend indicator is more useful in trending markets where there are clear uptrends and downtrends in price.
Disclosure: I am part of Trade Nation's Influencer program and receive a monthly fee for using their TradingView charts in my analysis.
———————————
WISH YOU ALL LUCK
DXY Analysis todayHello traders, this is a complete multiple timeframe analysis of this pair. We see could find significant trading opportunities as per analysis upon price action confirmation we may take this trade. Smash the like button if you find value in this analysis and drop a comment if you have any questions or let me know which pair to cover in my next analysis.

GOLD MARKET OUTLOOK GOLD Market Outlook for the Coming Week
A bearish divergence has been spotted while GOLD is currently testing a key resistance area. Despite both technical and fundamental factors leaning bullish, a short-term pullback is possible before the uptrend resumes.
If price consolidates above the 3375 level, it could signal further upside movement. A potential strategy is to set BUY limit orders around key Fibonacci levels. However, if these levels are broken to the downside, it would invalidate our current bullish bias.

EURUSD - Counter trend idea.-In the monthly (higher timeframes), EURUSD is bullish.
-In the weekly timeframe, the was a momentous price reaction at the 1w BoS, making it a very strong area of liquidity and unlikely to be broken further in the short term period but maybe tested.
In the the daily and timeframe EU is bearish, but it is just a possible higher timeframe retracement, but still we are looking for opportunities in that retracement too.
-Above is our low probability low risk idea. We are only risking 10 Pips.

#DAXDate: 01-08-2025
#DAX Current Price: 23680
Pivot Point: 24193.295 Support: 23822.409 Resistance:24566.692
Upside Targets:
🎯 Target 1: 24882.344
🎯 Target 2: 25197.995
🎯 Target 3: 25574.758
🎯 Target 4: 25951.520
Downside Targets:
🎯 Target 1: 23505.502
🎯 Target 2: 23188.595
🎯 Target 3: 22811.833
🎯 Target 4: 22435.070
#TradingView #Nifty #BankNifty #DJI #NDQ #SENSEX #DAX #USOIL #GOLD #SILVER
#BHEL #HUDCO #LT #LTF #ABB #DIXON #SIEMENS #BALKRISIND #MRF #DIVISLAB
#MARUTI #HAL #SHREECEM #JSWSTEEL #MPHASIS #NATIONALUM #BALRAMCHIN #TRIVENI
#USDINR #EURUSD #USDJPY
#SOLANA #ETHEREUM #BTCUSD #MATICUSDT #XRPUSDT
#Crypto #Bitcoin #BTC #CryptoTA #TradingView #PivotPoints #SupportResistance

Long HINDUNILVRSuperTrend has turned positive on the weekly chart, with the recent closing price trading above the 10 EMA
BUY HINDUNILVR
Entry - 2729
SL - 2397

JSWENERGY SHORT_Bearish Engulfing CandleJSWENERGY SHORT:
- Bearish Engulfing Candle
- Rejection from 50 & 20 DEMA
- Enter Short when prices are favorable in lower timeframe

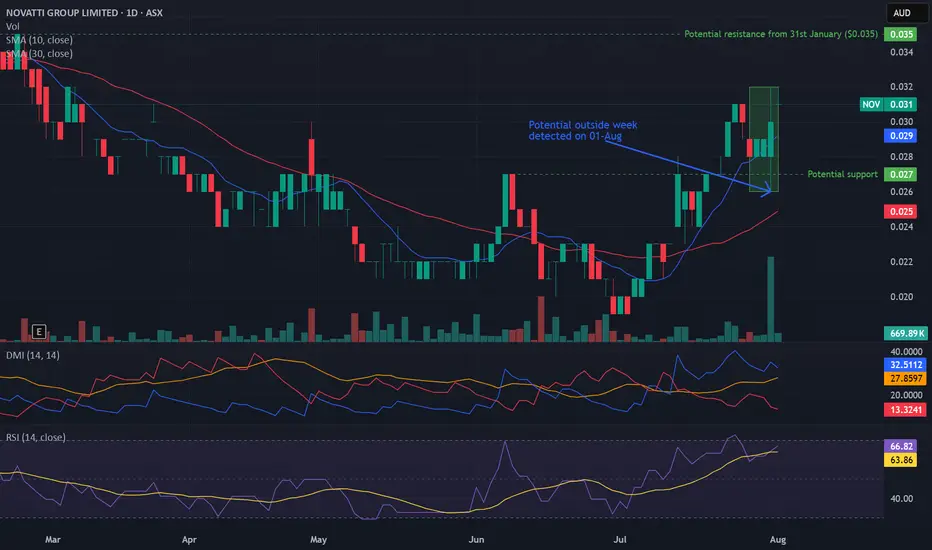
Potential outside week and bullish potential for NOVEntry conditions:
(i) higher share price for ASX:NOV above the level of the potential outside week noted on 31st July (i.e.: above the level of $0.032).
Stop loss for the trade would be:
(i) below the low of the outside week on 31st July (i.e.: below $0.026), should the trade activate.
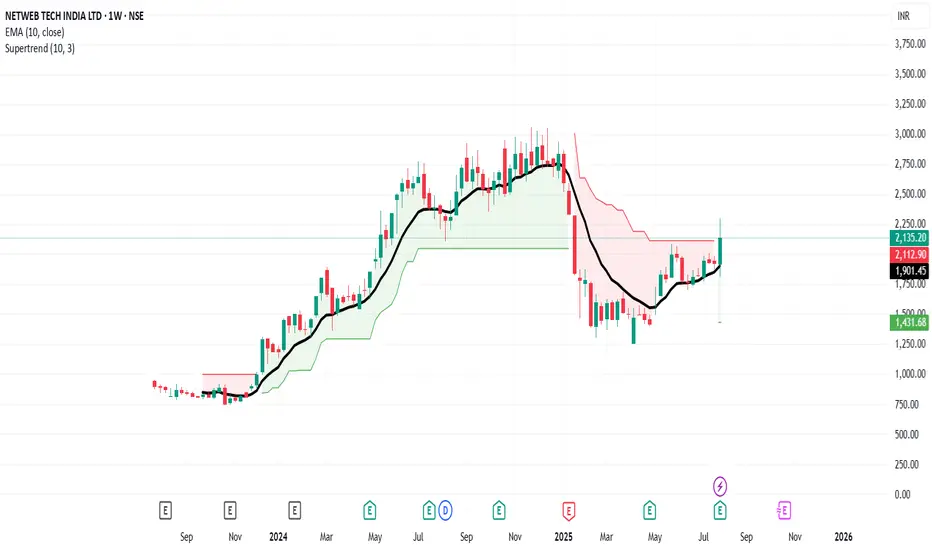
Long NETWEBSuperTrend has turned positive on the weekly chart, with the recent closing price trading above the 10 EMA
BUY NETWEB
Entry - 2296
SL - 1811

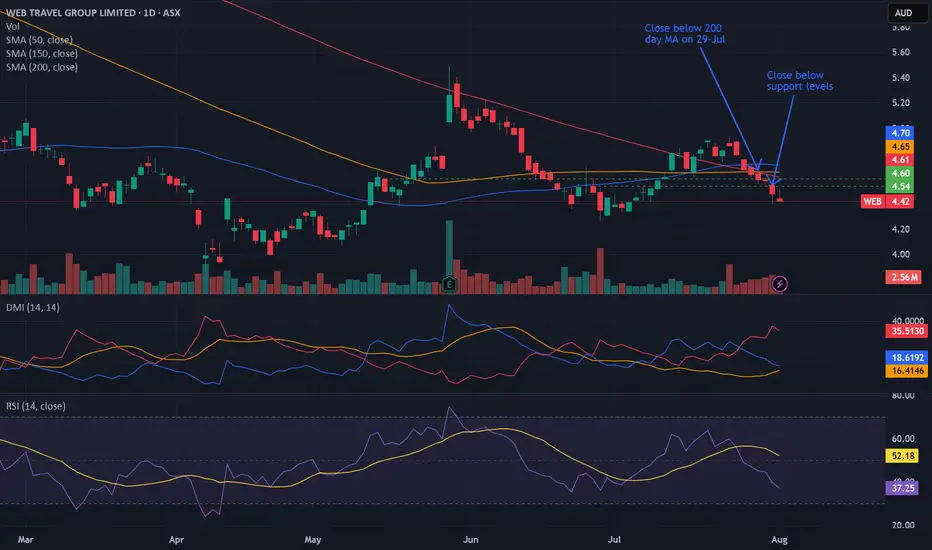
Bearish potential detected for WEBEntry conditions:
(i) lower share price for ASX:WEB along with swing of DMI indicator towards bearishness and RSI downwards, and
(ii) observing market reaction around the share price of $4.54 (open of 26th June).
Stop loss for the trade would be:
(i) above the declining 50 day moving average (currently $4.70), or
(ii) above the low of the candle on 24th July prior to the gap-down prior to the close below the 200 day moving average (i.e. just above $4.78), or
(iii) above the recent swing high on 23rd July (i.e.: above $4.93), depending on risk tolerance.
XAUUSD Analysis todayHello traders, this is a complete multiple timeframe analysis of this pair. We see could find significant trading opportunities as per analysis upon price action confirmation we may take this trade. Smash the like button if you find value in this analysis and drop a comment if you have any questions or let me know which pair to cover in my next analysis.
