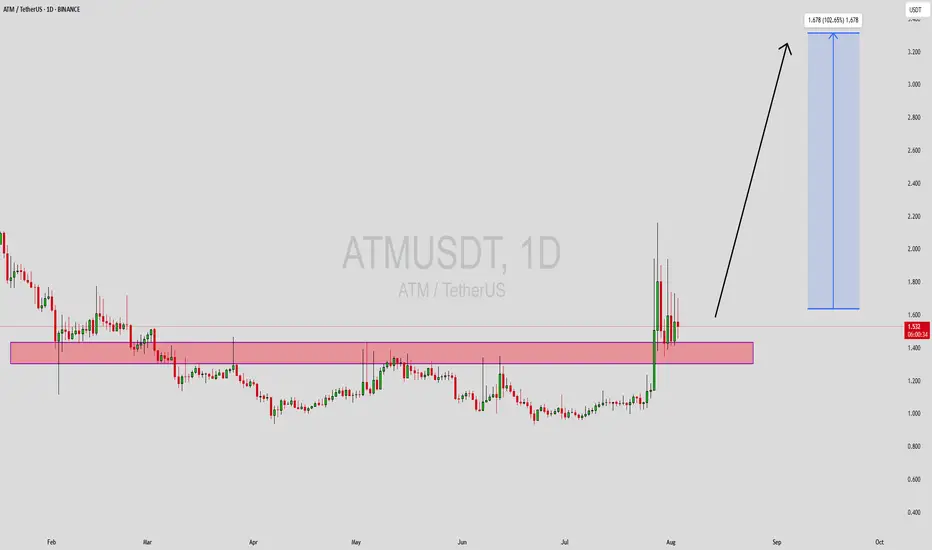
ATMUSDT Forming Bullish ContinuationATMUSDT is displaying a strong bullish continuation signal following its recent breakout from a prolonged consolidation zone. The price has surged above a critical resistance range, now turned into a support zone (highlighted in pink), which held the price down for months. This shift in structure signals renewed bullish sentiment, with price action stabilizing just above the breakout area — a textbook sign of accumulation before the next leg upward.
The trading volume accompanying this breakout is notably strong, reinforcing the legitimacy of the move. With an expected gain of 90% to 100%+, the current market structure suggests there's still substantial upside potential. The projection points to a move towards the $3.20 area, aligning with previous high-volume sell zones. If bulls maintain control and the price remains above the new support zone, this target becomes increasingly realistic in the short-to-mid term.
Investors are beginning to show strong interest in ATM, which is likely due to both technical and fundamental reasons. As the crypto market regains momentum, low-cap or mid-tier altcoins with solid breakout structures tend to outperform. The chart setup on ATMUSDT is appealing to both swing traders and breakout traders who are targeting high-reward scenarios with proper risk control.
ATMUSDT is a coin to watch closely. Any retest of the support zone could be a solid entry opportunity for those who missed the initial breakout. As long as the structure holds, this setup remains bullish and could offer one of the most rewarding trades on Binance’s spot market in the coming weeks.
✅ Show your support by hitting the like button and
✅ Leaving a comment below! (What is You opinion about this Coin)
Your feedback and engagement keep me inspired to share more insightful market analysis with you!
Chart Patterns
Us oil bullish setupI’m bullish and I was waiting for the pullback…its happening and I’m buying at the buy zones shown on the chart, stop will be the yellow line.

binance compression!!Bnb price compression at right has been incredible and rightly so. waited for liquidity increase which will make price explosive to up side, making ath all along now, objectively 1200 tp but crazy price will be seen up around 3000s

NG1! BULLISH BIAS RIGHT NOW| LONG
NG1! SIGNAL
Trade Direction: long
Entry Level: 3.086
Target Level: 3.599
Stop Loss: 2.744
RISK PROFILE
Risk level: medium
Suggested risk: 1%
Timeframe: 1D
Disclosure: I am part of Trade Nation's Influencer program and receive a monthly fee for using their TradingView charts in my analysis.
✅LIKE AND COMMENT MY IDEAS✅

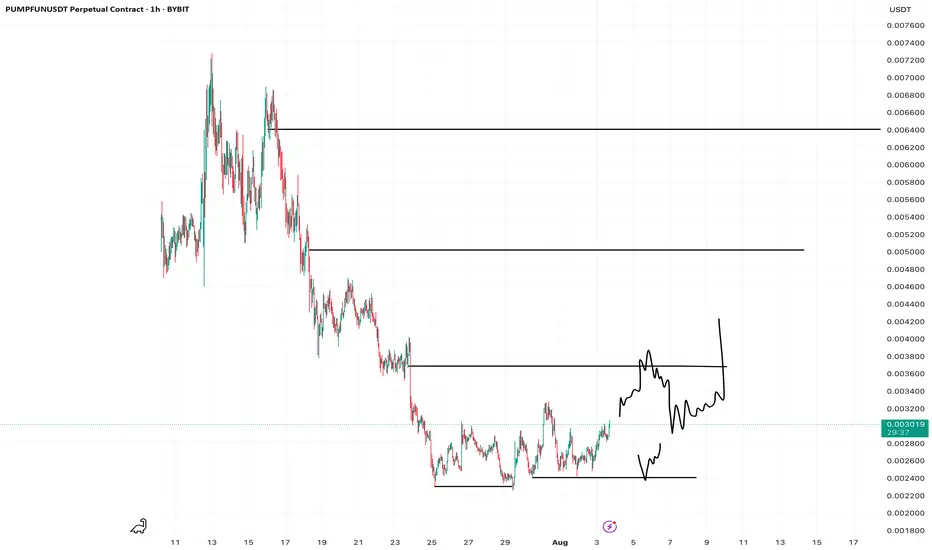
PUMP - back to fun?Hoping to get that internal sweep at 24; in any case I have a small feeling that this corrects a bit higher soon.
Not gonna buy it here at local highs of course, it would be equal distance to first tp and stop, I don't like it.
so either we sweep or come back into discount at least, or I buy on the s/r flip after taking out tp1. much more difficult to execute of course
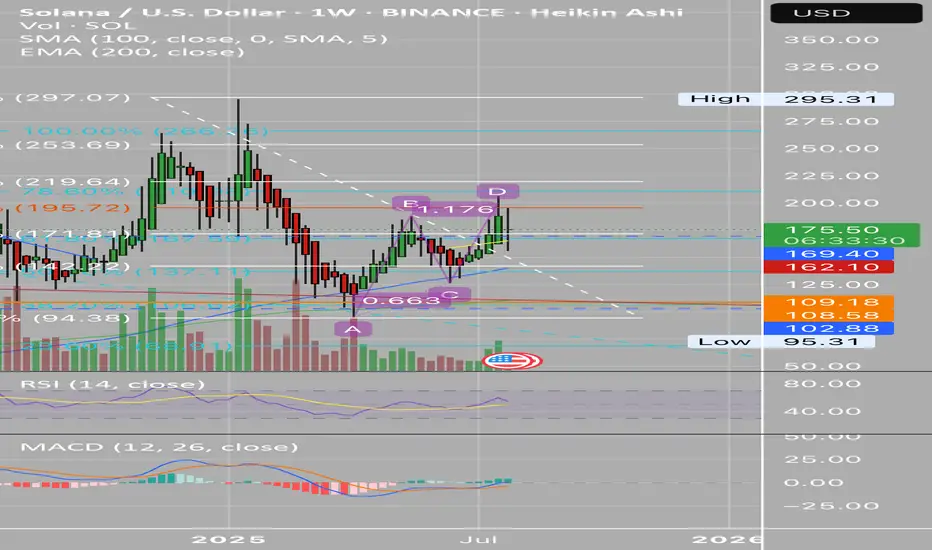
Weekly Chart RejectionRight now I’m seeing a rejection at 50% Fib
It also looks like it’s gonna to confirm it at week close.
I’m concerned this means we continue to drop $109 area as support.
Looks like most of the coins out there can keep dropping so likely the same with SOL
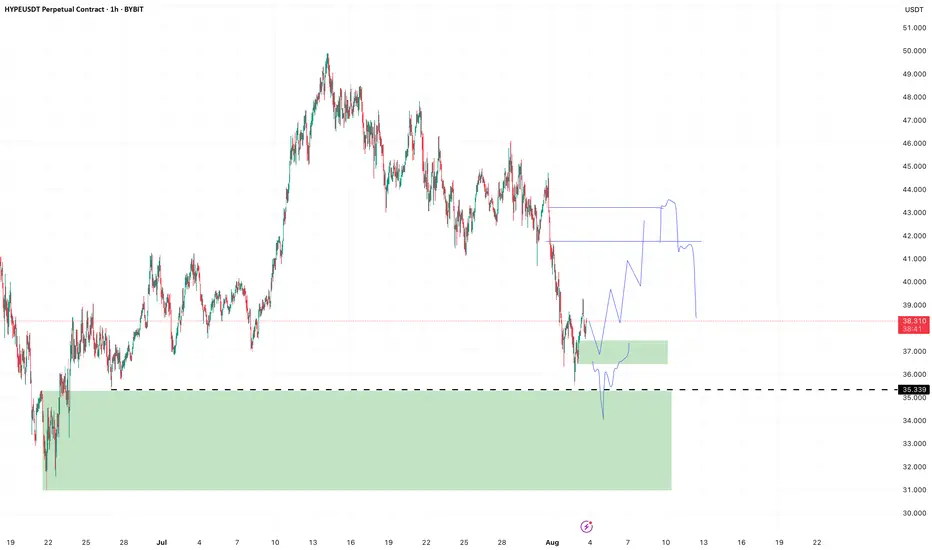
HYPE - Imbalance to be filledVery nice imbalance on HYPE here, I think there are a few different things to keep an eye on, money to be made for sure.
Technically an msb on H1, although again a strong rejection and only a very short time spent above the msb. But we can try a long on the retest in the green box, if we get it. Stop is below the low.
Second long attempt is enter where we just got stopped, but only on a reclaim OR look for ltf entry in the big green box below.
Both tps are in the imbalance shown on the chart, from where we can eye rejection for trend continuation down.
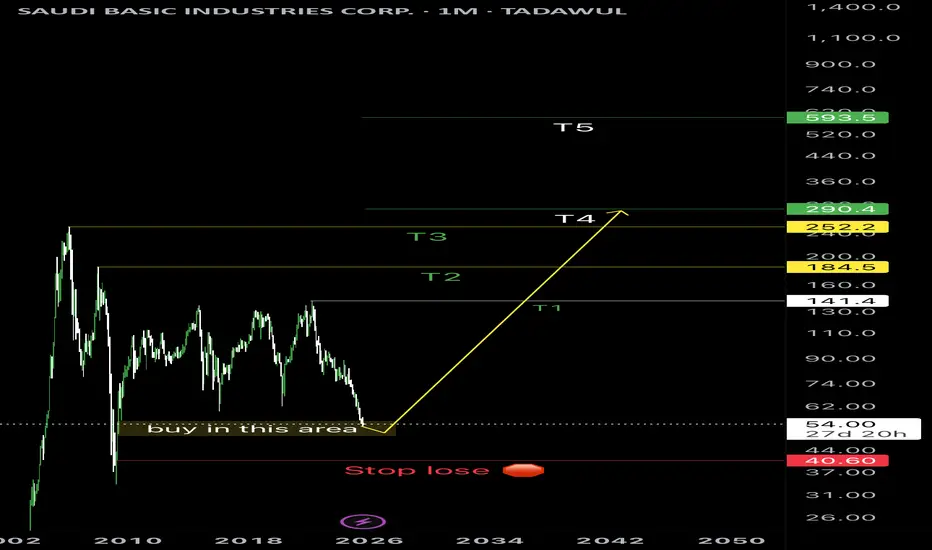
I was waiting this area from long time ago since it was on 140Every thing is clear in the chart, BUT my actual target 🎯 T4
So T1 &T2 & T3 They are just conformation for me for the mine target T4.
T5 is just extra generosity from the market if the economy conditions are good when price reaches T4.
It will be long journey.
Be patient.
Salam
Quick Video Updating Previous PENGU Charts SharedI wanted to record a brief video of my thoughts for PENGU and where we may be headed. This is an overall compilation from the previous charts shared and how/why I feel this was a good entry for a run towards ATH on this chart. It looks to me that we have a strong support level that has formed along with a quick wick testing a previous weekly level. Right now we seem to be in a small range and in need of some momentum to begin a strong move as this coin has been recently known to do. With it being a Sunday I am not sure we get it today, but would love to see it! Alerts set for confirmations for both right and wrong scenarios on this trade idea as always. Enjoy your weekend!

KAIA Bullish DivergenceBINANCE:KAIAUSDT
Trade Setup:
Target 1: 0.1472 (0.786 Fibonnaci Golden Zone).
Target 2: 0.1544 (0.618 Fibonnaci Golden Zone).
Target 3: 0.1594 (0.5 Fibonnaci Golden Zone).
Target 4: 0.1808 (0 Fibonnaci).
Stop Loss: 0.1265 (1.272 Fibonnaci).
RSI Analysis: The RSI is showing a bullish divergence, suggesting potential bullish momentum. The current RSI is around 21.23, approaching oversold territory, so caution is advised.

NICLALL Time High Broke
Heavy buy back in this year
72% groth in revenu in 9 months as per comapanylast 3 quarters resluts.

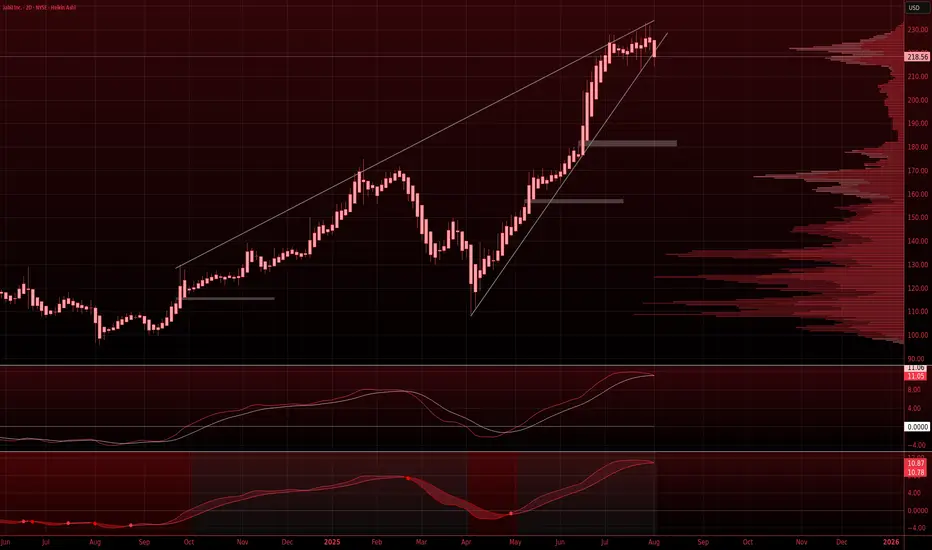
Jabill oscillators close to flipping bearish on the 2-day chartBearish on the short term (30 days) on Jabill Inc, $JBL.
Gaps at $180 and $157 on the 2-day chart.
See chart.
SHOPIFY ready to perform Price has break upwards and retest raising channel.
Strong signal for the further growth.
Target is on chart
DYOR
NFA

XAUUSD Update 03 Augt 2025 BOUNCINGAs we knew on last weekend, price has bounced from 3267 level. It wont touch 3245-50 as a support.
From this reaction, we will follow on this week, is the price will break 3378 resistance ?
Is the price will retest 3400 level again and again ?
And if it so, it seemlikes a bullish momentum.
Just becarefull, waiting for the price make a correction first.
Have a blessing week ahead !

Focus sell on AJHappy weekend guys. On last week AJ has formed a huge engulfing candle bear. Looking closer at small time frame, price has formed a double top and it had actually broker the neckline to end the week. I am going to find any possible short setups, targeting 1:1 on this formation. It does seem start to continue the downtrend at long term though...

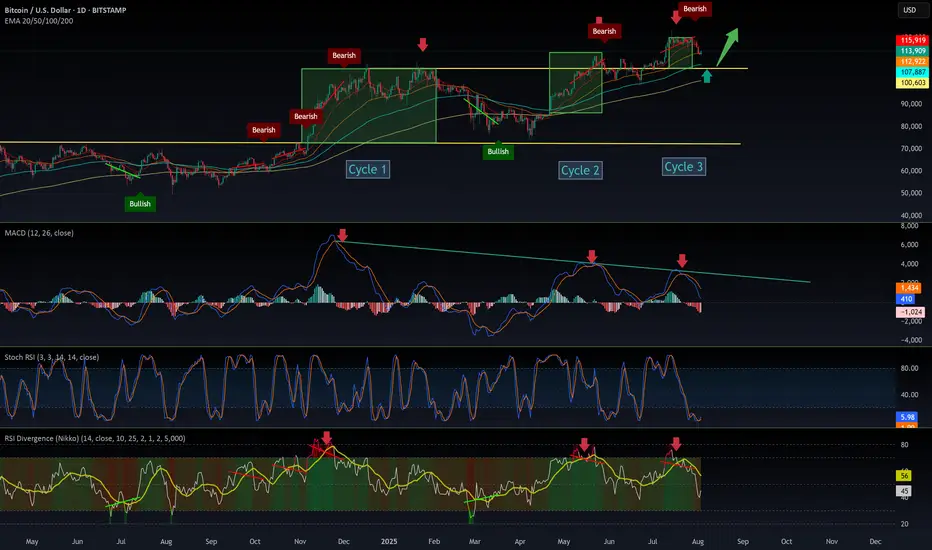
$BTC New Cycle: It’s Hard Not to Notice the ShiftSince December 2024, CRYPTOCAP:BTC has been closely following the SPX500, forming three similar cycles—each decreasing in intensity and shorter in duration.
The similarities are striking, especially when analyzing the MACD and RSI.
Each cycle ends with a bearish divergence.
Each cycle sees a rebound or bottom during consolidation, often touching the top of the previous cycle.
Most importantly, the cycles are accelerating.
However, it’s difficult to draw a definitive conclusion. These patterns are new in Bitcoin’s history, and there's no past reference for such institutional-driven behavior.
I believe the entry of institutions is reshaping Bitcoin’s rhythm. Their strategy is accumulation, not speculation, which brings more stability but also alters traditional crypto cycles.
What do you think will be the consequences of this shift?
Drop your thoughts in the comments👇
GBPUSD – WEEKLY FORECAST Q3 | W32 | Y25📊 GBPUSD – WEEKLY FORECAST
Q3 | W32 | Y25
Weekly Forecast 🔍📅
Here’s a short diagnosis of the current chart setup 🧠📈
Higher time frame order blocks have been identified — these are our patient points of interest 🎯🧭.
It’s crucial to wait for a confirmed break of structure 🧱✅ before forming a directional bias.
This keeps us disciplined and aligned with what price action is truly telling us.
📈 Risk Management Protocols
🔑 Core principles:
Max 1% risk per trade
Only execute at pre-identified levels
Use alerts, not emotion
Stick to your RR plan — minimum 1:2
🧠 You’re not paid for how many trades you take, you’re paid for how well you manage risk.
🧠 Weekly FRGNT Insight
"Trade what the market gives, not what your ego wants."
Stay mechanical. Stay focused. Let the probabilities work.
FRGNT
FX:GBPUSD

NEAR 4H – Squeezed Into Support, But Will the Bounce Stick? NEAR is being compressed between a major descending trendline and a historically strong demand zone on the 4H.
The setup is classic:
🔻 Lower highs = sustained bearish pressure
🔹 Flat support = buyer interest around $1.50–$2.00
🔄 Stoch RSI is flipping from oversold, hinting at possible relief
A clean break below this support would invalidate the setup — but if buyers defend again, we may see a sharp reversal.
⚠️ Watch for:
– Bullish divergence or high-volume bounce
– Break and retest of the trendline for confirmation
– Stop hunts below support before reversal (wick traps)

INIT/USDT - Double bottom INIT has successfully double-bottomed around the $0.35 zone, confirming it as a strong demand area. The first leg off this support showed a powerful push from buyers, signaling renewed interest and a potential trend shift. Now, price action is heating up again as buyers step in aggressively with rising volume, reinforcing the bullish momentum.

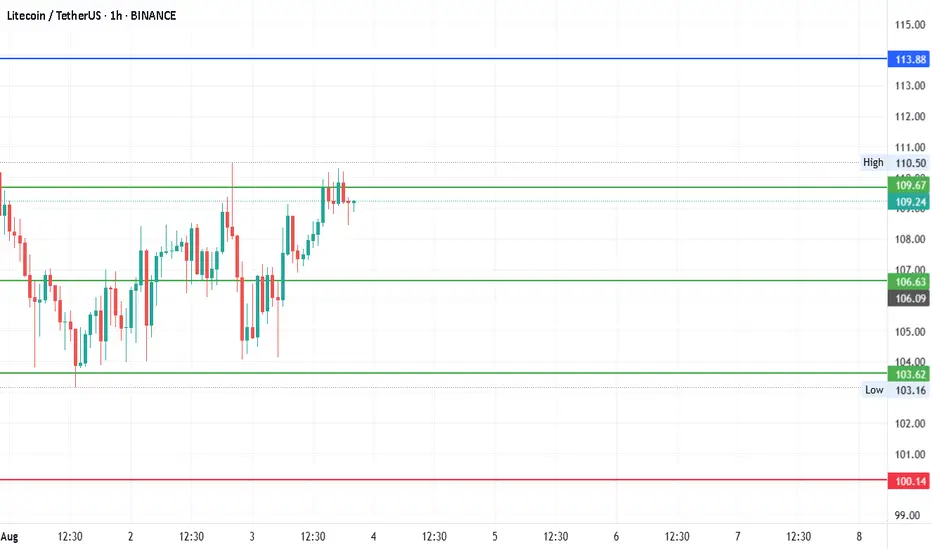
#LTCUSDTDate: 03-08-2025
#LTCUSDT - Current Price: 109
#LTCUSDT Pivot Point: 107 Support: 104 Resistance: 110
#LTCUSDT Upside Targets:
Target 1: 113
Target 2: 117
Target 3: 120
Target 4: 124
#LTCUSDT Downside Targets:
Target 1: 100
Target 2: 97
Target 3: 93
Target 4: 89
#Crypto #Bitcoin #BTC #CryptoTA #TradingView #PivotPoints #SupportResistance
#TradingView #Nifty #BankNifty #DJI #NDQ #SENSEX #DAX #USOIL #GOLD #SILVER
#BHEL #HUDCO #LT #LTF #ABB #DIXON #SIEMENS #BALKRISIND #MRF #DIVISLAB
#MARUTI #HAL #SHREECEM #JSWSTEEL #MPHASIS #NATIONALUM #BALRAMCHIN #TRIVENI
#USDINR #EURUSD #USDJPY #NIFTY_MID_SELECT
#SOLANA #ETHEREUM #BTCUSD #MATICUSDT #XRPUSDT #LTCUSDT
BTCUSD--Short-03-08-25--After last week, expecting price will move down further to monthly support-1 and monthly support-2

Potential 4H Head and shouldersA potential h&s could be shaping, the daily trend is down but the weekly chart is looking for support.

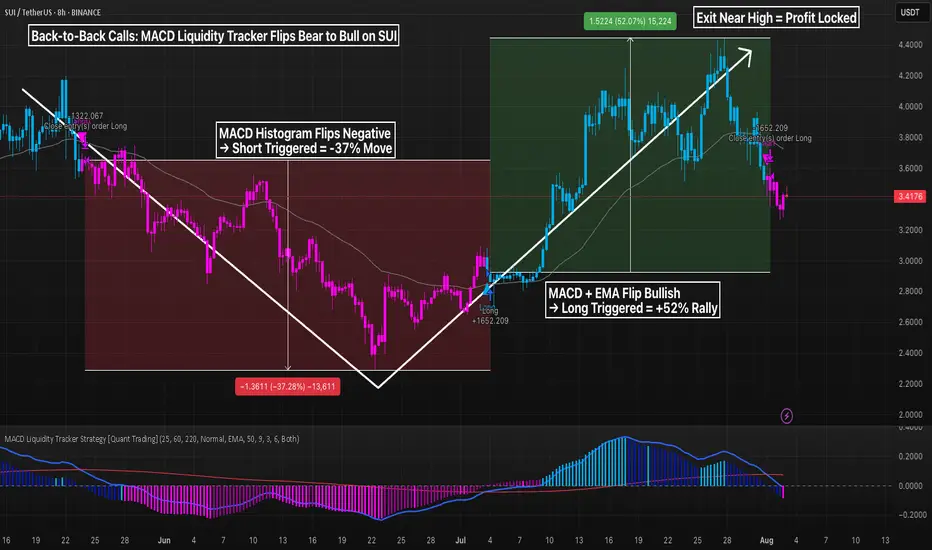
Back-to-Back Calls MACD Liquidity Strat-> Bear to Bull on SUIWhen the market flips, most traders get stuck holding bags.
Not here.
The MACD Liquidity Tracker Strategy flipped short near the top and long near the bottom — catching a clean -37.28% drop followed by a +52.07% rally on SUI 8H.
Here’s how it works:
– EMA filter confirms direction
– MACD histogram + crossover signals timing
– Strategy waits for true momentum before flipping
You don’t need to predict the bottom. You need a tool that reacts fast enough to capture moves, but slow enough to ignore noise.
⚙️ Settings Used:
– MACD: 25 / 60 / 220
– EMA Filter: 50 / 9 / 3
– Entry Mode: Both (Histogram + Crossover)
This is what smart automation looks like: fewer trades, more clarity, and real trend capture.