BTC AccumulationI'm excited to see how this develops. Might be the first proper accumulation since april at the lows.
Chart Patterns

CADJPY Bearish Breakout!
HI,Traders !
#CADJPY made a bearish
Breakout of the key horizontal
Level around 107.376 and the
Breakout is confirmed After retesting the key
level which has now become resistance we
Will be expecting a further
Bearish move down !
Comment and subscribe to help us grow !

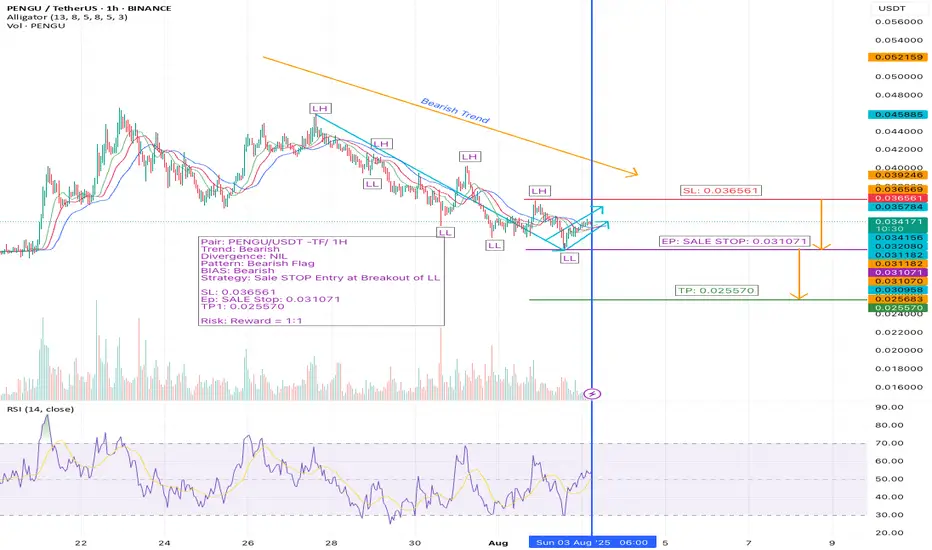
PENGU/USDT 1H Setup – Bearish Flag Breakdown on WatchWe’re analyzing PENGU/USDT on the 1-hour timeframe, and the structure is setting up for a potential continuation to the downside.
🔹 The current trend is bearish
🔹 Price is in a retracement phase, forming a new Lower High (LH)
🔹 A bearish flag pattern is developing — often a strong continuation signal
🔹 We are executing our Sell Stop strategy at the breakout of the Lower Low (LL)
🔹 Expecting a bounce after LH, followed by resumed bearish momentum
📌 Trade Setup Overview:
Pair: PENGU/USDT
Timeframe: 1H
Trend: Bearish
Divergence: None
Pattern: Bearish Flag
Bias: Bearish
Strategy: Sell Stop at LL Breakout
🔻 Entry (EP): 0.031071
🔴 Stop Loss (SL): 0.036561
🟢 Take Profit (TP1): 0.025570
⚖️ Risk:Reward Ratio: 1:1
💼 Why This Trade Stands Out:
✅ Bearish flag within a strong downtrend
✅ Classic LH formation signaling exhaustion of retracement
✅ Tight SL and logical TP based on recent structure
✅ Clean 1:1 setup ideal for short-term swing execution
💬 What do you think about PENGU/USDT?
Are you seeing the same bearish setup? Comment your analysis below 👇
🔔 Follow me for more price action-based setups, altcoin breakdowns, and clean risk-managed trades. Let’s grow and win together! 🚀
#PENGUUSDT #CryptoSetup #BearishFlag #AltcoinAnalysis #PriceActionTrading #1HChart #TrendContinuation #BearishBias #CryptoTechnicalAnalysis #AltcoinBreakout #SellSetup #BearishStructure #RiskReward #TradingStrategy #CryptoSwingTrade #ChartPatterns #BearishTrend #CryptoCommunity #TradeWhatYouSee #CryptoTraders #TradingViewSetup #AltcoinWatchlist #SmartEntry #VolumeAnalysis #CryptoShort


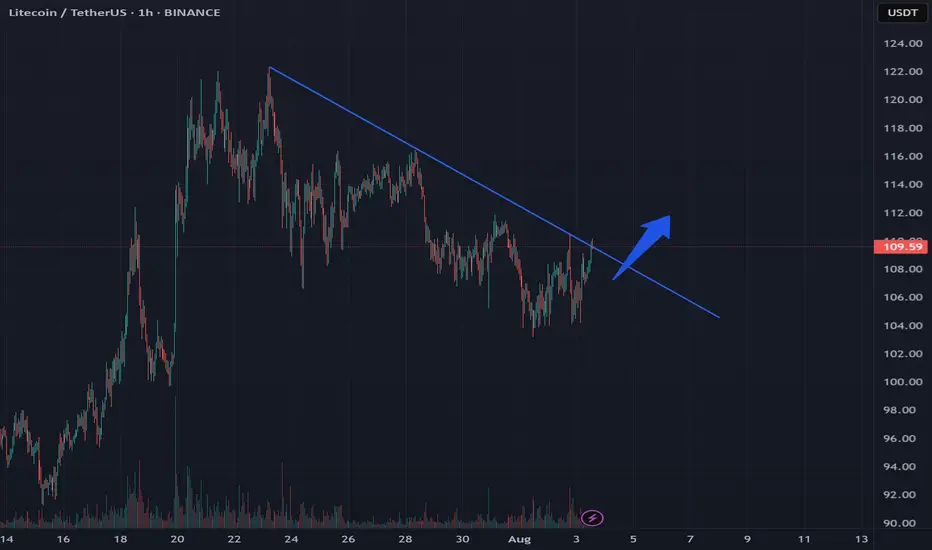
LTC Forms Triangle Pattern Signaling Potential BreakoutLTC is currently forming a triangle pattern on the 4-hour time frame. A break of the upper trend line may indicate an exit from the support zone. Based on historical dynamics, such breaks often lead to upward momentum with a higher probability.
Current price: $108.12
With a higher probability, the price can reach the marks of $111 to $115
The price can also touch the lower marks of $105.4
This analysis is based on the technical pattern and also incorporates AI to provide more accurate results.
FTTUSDT – new accumulation in an interesting zone🚨 This information is intended for thoughtful market participants who are willing to work in this field - not for those chasing gambling, guesswork, or getting stuck in news flow.
Price has returned to the support zone of the outer horizontal channel. Accumulation is currently taking place in this area.
📰 FTX is preparing for its third round of distributions - $1.9 billion, expected around September 30. Marked it on the chart. Whether they shift the date or not, the essence remains unchanged.
Possible scenarios:
1️⃣ A double bottom forms in the lower zone of the channel, with a pattern range of about 60%.
👇
- - - - - - - - - - - - - - - - - - - - - - - - - - - - - - - - - - - - - - - - - - - - - - - - -
2️⃣ Another option is a descending wedge, followed by a breakout on volume, a retest of the breakout zone, and further continuation.
👇
- - - - - - - - - - - - - - - - - - - - - - - - - - - - - - - - - - - - - - - - - - - - - - - - -
3️⃣ Next scenario: sideways consolidation within the current zone, with an inner range of 40% and outer range of 90%, followed by a breakout and movement toward the main targets of the larger channel.
👇
- - - - - - - - - - - - - - - - - - - - - - - - - - - - - - - - - - - - - - - - - - - - - - - - -
❗ I marked the downward (protective) zones on the chart that should be taken into account for each of the proposed scenarios — to align with your strategy. This is important. First the plan - then action.
👇
- - - - - - - - - - - - - - - - - - - - - - - - - - - - - - - - - - - - - - - - - - - - - - - - -
📌 P.S. In fact, everything is simpler than it seems.
I believe time is a key factor.
The main thing is to be ready for different scenarios before the final move.
There’s nothing to guess here.
Even if you add another pattern, it won’t change the core idea.

Seven topics explaining why Ethereum might be heading towards atSeven topics explaining why Ethereum might be heading towards at least $4,500 after returning to its trend:
1. Market Sentiment and Bullish Reversal
When Ethereum breaks out of a consolidation phase or a downtrend, it often signals a shift in market psychology. A bullish reversal can be triggered by technical patterns such as ascending triangles, breakouts above key resistance levels, or bullish candlestick formations. Positive news (e.g., regulatory clarity, major partnerships, or favorable market reports) enhances investor confidence. Once traders recognize a trend reversal, it leads to increased buying momentum, further propelling ETH higher. This shift in sentiment often acts as a self-fulfilling prophecy, attracting more capital into the asset.
2. Institutional Adoption and Investment
Institutional investors, including hedge funds, asset managers, and pension funds, play a crucial role in cryptocurrency price dynamics. Large-scale investments, ETFs, or custodial solutions designed for institutional clients can generate significant buy pressure. Notable endorsements from major financial firms or integration of Ethereum-based products into mainstream financial platforms can serve as a validation, encouraging broader participation. This institutional involvement often brings stability and confidence, supporting sustained upward movement towards higher targets like $4,500.
3. DeFi and NFT Growth
Ethereum's ecosystem is the backbone of the decentralized finance (DeFi) sector and NFTs. The expanding adoption of DeFi applications (lending, borrowing, staking) and booming NFT markets increase demand for ETH, since it is essential for transaction fees and smart contract execution. As new projects and use cases emerge, the utility of ETH grows, directly impacting its value. Additionally, mainstream adoption of DeFi and NFTs draws more retail and institutional investors into the ecosystem, contributing to price appreciation.
4. Network Developments
Ethereum continues to undergo significant upgrades to address scalability, security, and sustainability. Ethereum 2.0, with features like proof-of-stake (PoS) consensus, shard chains, and Layer 2 scaling solutions (like Rollups), greatly enhance network efficiency. These upgrades improve user experience and reduce transaction costs, making Ethereum more attractive for developers and users. The improving technology infrastructure can result in increased transaction volume, user activity, and investor confidence, which collectively drive the price upward.
5. Macro and Cryptocurrency Market Factors
Broader macroeconomic conditions influence Ethereum’s price. A declining dollar, inflation concerns, or global economic uncertainty can push investors toward alternative assets like cryptocurrencies. Bitcoin’s market movement often correlates with ETH, and a bullish Bitcoin trend can lift ETH prices as well. Additionally, positive regulatory developments or a general rally in the crypto market can create a favorable environment, supporting Ethereum’s ascent to higher levels.
6. Technical Indicators
Traders rely heavily on technical analysis. Breakouts above significant resistance levels (e.g., previous highs around $3,500 or $4,000), increased trading volume, and bullish chart patterns such as flags or bullish divergence reinforce the upward trend. These technical signals attract momentum traders and institutional players, which accelerate the price increase. Consistent bullish technicals contribute to a self-sustaining upward trajectory toward the $4,500 target.
7. Supply Dynamics
Ethereum's supply mechanics significantly influence its price. The implementation of EIP-1559 introduced a fee-burning mechanism that reduces circulating supply over time, creating a deflationary pressure. When network activity is high, more ETH is burned, decreasing supply and potentially increasing scarcity. Furthermore, the transition to Ethereum 2.0's proof-of-stake reduces issuance, limiting new ETH supply entering the market. These supply-side dynamics, combined with growing demand, can lead to significant appreciation, moving ETH toward and beyond the $4,500 level.

Bitcoin Price Analysis: Price headed to $118,100Bitcoin Price Analysis: Price headed to $118,100.
The Bitcoin price chart reveals a clear picture of the asset’s recent behavior. After consolidating within a trading range between $116,000 and $120,000 for over two weeks, Bitcoin broke below the southern boundary of this range on Wednesday evening. This correction began shortly after the US Federal Reserve announced its decision to maintain interest rates, ignoring calls from former President Donald Trump for a rate reduction. The Bitcoin live price dipped to $112,700, a three-week low, signaling a shift in market sentiment.
From a technical perspective, Bitcoin’s chart shows it has been moving within a descending channel since March 2024. The recent break below the $116,000 support level indicates a potential for further downside if momentum remains weak. Key support levels to monitor include $110,000, which aligns with historical price action, and a deeper support at $84,500, as suggested by technical analyst Katie Stockton. Conversely, resistance levels are observed at $118,100, where Bitcoin is expected to recover in the near term, and $120,000, a psychological barrier that could signal a bullish breakout if breached.

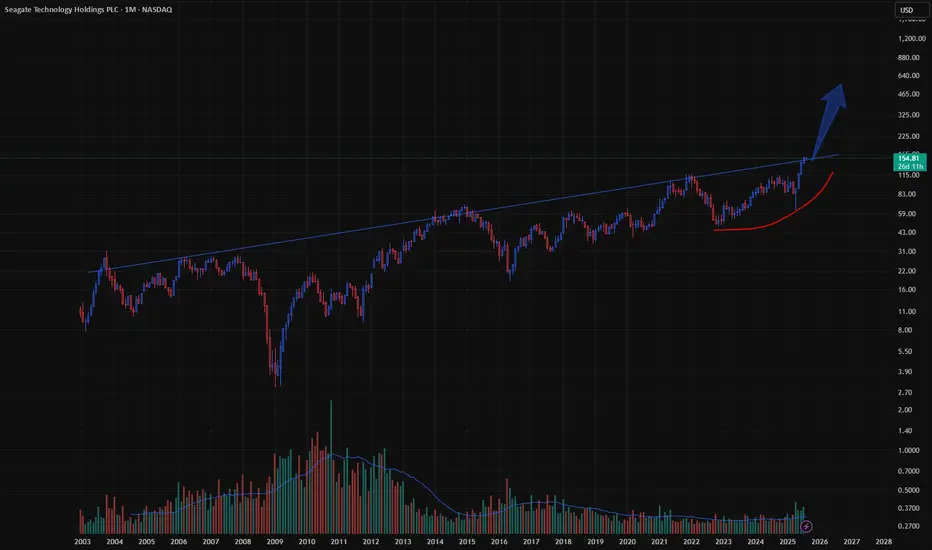
Seagate Technology Holdings (STX) – Technically Bullish SetupSeagate Technology Holdings (STX) – Technically Bullish Setup | Multibagger Potential 🚀
Ticker: NASDAQ:STX
Sector: Technology – Data Storage
Technical View:
Seagate Technology Holdings is showing strong bullish momentum on the charts. The price has broken out of recent consolidation with high volume support, signaling strong institutional interest.
✅ Strong breakout above key resistance zone
Momentum is building up, and this kind of structure often precedes major rallies. If current levels hold, STX has the potential to become a multibagger over the medium to long term.
ETH to + $4,5007 topics explaining why Ethereum might be heading towards at least $4,500 after returning to its trend:
1. Market Sentiment and Bullish Reversal
When Ethereum breaks out of a consolidation phase or a downtrend, it often signals a shift in market psychology. A bullish reversal can be triggered by technical patterns such as ascending triangles, breakouts above key resistance levels, or bullish candlestick formations. Positive news (e.g., regulatory clarity, major partnerships, or favorable market reports) enhances investor confidence. Once traders recognize a trend reversal, it leads to increased buying momentum, further propelling ETH higher. This shift in sentiment often acts as a self-fulfilling prophecy, attracting more capital into the asset.
2. Institutional Adoption and Investment
Institutional investors, including hedge funds, asset managers, and pension funds, play a crucial role in cryptocurrency price dynamics. Large-scale investments, ETFs, or custodial solutions designed for institutional clients can generate significant buy pressure. Notable endorsements from major financial firms or integration of Ethereum-based products into mainstream financial platforms can serve as a validation, encouraging broader participation. This institutional involvement often brings stability and confidence, supporting sustained upward movement towards higher targets like $4,500.
3. DeFi and NFT Growth
Ethereum's ecosystem is the backbone of the decentralized finance (DeFi) sector and NFTs. The expanding adoption of DeFi applications (lending, borrowing, staking) and booming NFT markets increase demand for ETH, since it is essential for transaction fees and smart contract execution. As new projects and use cases emerge, the utility of ETH grows, directly impacting its value. Additionally, mainstream adoption of DeFi and NFTs draws more retail and institutional investors into the ecosystem, contributing to price appreciation.
4. Network Developments
Ethereum continues to undergo significant upgrades to address scalability, security, and sustainability. Ethereum 2.0, with features like proof-of-stake (PoS) consensus, shard chains, and Layer 2 scaling solutions (like Rollups), greatly enhance network efficiency. These upgrades improve user experience and reduce transaction costs, making Ethereum more attractive for developers and users. The improving technology infrastructure can result in increased transaction volume, user activity, and investor confidence, which collectively drive the price upward.
5. Macro and Cryptocurrency Market Factors
Broader macroeconomic conditions influence Ethereum’s price. A declining dollar, inflation concerns, or global economic uncertainty can push investors toward alternative assets like cryptocurrencies. Bitcoin’s market movement often correlates with ETH, and a bullish Bitcoin trend can lift ETH prices as well. Additionally, positive regulatory developments or a general rally in the crypto market can create a favorable environment, supporting Ethereum’s ascent to higher levels.
6. Technical Indicators
Traders rely heavily on technical analysis. Breakouts above significant resistance levels (e.g., previous highs around $3,500 or $4,000), increased trading volume, and bullish chart patterns such as flags or bullish divergence reinforce the upward trend. These technical signals attract momentum traders and institutional players, which accelerate the price increase. Consistent bullish technicals contribute to a self-sustaining upward trajectory toward the $4,500 target.
7. Supply Dynamics
Ethereum's supply mechanics significantly influence its price. The implementation of EIP-1559 introduced a fee-burning mechanism that reduces circulating supply over time, creating a deflationary pressure. When network activity is high, more ETH is burned, decreasing supply and potentially increasing scarcity. Furthermore, the transition to Ethereum 2.0's proof-of-stake reduces issuance, limiting new ETH supply entering the market. These supply-side dynamics, combined with growing demand, can lead to significant appreciation, moving ETH toward and beyond the $4,500 level.

USDJPY - Long 152.90USDJPY Expected to longer. The pair will see 152.90 levels. The Pair is expected to retrace to the levels of 145.24 before flying high.

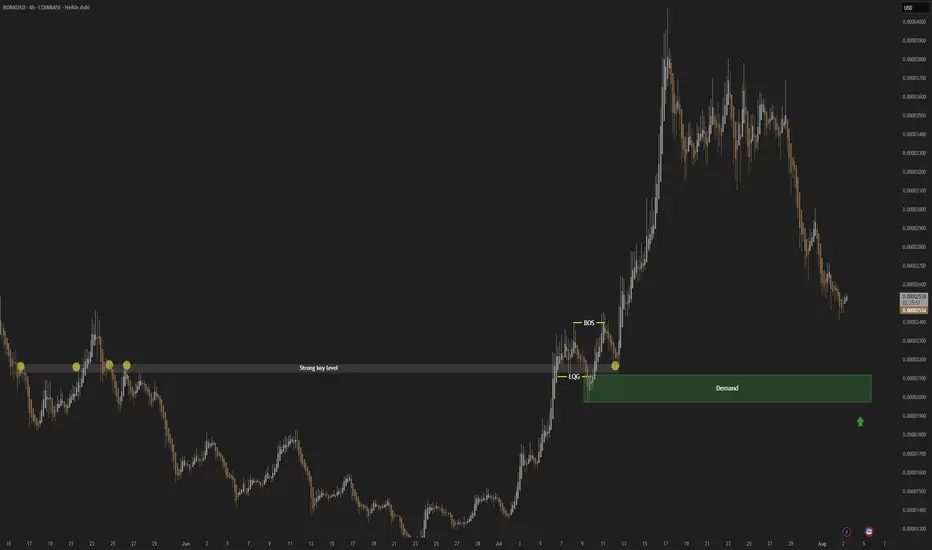
BONK; Heikin Ashi Trade Idea📈 Hey Traders!
Here’s a fresh outlook from my trading desk. If you’ve been following me for a while, you already know my approach:
🧩 I trade Supply & Demand zones using Heikin Ashi chart on the 4H timeframe.
🧠 I keep it mechanical and clean — no messy charts, no guessing games.
❌ No trendlines, no fixed sessions, no patterns, no indicator overload.
❌ No overanalyzing market structure or imbalances.
❌ No scalping, and no need to be glued to the screen.
✅ I trade exclusively with limit orders, so it’s more of a set-and-forget style.
✅ This means more freedom, less screen time, and a focus on quality setups.
✅ Just a simplified, structured plan and a calm mindset.
💬 Let’s Talk:
💡Do you trade supply & demand too ?
💡What’s your go-to timeframe ?
💡Ever tried Heikin Ashi ?
📩 Got questions about my strategy or setup? Drop them below — ask me anything, I’m here to share.
Let’s grow together and keep it simple. 👊
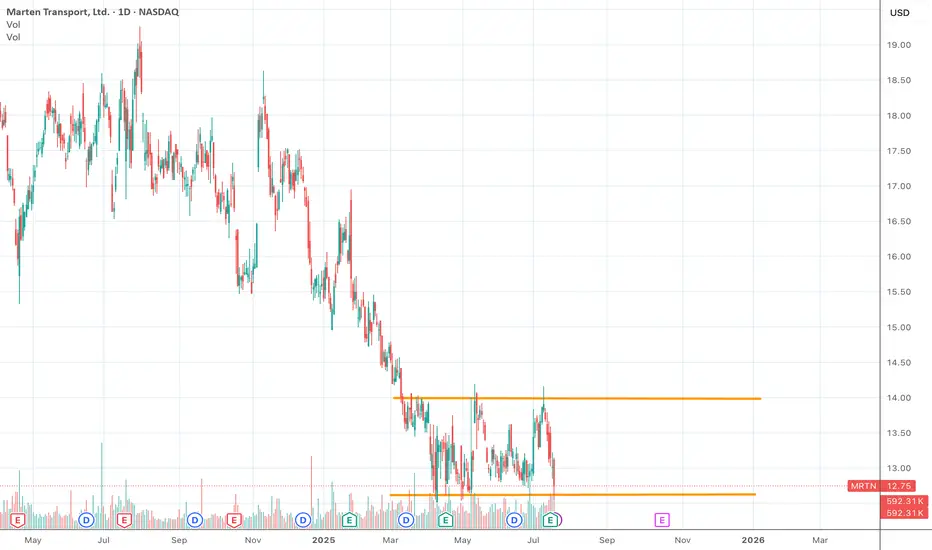
Marten Transport - Rectangle bottomBuy now @ 12.75
Stop lost when candle close below 12.50
Take profit at 16
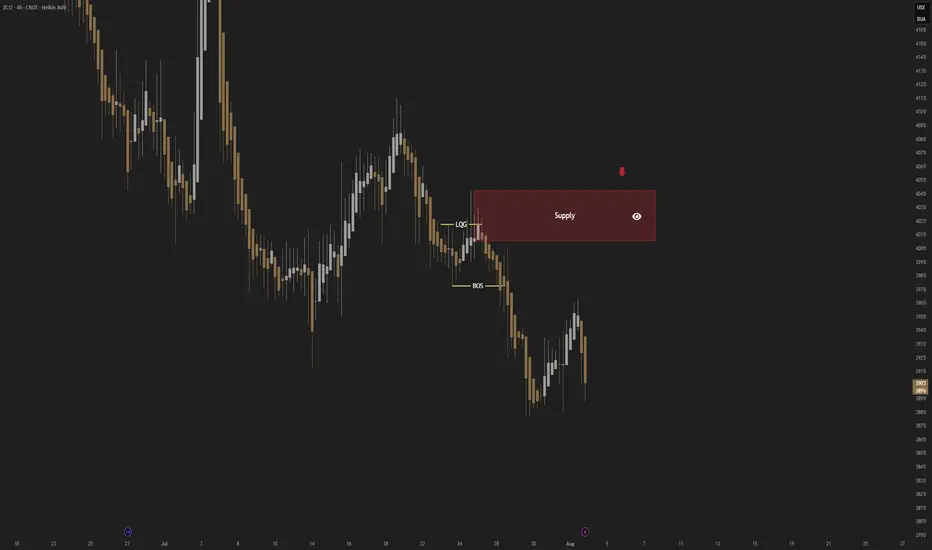
CORN; Heikin Ashi Trade Idea📈 Hey Traders!
Here’s a fresh outlook from my trading desk. If you’ve been following me for a while, you already know my approach:
🧩 I trade Supply & Demand zones using Heikin Ashi chart on the 4H timeframe.
🧠 I keep it mechanical and clean — no messy charts, no guessing games.
❌ No trendlines, no fixed sessions, no patterns, no indicator overload.
❌ No overanalyzing market structure or imbalances.
❌ No scalping, and no need to be glued to the screen.
✅ I trade exclusively with limit orders, so it’s more of a set-and-forget style.
✅ This means more freedom, less screen time, and a focus on quality setups.
✅ Just a simplified, structured plan and a calm mindset.
💬 Let’s Talk:
💡Do you trade supply & demand too ?
💡What’s your go-to timeframe ?
💡Ever tried Heikin Ashi ?
📩 Got questions about my strategy or setup? Drop them below — ask me anything, I’m here to share.
Let’s grow together and keep it simple. 👊

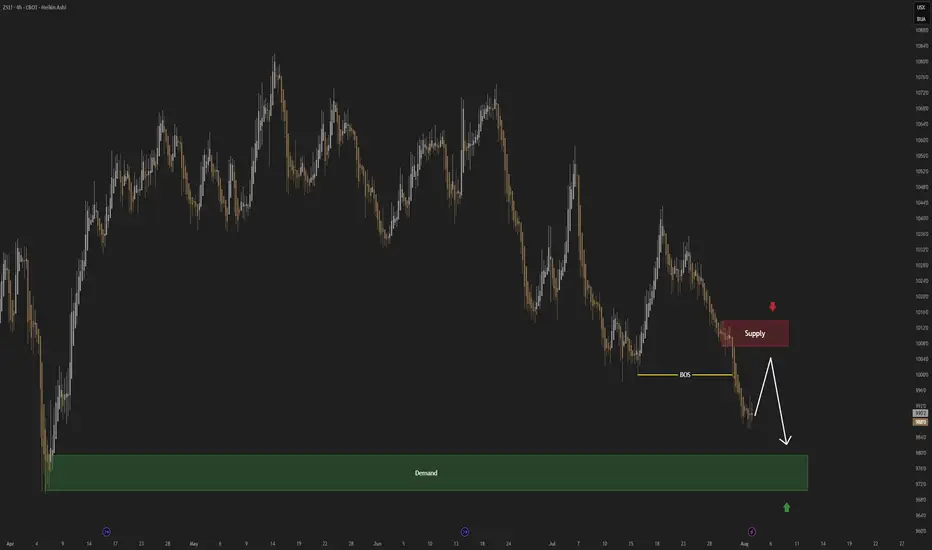
SOYBEAN; Heikin Ashi Trade Idea📈 Hey Traders!
Here’s a fresh outlook from my trading desk. If you’ve been following me for a while, you already know my approach:
🧩 I trade Supply & Demand zones using Heikin Ashi chart on the 4H timeframe.
🧠 I keep it mechanical and clean — no messy charts, no guessing games.
❌ No trendlines, no fixed sessions, no patterns, no indicator overload.
❌ No overanalyzing market structure or imbalances.
❌ No scalping, and no need to be glued to the screen.
✅ I trade exclusively with limit orders, so it’s more of a set-and-forget style.
✅ This means more freedom, less screen time, and a focus on quality setups.
✅ Just a simplified, structured plan and a calm mindset.
💬 Let’s Talk:
💡Do you trade supply & demand too ?
💡What’s your go-to timeframe ?
💡Ever tried Heikin Ashi ?
📩 Got questions about my strategy or setup? Drop them below — ask me anything, I’m here to share.
Let’s grow together and keep it simple. 👊

BTC Vs AI ? timing 115500
Hi,
I asked AI to give timing for a trade if momentum is the same
Now, time to travel 2,000 units = distance / rate = 2,000 units / 500 units per hour = 4 hours.
So, it would take 4 hours to travel from 113,500 to 115,500 assuming the same travel rate
Woow.. get ready guys
If it don't happen.. blame AI hahaha
Beach here we come.. :)
All the best
Not a guru


waiting for a bullish candleif a bullish candle complet we have morning star three candle we could hope next target is 164 and 168 !
