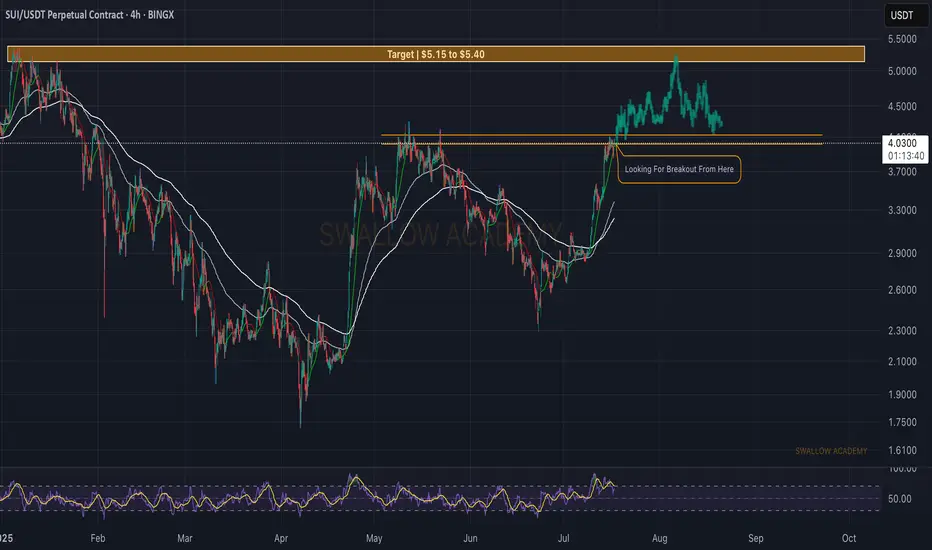
Sui (SUI): Looking For BOS (Break of Structure) Sui coin looks strong, where we are about to get a proper BOS (Break of Structure), which then would give us an ideal opportunity for a long position up until $5.40, where our target is sitting currently.
Once there we expect to see some sort of correction or sideways movement, before next wave of upward movement.
Swallow Academy
Chart Patterns
Weekly/monthly bullflag on xrpusdAn even higher target than the symmetrical triangles two potential targets materializes when we confirm the breakout up from this bull flag. It will likely have a bullish target somewhere around $5.20. Upon reaching this target it will also be breaking above a big cup and handle that will then have an even higher breakout target which I will post in my next idea *not financial advice*

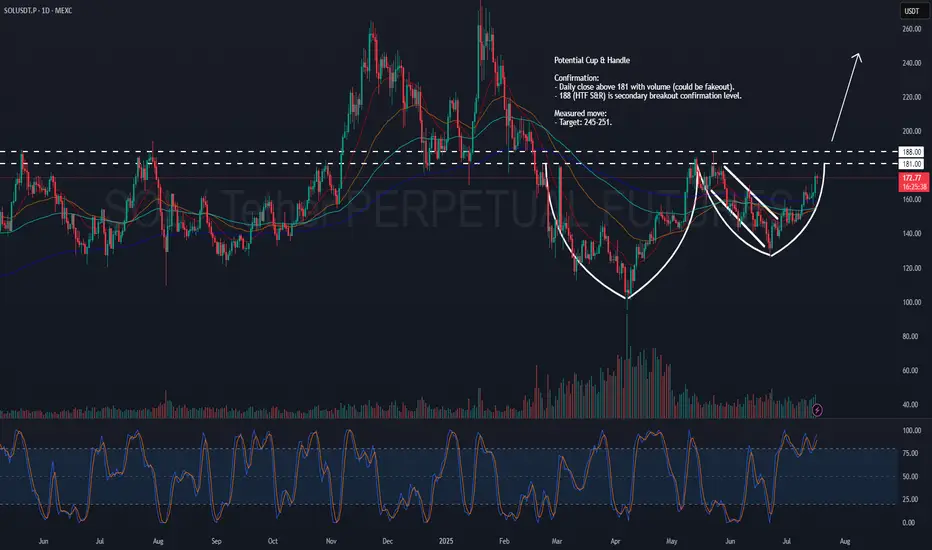
SOL – Potential Cup & HandleSOL might be shaping up to be a pretty clean cup & handle .
Could be big, but we’re not there just yet.
Levels I’m watching:
181: Main neckline. Want to see a daily close above with volume.
188: HTF S&R — secondary confirmation. Clears this, and I’d say the move is real.
Measured target:
Somewhere around 245–251 if it plays out.
Let’s see if SOL has more in the tank.
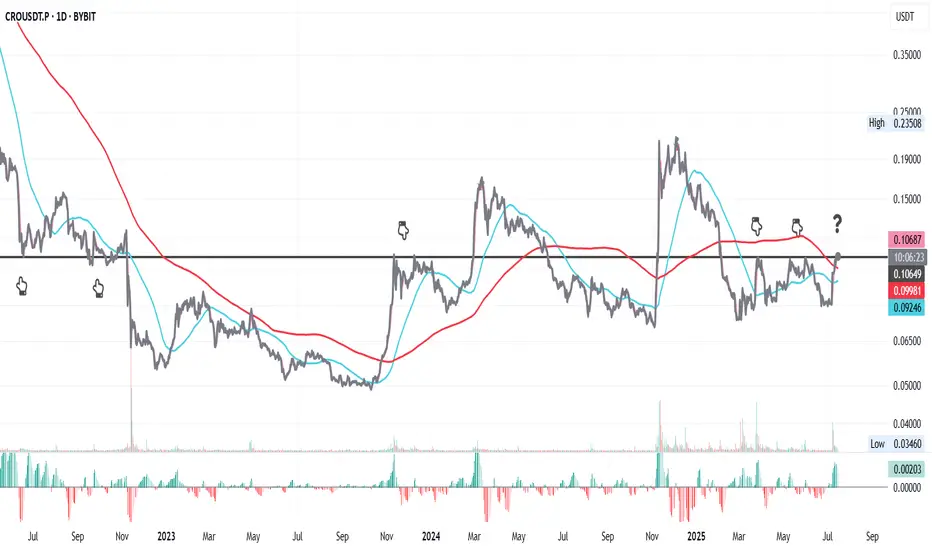
CRO at a Turning Point ?This is CRO on the daily chart.
Price has interacted multiple times with the key resistance at **0.10649** (black line). It’s now testing that level again, and there's a real possibility it flips it into support.
On top of that, CRO is attempting to reclaim the 200MA, while the 50MA is starting to flatten out—potential signs of a longer-term shift.
That said, this process might take some time and could be volatile. CRO’s relatively small market cap of \$3.33B and this week’s major macro events (starting today with CPI) could add pressure in both directions.
Always take profits and manage risk.
Interaction is welcome.
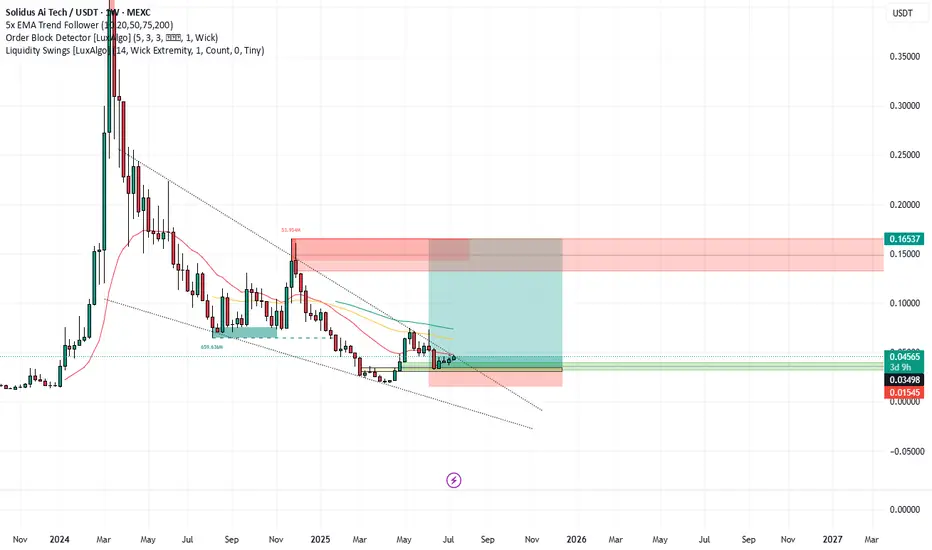
BREAK OUT ABOUT TO COMMENCE FOR SOLIDUS AI?Breakout falling wedge?
Market structure
Order block
Binance alpha
#PEOPLE/USDT Breakout in Action ! #PEOPLE
The price is moving within a descending channel on the 1-hour frame, adhering well to it, and is on its way to breaking it strongly upwards and retesting it.
We have a bounce from the lower boundary of the descending channel. This support is at 0.01980.
We have a downtrend on the RSI indicator that is about to break and retest, supporting the upward move.
There is a key support area in green at 0.02000, which represents a strong basis for the upward move.
Don't forget one simple thing: ease and capital.
When you reach the first target, save some money and then change your stop-loss order to an entry order.
For inquiries, please leave a comment.
We have a trend of stability above the Moving Average 100.
Entry price: 0.02056
First target: 0.02111
Second target: 0.02190
Third target: 0.02265
Don't forget one simple thing: ease and capital.
When you reach the first target, save some money and then change your stop-loss order to an entry order.
For inquiries, please leave a comment.
Thank you.

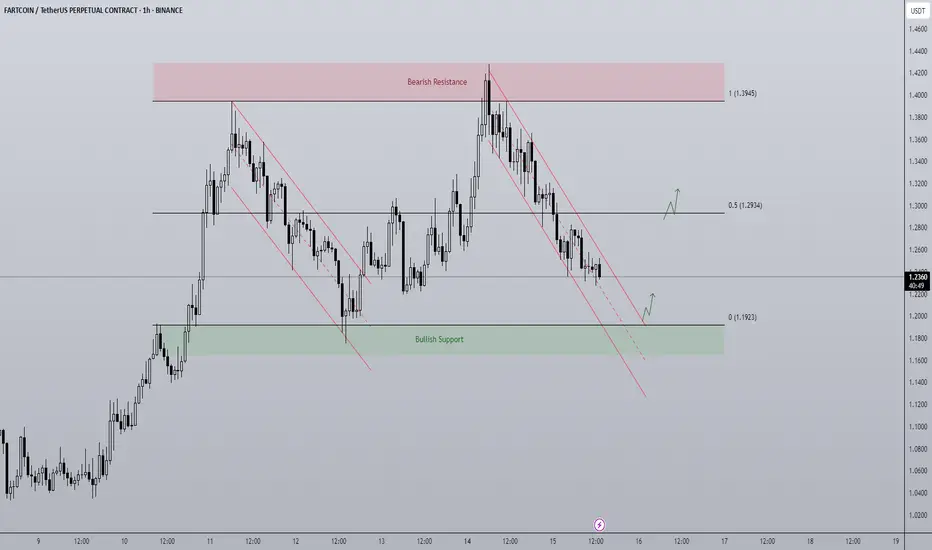
Fartcoin - Rangebound repeat? A BTC makes new highs attention has turned towards altcoins to play catch up.
FARTCOIN has been a top performer of the last month and currently on the 1D timeframe finds itself in a rangebound environment capped between $1.1923 - $1.3945. The end of last week price trended down in a bearish channel from top to bottom and it looks to be doing the same currently. As the supply zone above the range high got swept, price printed a SFP getting back inside the range and began trending down, for me there are two actionable long entries here:
- A range low bounce + breakout of trend channel would be an ideal long entry. An area of clear support coupled with a breakout is a historically strong setup with a clear invalidation if price breaks below the range and gets accepted.
- A more aggressive but potentially less ideal setup would be a breakout of the downtrend before hitting range lows. Higher risk as the level of support is not as defined but in the more risk-on environment crypto is currently in, the chance of major support levels being front run does go up as buyers become more impatient when FOMO grows.
The midpoint is key level to look out for too as a reclaim would mean a run at the highs, rejection opens the door to retest the lows.
"FRA40/CAC40 HEIST! Bullish Loot Before Bear Trap – Act Fast!"💰 FRA40/CAC40 "FRANCE40" INDEX HEIST – THIEF TRADING STYLE MASTER PLAN 🏴☠️🚀
🔥 Steal the Market Like a Pro – Bullish Loot & Escape Before the Trap! 🔥
🤑 GREETINGS, FELLOW MONEY MAKERS & MARKET ROBBERS!
🌟 Hi! Hola! Ola! Bonjour! Hallo! Marhaba! 🌟
This is your VIP invite to the ultimate FRA40/CAC40 heist! Based on the 🔥Thief Trading Style🔥, we’re locking in a bullish raid before the bears set their trap. Time to swipe the loot & escape like a pro!
📜 THE HEIST BLUEPRINT – TECHNICAL & FUNDAMENTAL RAID PLAN
🎯 ENTRY POINT: "THE VAULT IS OPEN!"
📈 Long Entry: The market’s handing out free cash—swipe bullish positions at any price!
🔄 Pro Thief Move: Use buy limit orders within 15-30 min timeframe for pullback entries.
🎲 DCA/Layering Strategy: Deploy multiple limit orders to maximize loot & minimize risk.
🛑 STOP LOSS – SAFETY NET FOR THIEVES
SL at Nearest Swing Low (4H TF): 7650.00 (Adjust based on your risk, lot size & entry layers).
⚠️ Warning: Bears are lurking—don’t get caught in their trap!
🏆 TAKE PROFIT – ESCAPE BEFORE THE POLICE ARRIVE!
🎯 Primary Target: 8060.00 (or exit early if the market turns sketchy).
🚨 Danger Zone: Yellow MA Zone (Overbought, Reversal Risk, Bear Trap!)
📡 FUNDAMENTAL BACKUP – WHY THIS HEIST WILL WORK
💰 France40 is riding bullish momentum due to:
Strong Macro Data (Eurozone recovery signals)
Institutional Buying (COT Report Insights)
Geopolitical Calm (For Now… Stay Alert!)
Index-Specific Strength (Tech & Luxury Stocks Leading)
🔗 For full analysis (Fundamentals, COT, Intermarket Trends, Sentiment Score):
👉 Check the Liinkk 🔗! 👈
🚨 TRADING ALERT – NEWS & POSITION MANAGEMENT
📰 High-Impact News = Market Chaos! Protect Your Loot:
❌ Avoid new trades during major news drops.
🔐 Use Trailing Stops to lock profits & dodge sudden reversals.
💥 BOOST THE HEIST – SUPPORT THE MISSION!
🚀 Hit the "Boost" button to strengthen our robbery squad!
💰 More boosts = More profitable raids!
🎉 Let’s dominate the market daily with the Thief Trading Style!
🔐 DISCLAIMER (LEGAL SAFETY NET)
This is NOT financial advice—just a strategic raid plan. Trade at your own risk. Markets change fast; adapt or get caught!
🤑 Stay tuned for the next heist… The vaults won’t rob themselves! 🐱👤💨

USDJPY SELL IDEAAfter yesterday's spiky move caused by d.trump
Market should correct some of those imbalance soon
Target at the ERL

BTCUSD Time to Short BTC was rejected form the recent resistance area and is likely to go down to around 140000. Wait for breakdown of the support
Gold underwear: 3300-3310Gold underwear: 3300-3310
As shown in the figure:
Today, the gold price is once again facing the test of the 3300-3310 support level
As today's title: Gold price underwear is coming
A new round of long-short battle is about to break out
As early as next week, there is a high probability that a historic market will be ushered in.
From the macro structure, the gold price has reached the end of the shock, and the long and short sides are currently in serious disagreement.
Surging stalemate range: 3310-3375
As of now, the gold price: 3315-3320 range shock
The next strategy is very clear:
1: As long as the gold price is above 3310, it is the best range for bottom-fishing and long, and the stop loss is set at 3300-3295.
2: Once it breaks through 3310, bulls need to be cautious and be alert to the possibility of a sharp decline. As long as the gold price stabilizes below 3300, it can be directly transferred to short-term trading, and the stop loss is set at 3310-3315.
I prefer to follow the big trend and see it as a strategy to buy at a low price.
Buy: 3310-3315
Stop loss: 3300-3295
Target: 3350-3375

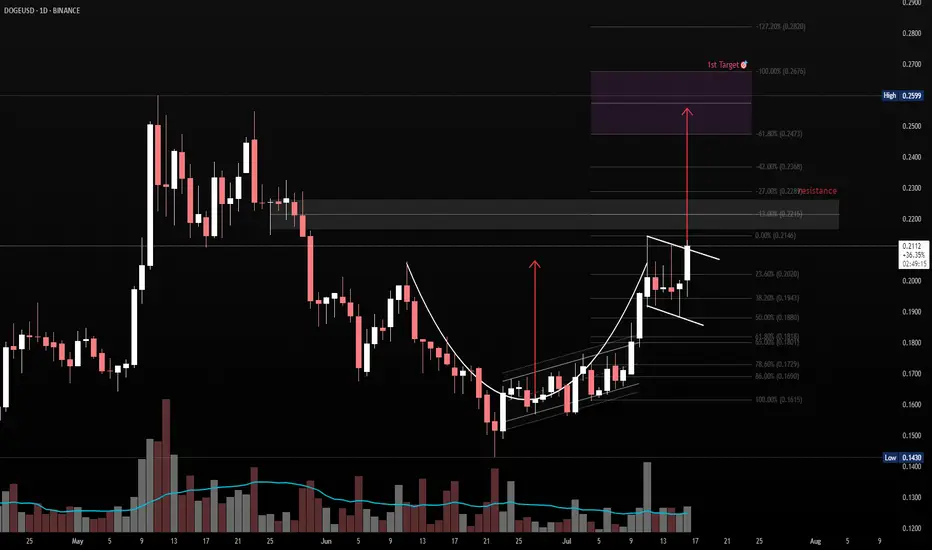
Cup & Handle Breakout Watch – DOGE/USDTPattern: Cup & Handle
Timeframe: 1D
Cup Range: $0.168 → $0.212
Handle: Forming as a descending bull flag
Breakout Level: ~$0.2125
Measured Target: ~$0.256
Confluence:
Clean rounded base (cup)
Tight flag pullback (handle)
Volume decrease during handle = healthy
Prior resistance aligns with projected target zone
Bias: Bullish (on breakout with volume confirmation)
📌 Watching for breakout above handle resistance with rising volume to confirm entry. Measured move aligns with historical supply zone.
After break out from 0.216~0.226
Target Zone: 0.24~0.26
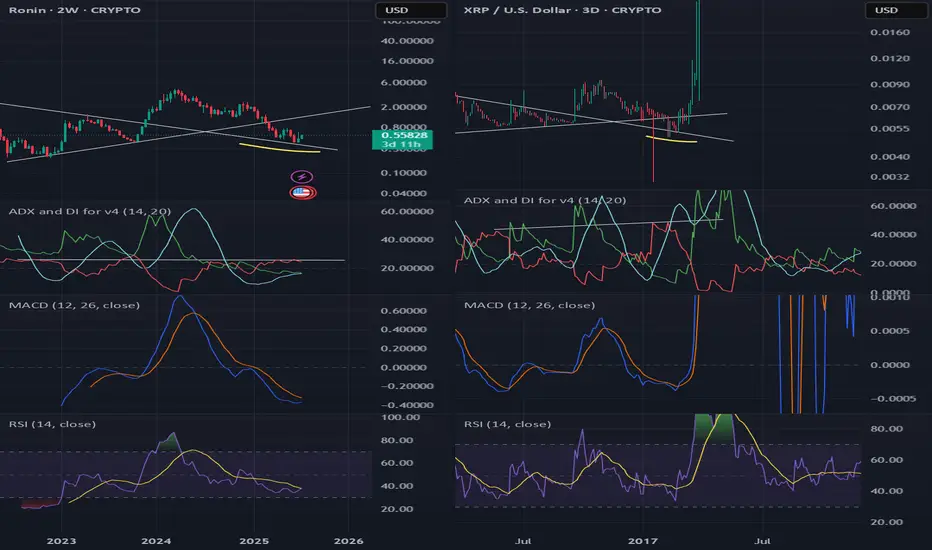
XRP of 2025 is not XRP of 2017. But Ronin could be.You guys need to have some self awareness, that the magic happens just once, maybe twice in life. The 700x+ move in 2017 isnt happening in 2025. 2024-2025 is different, up? yes xrp will go up but not 1000x.
Gold----Sell near 3357, target 3330---3320Gold market analysis:
Yesterday's gold daily Asian session was still a normal shock drop. We sold at 3340 and 3341 twice to 3322 to make all profits. 3320 is the previous low point and the moving average support position. This position is also a strong support today. Yesterday, the Trump and Powell incidents made gold strongly rise to around 3377. In addition, the Middle East bully bombed Syria again, which is also the main reason for the surge in gold. However, the fundamentals are only short-lived. In the end, the gold daily line closed positive, but closed with a super long upper shadow line. Selling is still not dead. Today's gold buying and selling have opportunities, and the possibility of a direct decline is small. I estimate that the Asian session will be repaired, and our ideas for buying and selling in the Asian session can be intercepted. If it breaks 3320, consider chasing and selling again, which means that selling has started again.
The highest rebound in the Asian session was around 3352, and the highest position in 1 hour was around 3357. Today's small suppression in the white session is 3357. The following support focuses on two positions, one is 3320, and the other is 3330. I estimate that the fluctuation range of the Asian session is 3320-3357. Let's observe and wait for the position in the Asian session.
Pressure 3352 and 3357, strong pressure 3366, support 3320 and 3330, and the watershed of strength and weakness in the market is 3350.
Fundamental analysis:
Trump's dissatisfaction with Powell has not been a day or two, and the conflict is inevitable. The impact on gold is also short-term. Yesterday's pull-up and dive is a case in point.
Operation suggestion:
Gold----Sell near 3357, target 3330---3320

Fractal Heaven!!To me this seems like the perfect outcome of why we're starting to really push up! We've had 3 clear fractals in play on the moves higher. And you can see at the green line, it all flattened out, and it showed with the first 2 fractals that it wasn't heading lower. Fractals are incredible indicators as you can see.

Total crypto MC - 1DThe total crypto market capitalization on the daily timeframe has formed a Falling Wedge pattern, which is typically a bullish reversal pattern. The price has broken out above the upper resistance line of the wedge, confirming the breakout. Currently, the price is undergoing a retest of the breakout level, which now acts as support. If this support holds successfully, it is expected that the market will experience an upward move in the near term, signaling potential bullish momentum.

GBP/AUD Ready To Go Up After Melted , 2 Entries Valid !Here is my GBP/AUD 1H Chart and this is my opinion , the price moved very hard to downside without any correction and the price at strong support now 2.05000 which is forced the price many times to go up , so it`s my best place to enter a buy trade , and if you checked the chart you will see the price now creating a reversal pattern and i put my neckline and if we have a closure above it to confirm the pattern we can enter another entry to increase our contracts . if we have a daily closure below my support area then this idea will not be valid anymore .

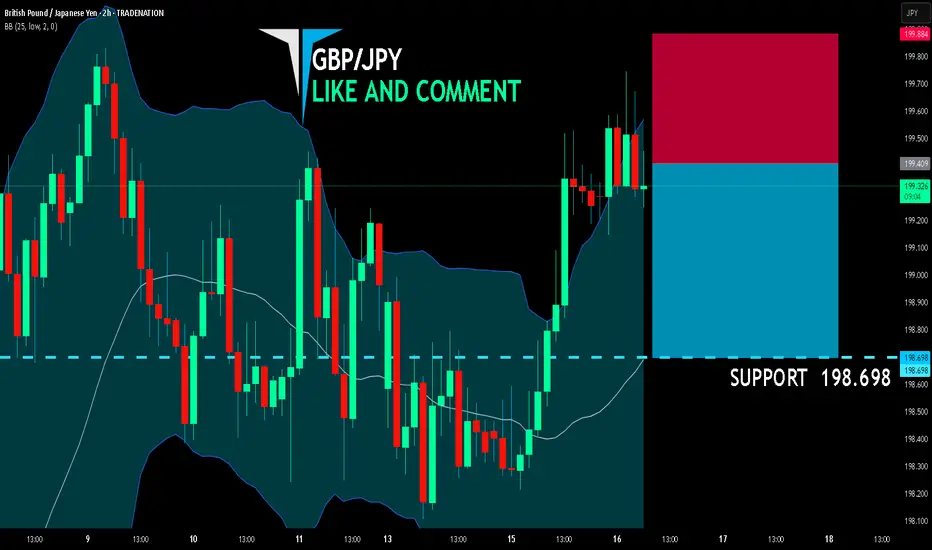
GBP/JPY BEARISH BIAS RIGHT NOW| SHORT
GBP/JPY SIGNAL
Trade Direction: short
Entry Level: 199.409
Target Level: 198.698
Stop Loss: 199.884
RISK PROFILE
Risk level: medium
Suggested risk: 1%
Timeframe: 2h
Disclosure: I am part of Trade Nation's Influencer program and receive a monthly fee for using their TradingView charts in my analysis.
✅LIKE AND COMMENT MY IDEAS✅
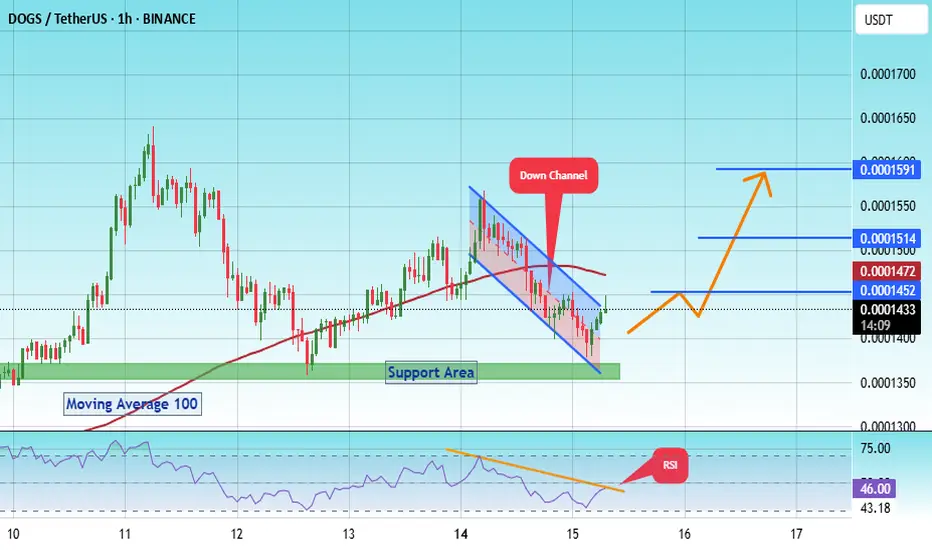
#DOGS/USDT – Launchpad or Breakdown?#DOGS
The price is moving within a descending channel on the 1-hour frame, adhering well to it, and is on its way to breaking it strongly upwards and retesting it.
We have a bounce from the lower boundary of the descending channel. This support is at 0.0001385.
We have a downtrend on the RSI indicator that is about to break and retest, supporting the upward trend.
There is a key support area in green at 0.0001362, which represents a strong basis for the upward trend.
Don't forget one simple thing: ease and capital.
When you reach the first target, save some money and then change your stop-loss order to an entry order.
For inquiries, please leave a comment.
We have a trend of stability above the Moving Average 100.
Entry price: 0.0001430
First target: 0.0001452
Second target: 0.0001514
Third target: 0.0001590
Don't forget one simple thing: ease and capital.
When you reach the first target, save some money and then change your stop-loss order to an entry order.
For inquiries, please leave a comment.
Thank you.
Gold - The clear top formation!🪙Gold ( TVC:GOLD ) just created a top formation:
🔎Analysis summary:
Over the past four months, Gold has overall been moving sideways. Following a previous blow-off rally of about +25%, this cycle is very similar to the 2008 bullish cycle. Bulls are starting to slow down which will most likely result in the creation of at least a short term top formation.
📝Levels to watch:
$3.000
🙏🏻#LONGTERMVISION
Philip - Swing Trader

End of correction and trend continuation towards 1.195?EURUSD is in an important support area, retesting the bottom line of the wedge. I'm loking foward for any sign of reversal from here.

ATHUSDT.P LONGLet the price touch the level of entry see some bullish momentum buy some at that entry my second entry will be 0.0233 near the second rectangle
Dyor
Always book some profit at 50% and rest put sl to entry .
Need your support guys.. Check my previous analysis..
Thanks
