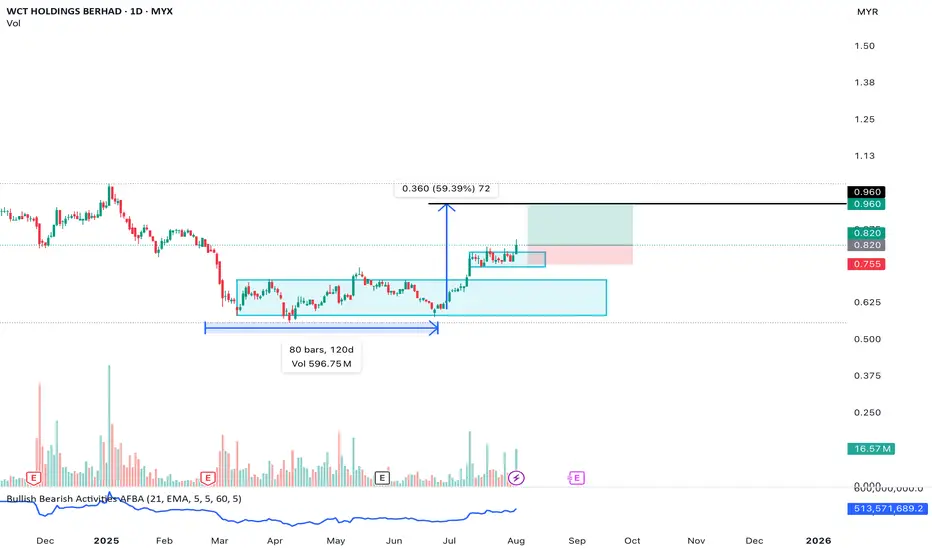
WCT, Front runner of ECRL-Port Klang extension.C : Front runner of ECRL-Port Klang extension.
E : Masih dalam fasa keuntungan + AR lepas increasing. Order book forcasted to be increasing this year.
V : FV analysts minima RM0.96, MIDF. RM1 ke atas other banks. PE kasar 4.7.
W : Breaking out from BUA.
I : Currently ada. Tapi tak dapat cari transaction yg latest.
T : Buy BO BUA, cut loss bila price invalidate the structure.
Chart Patterns
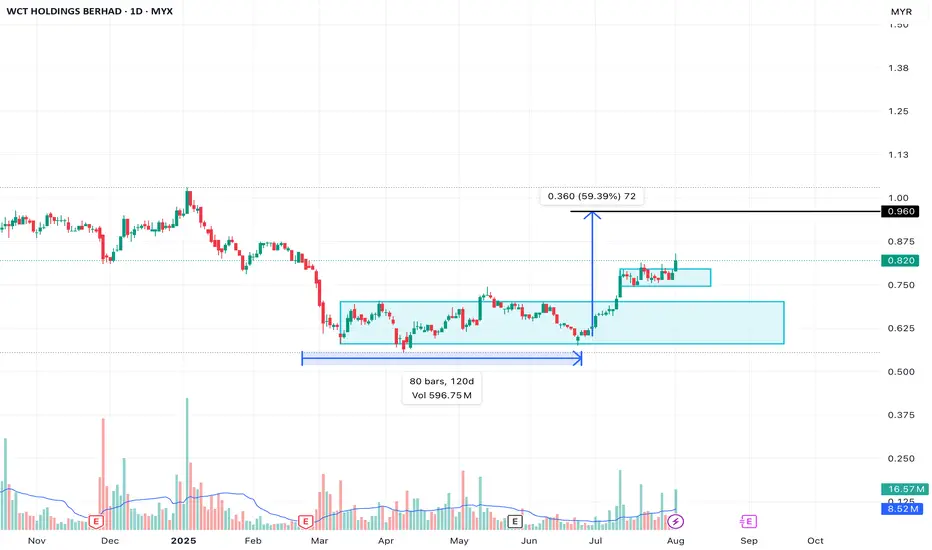
WCT, front runner of ECRL-Port Klang extension.C : Front runner of ECRL-Port Klang extension.
E : Masih dalam fasa keuntungan + AR lepas increasing. Order book forcasted to be increasing this year.
V : FV analysts minima RM0.96, MIDF. RM1 ke atas other banks. PE kasar 4.7.
W : Breaking out from BUA.
I : Currently ada. Tapi tak dapat cari transaction yg latest.
T : Buy BO BUA, cut loss bila price invalidate the structure.
OKLOunder the current administration, OKLO has potential to continue to surge. Two cups, a gap to fill above, the market may continue to pullback but OKLO has potential long.

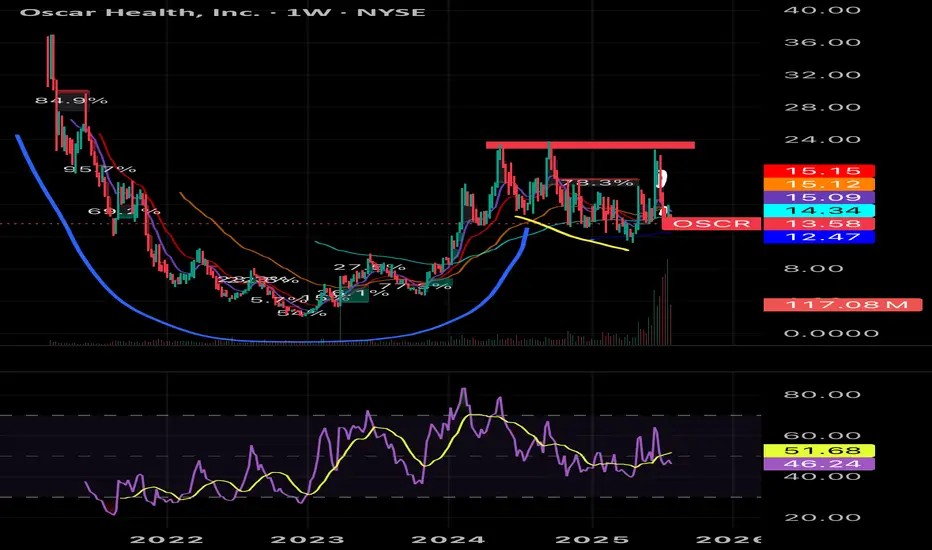
OSCR LONGI know some love and some hate the stock, but from a fundamental standpoint, it's got a lot of potential. Cup and handle. Gaps to fill above. Resistance at 22-24 as of recent. Good Revenue, lots of cash on hand, classic profitable business model, low PE ratio and more all indicate a 30-50 dollar future for Oscar, though the current period will be rocky with the ACA and political climate. Sector is rocky right now and Earnings will also be key as it may drop the stock, but I like shares long personally. Nfa
Walmart's Bullish Possibilities Walmarts wedging, with a gap to fill above from earnings, and buying volume is starting to pick up after being low during the chop. Buying volume may continue to rotate into Walmart and send it up. Nfa

TEM WEDGE Tem's in an interesting position. Multiple bullish and bearish gaps on the daily chart, wedging and tight consolidation, and head and shoulders that indicate a possible bearish continuation. Worth watching.

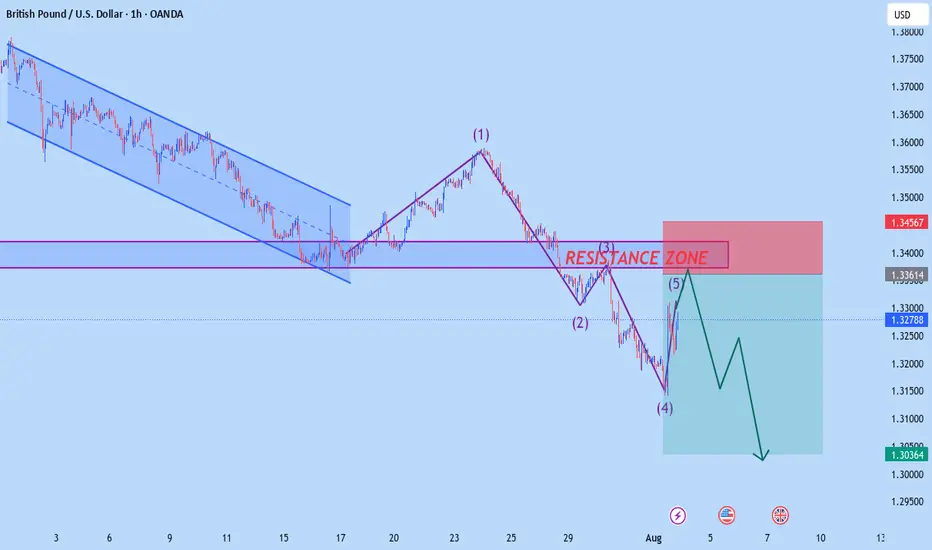
GBPUSD NEW H1 OUTLOOKAccording to H1 analysis GBP market almost at resistance level it will be falling soon from resistance zone we have good oppourtanity to short from here
TRADE AT YOUR OWN RISK
REGARD ALBERT
Pengu - After a 33% dump, Pengu approaches my 1st TargetI anticpate T1 will be hit in the coming days/weeks.
But I will be holding out for T2, for a more ideal entry.
The streets aren't bloody enough yet.
May the trends be with you.

SILVER Move Down Ahead! Sell!
Hello,Traders!
SILVER is about to retest
A horizontal resistance level
Of 37.21$ and its a strong
Key level so after the retest
We will be expecting a
Local pullback
Sell!
Comment and subscribe to help us grow!
Check out other forecasts below too!
Disclosure: I am part of Trade Nation's Influencer program and receive a monthly fee for using their TradingView charts in my analysis.

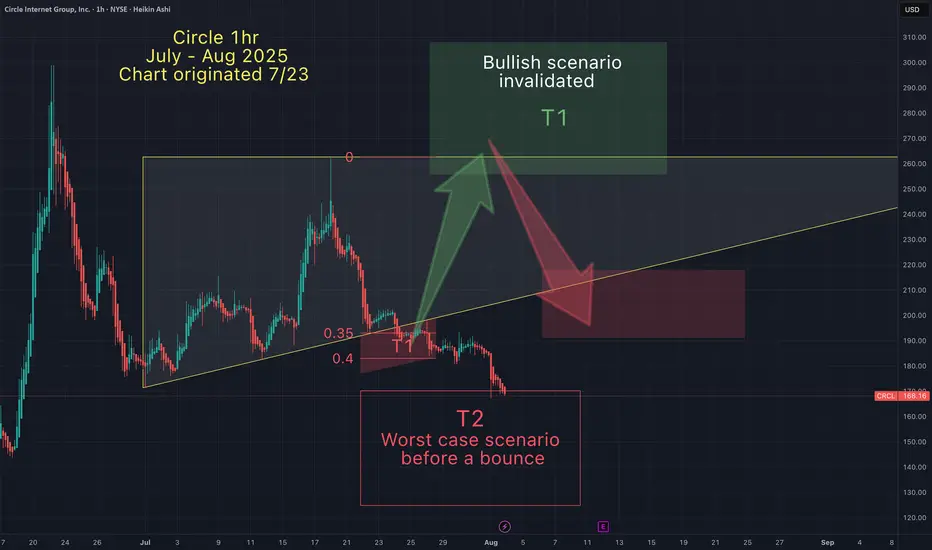
Circle - My Target 2 Hit. Worst case scenario has come true.After a 43% dump, Circle has now enterd my worst case scenario (T2).
There may be lower, before Circle gets a bounce.
-May the trends be with you.
Pair Filtering Process (Quick walkthrough)Hello Traders! 2nd part of Forex Fridays.
Rates are the primary driver to fiat currency markets.

Forensic ForexHello Traders! Was limited to recording software this week. This will suffice till we get something better. Thanks for the support.

Next week's gold price target is above $3,400.Next week's gold price target is above $3,400.
Continue buying on dips.
Any pullback in gold prices next week will be an optimal buying opportunity.
Gold Technical Analysis:
This week's non-farm payroll data demonstrated significant bullish momentum, directly driving gold prices soaring. The price increase has completely erased all of this week's losses, demonstrating exceptionally strong upward momentum.
The current trend shows a significant shift in the balance of power between bulls and bears in the gold market, completely reversing the previous bull-bear pattern.
Gold prices broke through the $3,300 mark and have surged strongly, climbing to $3,362 so far, with no signs of stopping.
Based on this strong performance, it's not impossible for gold prices to test the $3,370 level next week. Bullish forces are clearly dominant in the market.
It's worth noting that the rapid market rally was driven by these strong data.
If you didn't buy in on the initial rally or go long when the price broke through support, subsequent pullbacks may provide few entry opportunities.
Therefore, investors need to be more proactive when selecting entry points.
Specifically for next week's trading:
If the price falls back to 3340, we recommend continuing to buy and maintain a bullish outlook.
Upward resistance levels include 3375-3385.
Overall, the short-term gold strategy for next week recommends buying on dips.
Upward resistance levels are 3377-3382.
Downward support levels are 3345-3335.


CHFJPY-- SHORT--03_08_25--after long term bullish trend monthly view of pullback to down monthly support
--Tp1: 181.500
--Tp2: 178.815

3$ psychological level natural gas bounceGood long opportunity for natural gas at the 3$ level.
Argument1: Weekly candle held the 3 $ psychological level
Argument2: Gap fill on Ng1! natural gas futures
Argument3: Triple bottom on XNGUSD natural gas

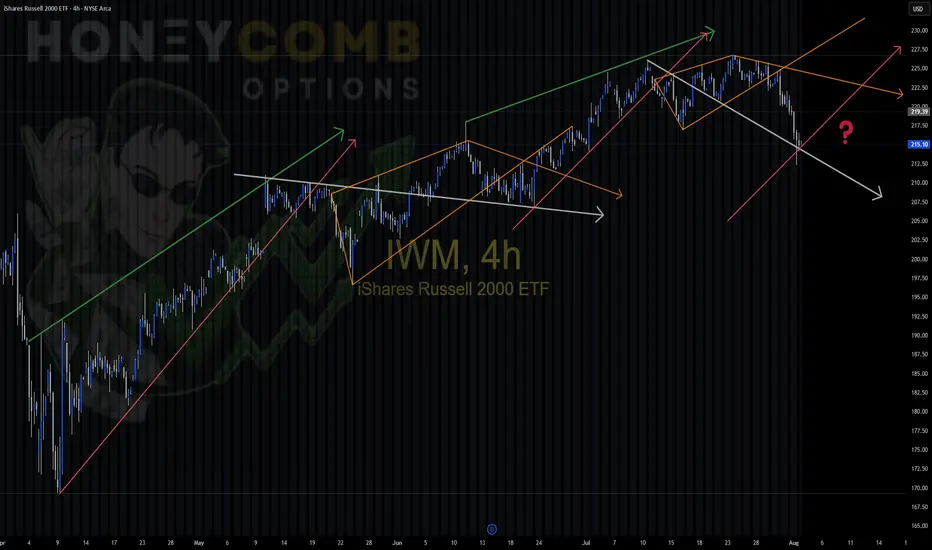
IWM repeating patterns IWM Playing around today noticed similar patterns in this uptrend, color coded for you convenience. Different sizes,, but the patterns are the same. Will we enter a new trend and start a different pattern, or will we stay in the same cycle?
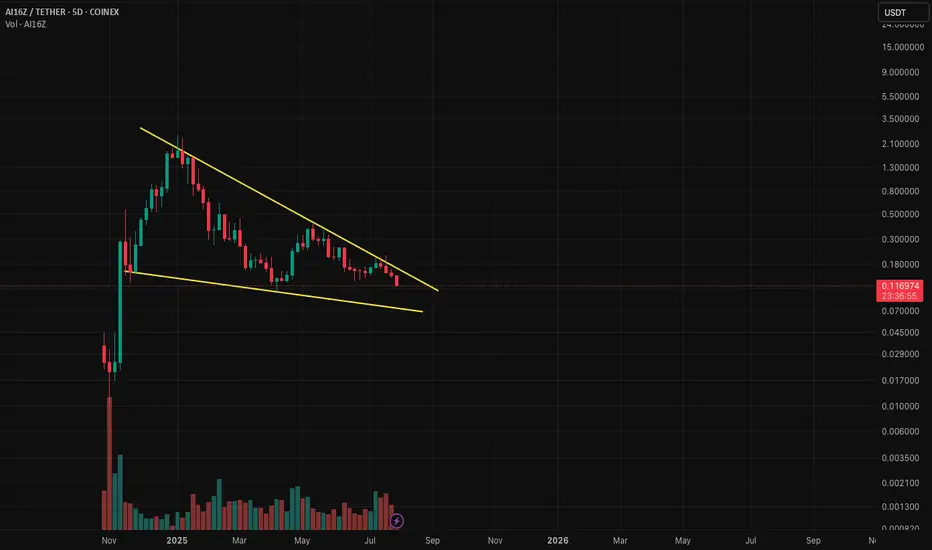
Ai16Z on a falling wedgeai16z has been in a bullish falling wedge for the past roughly 200 days. Right now as bitcoin and other cryptos are having a pull back, ai16z is forming a double bottom formation. The pattern is not complete as of yet please wait for a potential break out above the wedge resistance level to enter trade. However if anyone wish to catch the double bottom trade to maximise return you could enter at 10c but like always high risk high return the double bottom could fall further and void this idea. Happy Trading
TOTAL - Gonna Hold My Coins, Wait & See...This is my own experiment, gonna buy the most underrated top 30 coin, the most hated one. Put $5k on it right now and wait until this happens. Maybe this wont work but we will see!

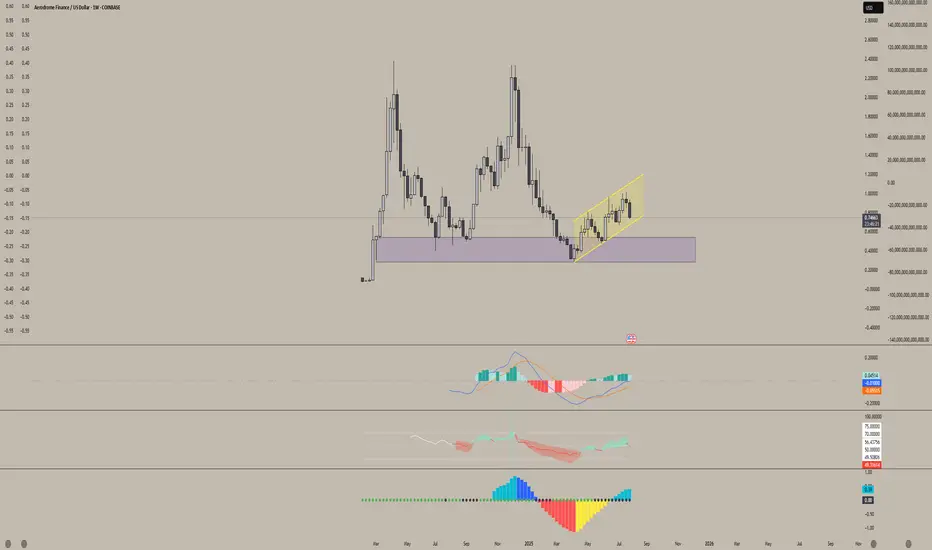
Aerodrome Finance (AERO)Aerodrome (AERO) is showing strong signs of accumulation.
We've been trading within this parallel channel for nearly three months, and it's repeatedly respected both the upper and lower bounds. As we approach the bottom of this range again, it looks like an ideal accumulation zone for long-term holders.
I'm very bullish on this project. Aerodrome is the leading DEX on Base — Coinbase’s Layer 2 network — and with no native Base token currently, AERO is in a prime position to claim that top spot. There's a vacant throne on Base, and AERO is well-positioned to sit on it.
DXY continued downside, next stop 90Perfect parallel channel + Fib 2.618 intersection
Gl
Not financial advice

NZDJPY--Short--03_08_25--after a long term bullish trend, time to pullback.
--bold dotted horizantal line is monthly support.
--waiting for downward movement to monthly support

GBPUSD SELLSGBPUSD - DAILY TF - last phases of the distribution schematic, just waiting for a pullback to the last point of supply to swing this to the downside.
