Sunday Premarket AnalysisWe will likely hit the 4H FVG not too far above where price left off on Friday.
Then head all the way down take July's low and hit the area below that
because there is a BIG FAT juicy MONTHLY, WEEKLY && DAILY FVG
sitting directly under the July monthly low. We will likely hit all three or maybe just 2
of these FVG's and then head up for super big push, bullish into at least the first week of September. Keep in mind Jackson Hole Symposium is mid month-ish also.
Chart Patterns

$CRWV: Reversal Brewing or More Pain Ahead?🧠 NASDAQ:CRWV – Technical Analysis (Daily Timeframe)
CoreWeave is currently trading at $104.14, sitting at the lower end of a well-defined descending channel after a steep selloff (-8.75% today). Volume is spiking, suggesting growing interest — whether that's accumulation or distribution is the key to watch next.
📉 Descending Channel Breakdown
Upper trendline = breakout trigger
Lower trendline = breakdown trapdoor
🟡 Midline of the channel = key decision zone (dynamic resistance/support)
Acts like a battlefield: bulls want to flip it, bears want to reject it.
CRWD has been respecting the midline as resistance — until price reclaims and holds above it, trend remains bearish.
If we break above the midline with volume, that’s early confirmation of strength before even touching the top of the channel.
🟢 Long Setup (Breakout Play)
Trigger: Break & close above channel top (~$110+)
Confirmation: Reclaim midline, convert it to support
Targets:
$120 local supply
$140 minor inefficiency
$186 gap-fill + key supply zone
🔴 Short Setup (Breakdown Play)
Trigger: Break & close below lower trendline (~$100 or under)
Confirmation: Fail to reclaim midline on bounce
Targets:
$85 psychological zone
$64.82 demand level
📊 Indicators
MACD: Bearish, but curling. A bullish cross on a midline reclaim = fuel.
RSI: Near oversold, showing early divergence = potential bounce
Volume: Big pop today — first real signal buyers/sellers are clashing hard.
🎯 Key Takeaway:
✅ Break & close above midline → early strength
✅ Break & close above channel → CONFIRMED BUY
❌ Close below lower channel → HIGH-PROBABILITY SHORT
❓ Rejections at midline → continue fading pops until proven wrong

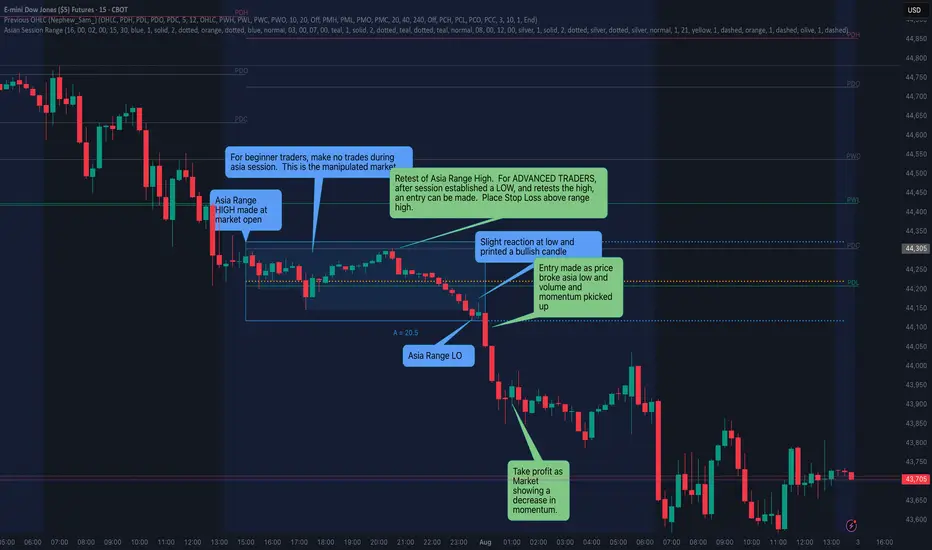
Asia Range Breakout - The trap and the entryDescription:
This chart illustrates a textbook Asia Session Range breakout, highlighting both the manipulative trap and the ideal entry based on the SquawkTradeFX strategy.
🔹 Asia Session Range (Grey Box):
This tight consolidation forms overnight during the Asia session.
Price oscillates within a narrow high/low range, creating the trap zone.
This is the “wick zone” of the eventual daily candle.
🔹 The Trap — Liquidity Sweep:
Notice how price first fakes a breakout to the upside, breaking above the Asia High.
This is a liquidity grab, targeting early breakout buyers and triggering their stop-losses.
🔹 The Confirmation & Entry:
After the upside trap, price quickly reverses, sweeping back down.
Momentum increases and volume picks up as price breaks below the Asia Low.
This break signals a true shift in directional intent and offers a high-probability entry as the daily body forms.
🟢 Entry Zone:
Entry is taken on the bearish breakout of the Asia Low after the sweep.
Ideally confirmed with strong bearish candle structure and volume from the London or NY session.
📌 Why This Matters:
This setup exemplifies the SquawkTradeFX principle:
“Let the traps spring first — then strike with confirmation.”
CADJPY--SHORT--02_08_25--after long term bullish trend, time to pullback to the monthly support.
--entry around 107.660 and 105.830 zone.
--TP:105.830

AMZN is ready to lift offPrice has successfully retest support zone around 185$.
Expecting trend continuation, targets are on chart.
NFA
DYOR

ABBV accumulating before next leg upPrice has break the resistance zone and currently accumulating above the mirror support zone.
Expecting trend continuation.
Target is on chart.
NFA
DYOR

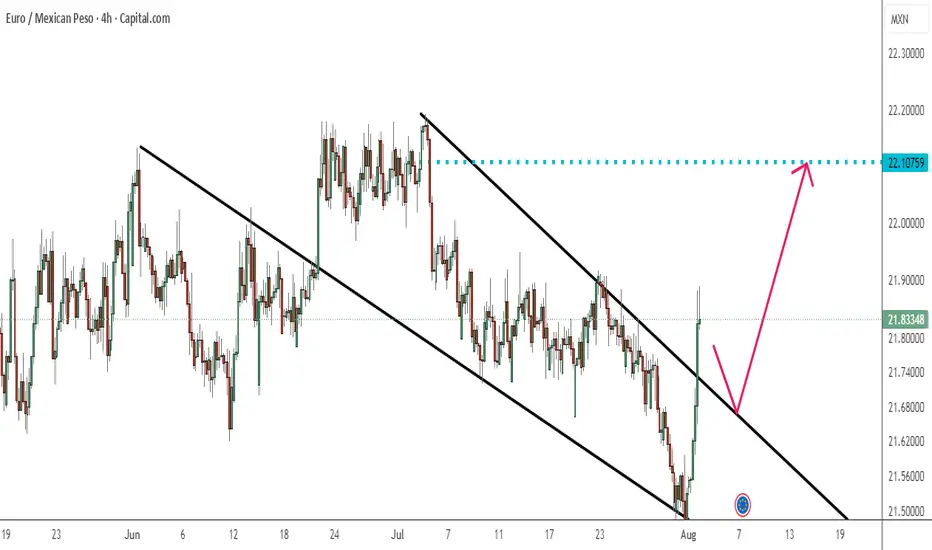
EurMxn is bullishthe pair has broken the trendline upward and is bullish now but before continuation of its move ,a pullback is probable
this analysis is based on wolfe wave pattern and price action pattern
please see what would happen
Downtrend to trendsupportHey guys, i this is my prediction for bitcoin. I believe it will drop to my trend support and become a resistance. If it goes below that it would turn into a ranged market and no longer be a trend anymore. Also, once the downtrend is over, it would hit my demand area. I do have some old analytics on this chart, i assumed it would be an uptrend a while ago, but as soon as it went beyond my buy area, i knew it might be a breakout.


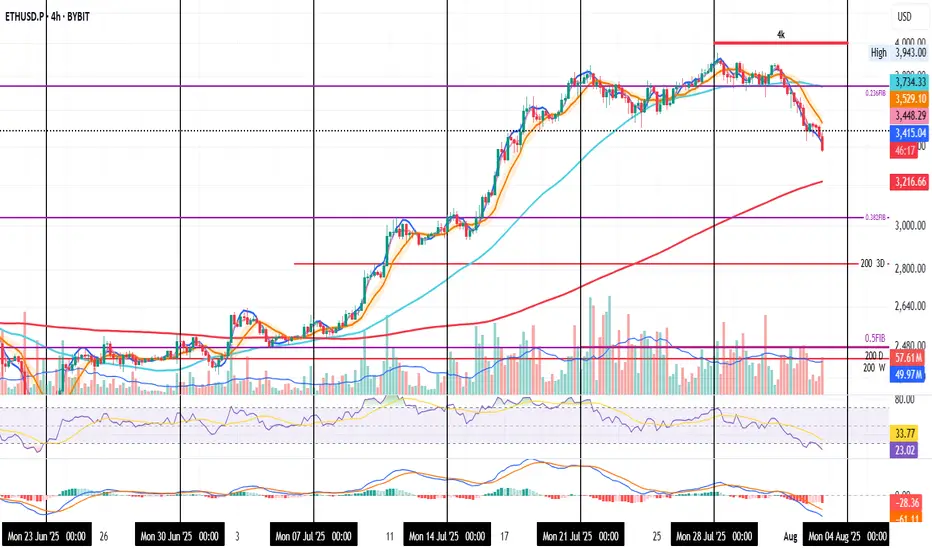
ETH 4H | Eyes on Support |ETH on the 4H
Bears are having their moment — and that’s fine.
Price is heading lower, with the 200MA around $3200 as the next support. If that breaks, the 0.382 Fib near $3000 is the last line before things get ugly.
My plan? Watch RSI for signs of bullish divergence.
Until then, hold tight.
Always take profits and manage risk.
Interaction is welcome.
nfci corellation with Eth and altcoin Alt season is not a magic internet voodoo that happens every 4 years . It happens when the financial condition easy past a certain point , which the last two instance was -60.
Eth starts running when Nfci crosses' -50 and when that crosses -60 alt season
Data Point on when eth started its bull run or mini bull run
April 2017 (eth started Bull run)
Oct 2017 we crosses -60 result alt season
April 2019 ( eth started running defi season)
Jan 2020 one month below -60, Data is inconclusive due to covid crisis
Oct 2020 we all know what happens next
We are at -57 , waiting for -60
Inconclusion are we in alt season , NO
are we close , yes very very close

The outlook for EUR/USD in the upcoming weekIn the past week, EUR was in a downtrend on the lower cycles, while showing a corrective move on the higher ones.
Following Friday’s news, we saw a strong bullish candle. Unfortunately, the market closed shortly after, so we couldn't confirm whether it was the beginning of a solid trend or just a reaction to the news.
As a result, in the coming week, we need to be more cautious and patient when looking for setups. Since the recent candles were news-driven, it's important to wait for a clear confirmation before acting.
In the chart, three possible scenarios have been outlined — be prepared for any of them.

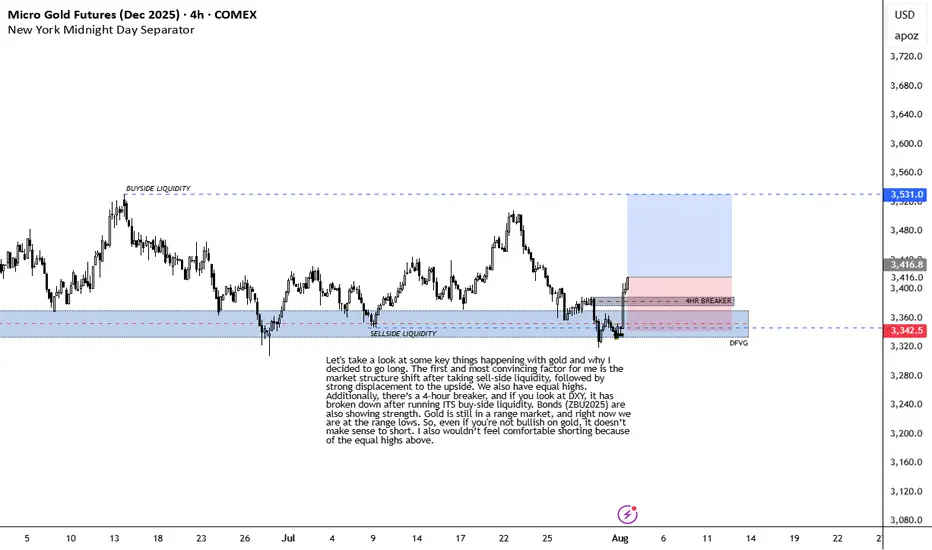
BULLISH ON GOLDLet's take a look at some key things happening with gold and why I decided to go long. The first and most convincing factor for me is the market structure shift after taking sell-side liquidity, followed by strong displacement to the upside. We also have equal highs. Additionally, there’s a 4-hour breaker, and if you look at DXY, it has broken down after running ITS buy-side liquidity. Bonds (ZBU2025) are also showing strength. Gold is still in a range market, and right now we are at the range lows. So, even if you're not bullish on gold, it doesn’t make sense to short. I also wouldn’t feel comfortable shorting because of the equal highs above.
INVALIDATION IS RECENT 4HR LOW.
XAUUSD | Weekly Fakeout → Wedge Breakout | Targeting 3508+🔔 Summary:
Reclaimed liquidity, broke wedge structure with strength, and printed continuation signs.
Expecting bullish move toward 3,508 on higher timeframe if breakout holds.
Will reassess if price closes below 3,314 (invalidates short-term momentum).
🔔 Long Version:
📝 Description:
📆 Date: 2nd August 2025
📊 Timeframe: Weekly → Multi-TF Analysis
📈 Bias: Bullish
🧠 Setup: High-volume breakout from descending wedge + weekly fakeout/liquidity sweep.
⸻
🧱 Structure
• Weekly fakeout below trendline rejected with strength
• 4H bullish engulfing candle broke through EMA stack and wedge resistance
• Price retested previous Fair Value Gap (FVG) and confirmed buyer strength
• Strong volume spike and MACD momentum shift confirmed breakout conviction
📊 Indicators
• EMAs: Price above 20/50/100/200 on H1 & 4H
• MACD: 4H flipping bullish, Weekly still holding green
• Volume: Significant bullish breakout candle, multi-timeframe confluence

BOS/chochcomment on how to catch trade after BOS?
ICT is interesting but no set rule, please share if any universal rule.

PSX: Systems Limited IdeaTrade Plan for Systems Ltd (SYS) — Monthly Chart
✅ Trade Type: Swing Trade (Position trade with multiple months’ holding horizon)
⚙️ Technical Setup Summary:
Price is in a bullish breakout structure after testing key Fibonacci levels.
Break above 0.618 Fibonacci retracement (128.55 PKR) confirms bullish momentum.
Price currently retesting the 0.786 Fib level (138.34 PKR).
Clear trendline support.
Bullish price action and increasing volume confirm accumulation.
🔸 Entry Plan
Entry Zone: Between 128.50 – 133.50 PKR
Ideal scenario: Entry on a bullish reversal from the purple support box (~128.50 area), near the 0.618 Fib level.
Alternatively: Add partially now, and scale into position if the price dips toward support.
🛑 Stop Loss (SL)
SL Level: 121.60 PKR
Below the recent support structure and 0.5 Fib retracement level.
Protects against trend reversal and false breakout.
Tight but logical based on structure.
🎯 Take Profit (TP) Targets
TP1: 150.80 PKR (1.0 Fibonacci Extension)
TP2: 170.00 PKR (1.414 - 1.618 Fib Extension Zone)
⚖️ Risk-to-Reward Ratio (RRR)
RR: ~1:3
SL = ~12 PKR
TP1 = ~17 PKR gain
TP2 = ~37 PKR gain
🔍 Trade Justification
Price action broke key resistance near 128.50 with volume.
Monthly candle structure shows strength; previous resistance now acting as support.
Long-term trendline intact.
Fibonacci cluster and historical price action align for confluence.
Positive momentum with potential continuation toward TP2.
🧠 Trade Management
Partial Profit: Take 50% at TP1, trail SL to break-even.
Trail Remainder: Use monthly candle lows or 20 EMA as dynamic trailing stop.
Re-evaluation: If price consolidates between 138–145 for several weeks, reassess risk and possible breakout re-entry.
🗓️ Time Horizon
Expected Holding Period: 2 to 6 months
Review price action on weekly closes for confirmation or exit signs.

NokJpy is bearishthe pair is broken a key area downward on 4H time frame indicating bears are in control
also a price action pattern named as double top is being seen on the south suggesting target could be in the vicinity of its formation as depicted on the chart .
let'see what would happen as we suggest to enter short on the pullback to key level

$TENyieah
Looking nice Daily view.
1. Head and shoulders knees and toes.
2. RIght at big volume shelf
3. Tested bottom part of channel, now headed to the top channel.
Aiming for a $25 this year?

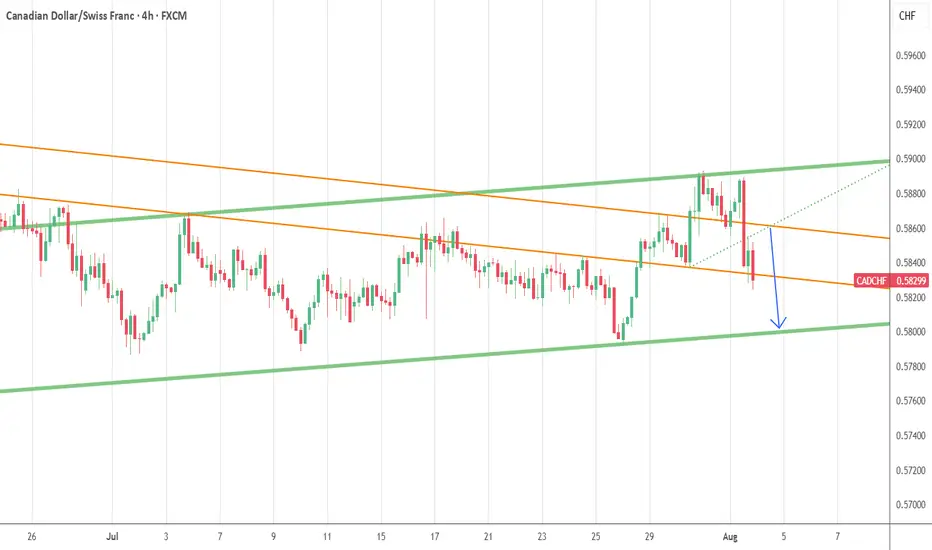
CADCHF--SHORT--02_08_25--Short term SELL opportunity
--entry: from upper side of orange channel
--TP: bottom side of green channel
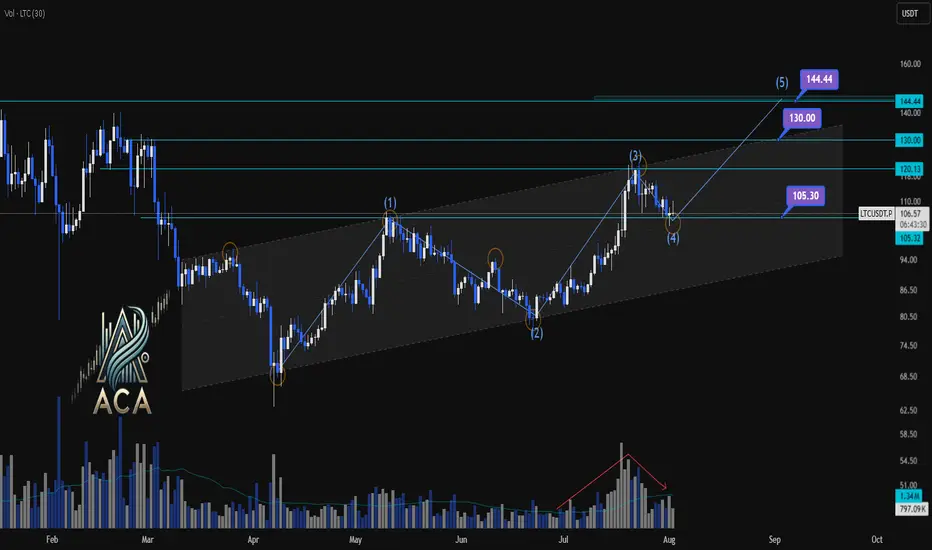
LTCUSDT | Daily Chart Analysis | Bullish Structure UnfoldingLTCUSDT | Daily Chart Analysis | Bullish Structure Unfolding
🔍 Let’s break down LTC/USDT’s technical setup, focusing on volume, Elliot Wave structure, and key target levels for this bullish scenario. If you're following this channel, be sure to react and let us know your thoughts on the roadmap!
⏳ Daily Overview
LTCUSDT is moving within a defined ascending channel, supported by increasing bullish momentum and clear Elliot Wave progression. The recent wave count points to a textbook impulse, setting up the next key move.
🔺 Long Setup:
The market has completed Waves (1) through (4), and we’re now looking at the development of Wave (5) to the upside.
- Wave (5) Target Zones:
- $130.00
- $144.44
These are the next resistance levels based on previous highs and channel dynamics.
- Key support to watch:
- $105.30 — this zone may act as a springboard for the next rally if tested.
📊 Key Highlights:
- Volume has shown a clear bullish divergence as price advances, signaling growing interest and strength heading into Wave (5).
- The bullish channel remains intact, and each dip has been met with higher lows, confirming the ongoing uptrend.
- Elliot Wave structure suggests further upside, with the $130.00 and $144.44 levels as potential targets.
🚨 Conclusion:
LTC bulls should keep an eye on price action as it approaches support at $105.30 — a bounce here could ignite the next leg higher toward our target zones. Reaction from the channel community will be crucial as Wave (5) unfolds. Show your support with a reaction below if you’re riding this wave!
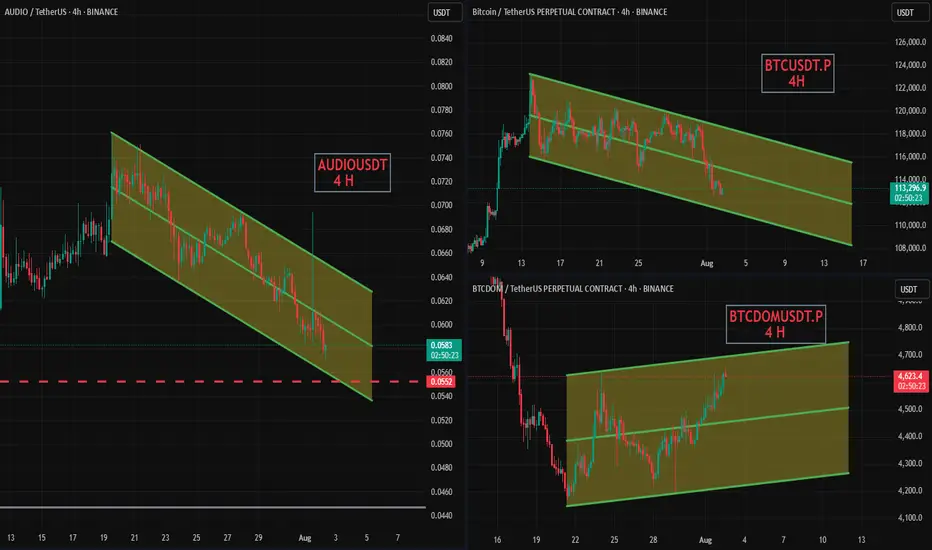
AUDIO Uptrand Soon ✏️ Use less funds 5% - 10%
💥 Wait & Get The Best Entry
🦊Pair : AUDIO/USDT 🟢
🐢 SPOT
🏎️ Buy :
♻️ 0.0555
♻️ 0.0540
🎉️Sell -
💵 0.0664
💵0.0779
CYBN still rangebound, will earnings give us a direction?Nothing changes for me on CYBN between 7.11 and 8.84. One of these levels needs to break in order for this chart to tell me anything. Price tends to sit right on top of support without getting any real bounce going

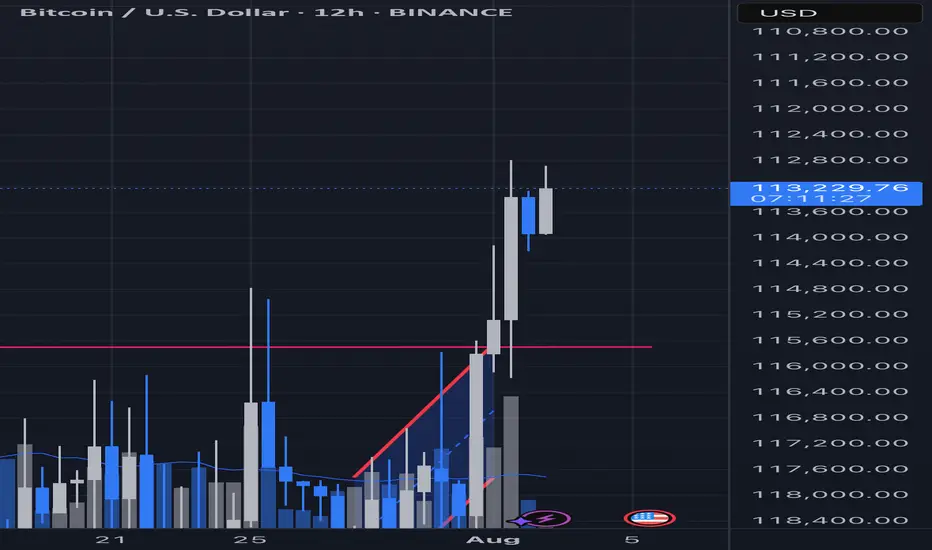
Bitcoin beginning a 12 hour reversal formation?(Inverse chart)I believe we are working on a top (bottom) of this 12 hour chart. If I am right this will result in a swing fail and begin a string reversal