Apple Short Trade ideaAfter the positive earning brought enough buyside liquidity to be taken i have executed this short trade idea on Friday with almost 3 RR #Apple #short #smc #smartmoney #liquidity #trader #ict #liquiditygrab
Chart Patterns

Apple Stock looking bearishThe positive earnings brought enough buyside liquidity to be taken by the short sellers and im having this almost 3 RR trade idea that I executed on Friday

btcwow...!!!!!!!
btc have negative divergence in weekly time and it can be start down trend or correction trend
this analyse is not 100% true but it can probebly

MNMD bearish reaction to bad earnings - here's what's nextMNMD had a big gap down open on bad reaction to earnings and a pretty solid bounce before some end of day profit taking. What are we looking at going forward?
MNMD
S: 7.96
R: 8.83, 9.00

Potential Buy Opportunity on USDCADReasons I think this pair will rise
-Price gave us a triple bottom formation which tells us bears could not continue pushing the market down. Suggesting price will rise.
- RSI was oversold on the 4H
What do you think ?

Buy Side favaourable @ XAUUSDGold has strong potential for trading on buy side if we see any correction of few 50 $ downwards.
Buy at every Dip is suggested.

Bitcoin is experiencing a major collapse!Bitcoin will fall further from August 8th and crypto will officially end.

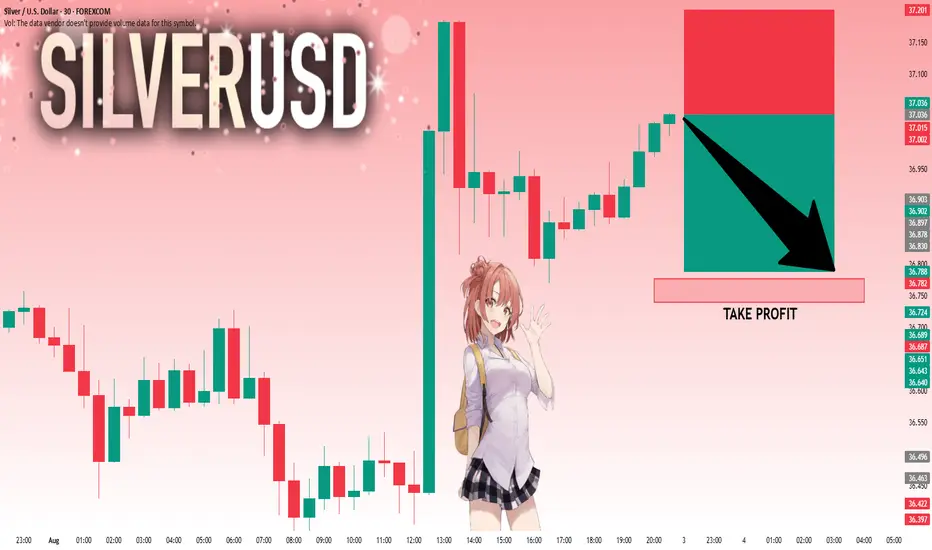
SILVER: The Market Is Looking Down! Short!
My dear friends,
Today we will analyse SILVER together☺️
The market is at an inflection zone and price has now reached an area around 37.036 where previous reversals or breakouts have occurred.And a price reaction that we are seeing on multiple timeframes here could signal the next move down so we can enter on confirmation, and target the next key level of 36.788..Stop-loss is recommended beyond the inflection zone.
❤️Sending you lots of Love and Hugs❤️
ATAI weekly higher low set into continuationAnother big week for ATAI, Weekly higher low is set at 3.06 and 2.85 monthly breakout resistance was backtested as support in after hours. Friday saw the highest close in years. and we're watching an hourly equilibrium shape up for Monday morning, the break of which will let us know if we're going to see continuation of this push higher or if we will be looking for a healthy daily HL above 3.06.
S: 3.82, 3.66
R: 4.29, 4.52

Still Bullish BiasOn the 4HR , there is already 2 legs down to start the month, similar to what happened in May. Markets typically has had 2 legs down before moving higher. Its August and its gonna be choppy.
We may test the tip of last years candle before we move even higher, which is another probably 80-100 points. However the hourly seems to reject this idea based on a 9 TD Sequential Count as the first alert failed and Bear continues pushing the price down. When in doubt always look at a higher timeframe. Just my thought of the probable outcome. Trade safe.

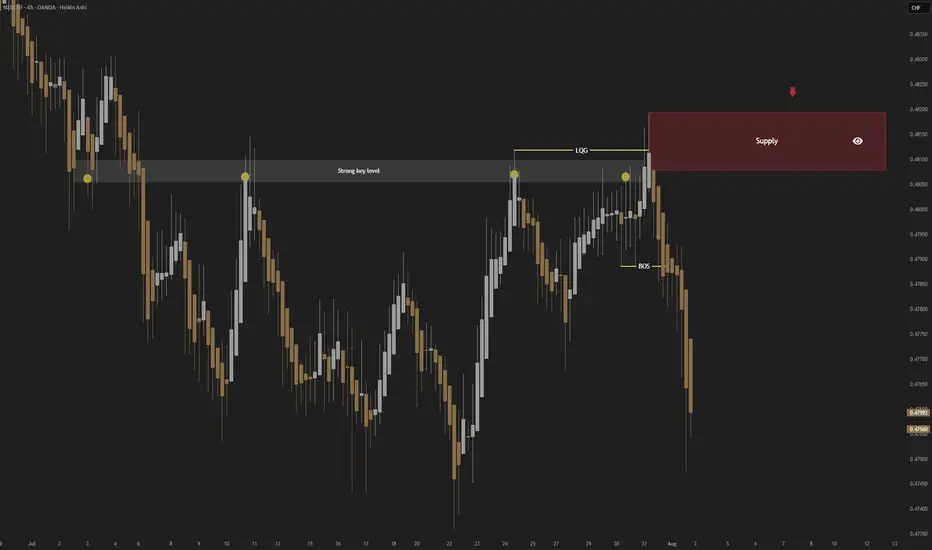
NZDCHF; Heikin Ashi Trade Idea📈 Hey Traders!
Here’s a fresh outlook from my trading desk. If you’ve been following me for a while, you already know my approach:
🧩 I trade Supply & Demand zones using Heikin Ashi chart on the 4H timeframe.
🧠 I keep it mechanical and clean — no messy charts, no guessing games.
❌ No trendlines, no fixed sessions, no patterns, no indicator overload.
❌ No overanalyzing market structure or imbalances.
❌ No scalping, and no need to be glued to the screen.
✅ I trade exclusively with limit orders, so it’s more of a set-and-forget style.
✅ This means more freedom, less screen time, and a focus on quality setups.
✅ Just a simplified, structured plan and a calm mindset.
💬 Let’s Talk:
💡 Do you trade supply & demand too ?
💡What’s your go-to timeframe ?
💡Ever tried Heikin Ashi ?
📩 Got questions about my strategy or setup? Drop them below — ask me anything, I’m here to share.
Let’s grow together and keep it simple. 👊
GOAT / USDT : Watch closely for a breakdownGOAT/USDT - Watch Closely!
Currently testing the critical support trend line.
Bullish Scenario: If it holds here and bounces, we could see a potential upward move.
Bearish Scenario: A breakdown below this support would confirm further downside, and I'd be leaning bearish in that case.
Pro Tip: Wait for confirmation before entering – either a strong rejection off support for bullish entry or a clean break for a bearish setup.
Stay alert and trade wisely!

PSIL Head and Shoulders confirmed. Here's what I'm looking forWeekly consolidation has started in the sector ETF and so far is very healthy shallow consolidation. This remains a weekly bullflag unless bears can prove it's not.
We must keep an eye on the broader market, although the sector held up remarkably well on Friday on a very red day in the indicies.

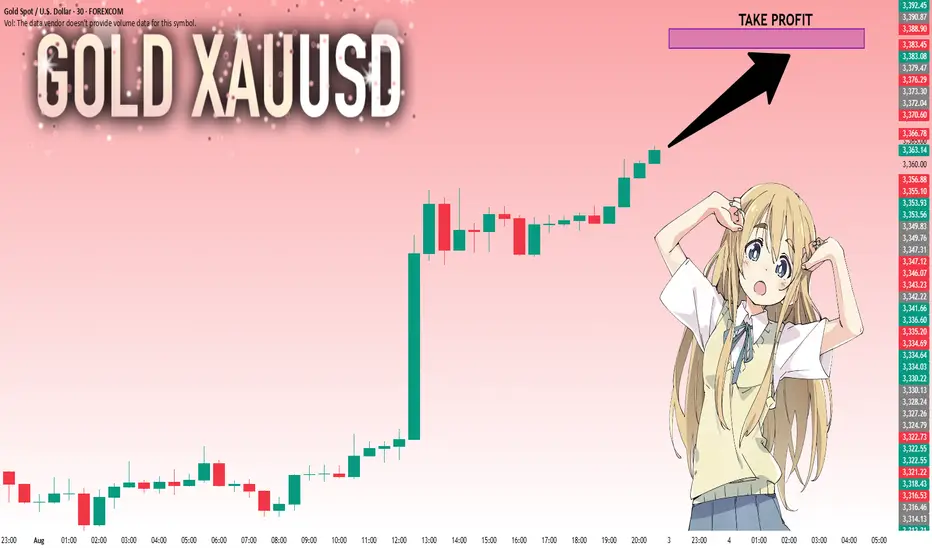
GOLD: Bulls Are Winning! Long!
My dear friends,
Today we will analyse GOLD together☺️
The recent price action suggests a shift in mid-term momentum. A break above the current local range around 3,363.50 will confirm the new direction upwards with the target being the next key level of 3,383.45 and a reconvened placement of a stop-loss beyond the range.
❤️Sending you lots of Love and Hugs❤️
Gold will continue to rise next week✅ Fundamental Analysis
Friday’s Non-Farm Payrolls (NFP) data came in significantly below expectations, with new job additions falling far short of market forecasts. This sparked a sharp rise in expectations for a Fed rate cut later this year. As a result, the U.S. dollar index declined and gold prices surged violently, rallying from the 3281 level to a high of 3362 — a single-day gain of over $85, completely erasing the week's prior losses and reestablishing a strong bullish structure.
✅ Technical Analysis
📊 Weekly Chart
Gold posted a strong bullish weekly candlestick, reversing the previous consolidation trend and signaling a structural shift in market sentiment. Bulls have regained full control. The key resistance zone lies between 3380–3400; if price breaks and holds above this level, the next upside target will be around 3430.
📊 Daily Chart
Gold stabilized at the 3281 low and surged on Friday evening following the NFP surprise, closing near the day’s high — a sign of aggressive buying. The short-term trend has clearly reversed to the upside, and any pullback is now considered a buying opportunity. The key support has moved up to around 3335, serving as a critical pivot zone. Further support is seen near 3316, a previous swing low.
📊 Hourly Chart
Price is currently trading above short-term moving averages, indicating a strong bullish bias. The key level for a potential bullish continuation is around 3355, which represents a recent support-turned-resistance area. If price pulls back to this level and holds, or breaks above it directly, it will confirm bullish strength. If gold opens with a gap higher toward 3385, beware of potential short-term volatility due to a liquidity gap. Chasing highs in such scenarios requires caution.
🔴 Resistance Levels: 3375–3380 / 3400–3430
🟢 Support Levels: 3355–3340 / 3330–3335 / 3316
✅ Trading Strategy Reference
🔺 Primary Strategy – Buy on Dips:
🔰Consider long entries around 3340–3335, with a stop-loss below 3328.
🔰If the market remains strong, a direct long near 3355 is viable, targeting 3375 and above.
🔰A deeper pullback to 3330–3335 is a favorable entry zone for mid-term longs.
🔻 Secondary Strategy – Sell on Rebounds (Short-Term Only):
🔰If gold opens Monday with a sharp spike to around 3385 but fails to break higher, a light short position may be considered, targeting a quick $10–$15 pullback.
🔰If 3385 is broken and held, abandon short setups and revert to a bullish view.
✅ Overall Outlook
Gold has completed a technical reversal following the bullish fundamental catalyst from the NFP data. The trend has shifted from bearish to bullish, and the market has clearly moved into a higher price range. The core trading logic should remain “buy on dips”, and countertrend trades should be approached with caution. Look for long opportunities near key support levels, and consider short positions only at major resistance levels and for quick intraday trades. A confirmed breakout above 3375 will likely open the door to 3400–3430 in the near term

GER40 ATH LOADINGIt as not been an easy week for the market. But we move, here on these post, i made analysis on EIGHTCAP:GER40 , Using the combination of dailytf, H4 and H2, For further clarification, pls see the video. All the best.

#MANTA/USDT – Bullish Setup Alert ?#MANTA
The price is moving within a descending channel on the 1-hour frame and is expected to break and continue upward.
We have a trend to stabilize above the 100 moving average once again.
We have a downtrend on the RSI indicator that supports the upward break.
We have a support area at the lower boundary of the channel at 0.190, acting as strong support from which the price can rebound.
We have a major support area in green that pushed the price upward at 0.186.
Entry price: 0.196
First target: 0.205
Second target: 0.214
Third target: 0.225
To manage risk, don't forget stop loss and capital management.
When you reach the first target, save some profits and then change the stop order to an entry order.
For inquiries, please comment.
Thank you.

The Power of Support, Resistance, and Moving Averages**Analyzing Ocean Protocol (OCEAN/USD): The Power of Support, Resistance, and the 21 EMA**
When trading or investing in the ever-changing world of cryptocurrencies, technical analysis tools offer vital insights into price action and market psychology. Let’s explore how these concepts play out in the recent price chart of Ocean Protocol (OCEAN/USD).
**Dynamic and Static Support/Resistance: A Quick Primer**
Support and resistance are foundational concepts in technical analysis:
- **Support** refers to price zones where a declining market tends to find a “floor,” often pausing or reversing losses.
- **Resistance** marks zones where rising prices tend to stall or reverse, acting as a “ceiling.”
On the OCEAN/USD weekly chart, I marked these static levels at price points where the market has historically reacted, reflecting the areas of repeated reversals or consolidation. Identifying these levels allows traders to anticipate potential moves and manage risk.
**The 21 Exponential Moving Average (EMA): A Dynamic Barrier**
A standout element on our chart is the 21-period EMA, plotted as a gently curving yellow line. Unlike static horizontal lines, the 21 EMA moves with price action, providing a dynamic measure of the prevailing trend. My analysis confirms that:
- In uptrends, the 21 EMA often acts as a support, helping price bounce higher during pullbacks.
- In downtrends, it acts as resistance, causing rallies to stall or reverse.
Repeated interactions between OCEAN’s price and the 21 EMA further validate its role as a crucial area to watch, where buyers and sellers contend for control.
**Descending Resistance and Support: Guiding the Trend**
I’ve also drawn descending (diagonally sloping) trendlines to highlight the broader bearish structure since mid-2024. These lines mark a channel where price has generally been contained, further defining the primary market trend and its boundaries.
**Conclusion: Clarity from Structure**
Through the combination of classic support and resistance lines and the dynamic 21 EMA—which both reliably reflect real market turning points—this analysis brings clarity to OCEAN’s current market structure. These tools not only offer traders a roadmap for likely reactions but also foster a disciplined approach to navigating crypto’s volatility.
*By combining proven tools like horizontal and diagonal support/resistance with the dynamic insight that moving averages provide, traders can approach complex charts like OCEAN/USD with greater confidence and objectivity.*
Please keep an eye for a breakout above the 21 EMA 0.33 price area for possible bullish action. Be cautious of fakeouts and liquidations.
(Some help with the AI Perplexity)

#BONK/USDT About to Break Out !#BONK
The price is moving within a descending channel on the 1-hour frame and is expected to break and continue upward.
We have a trend to stabilize above the 100 moving average once again.
We have a downtrend on the RSI indicator that supports the upward break.
We have a support area at the lower boundary of the channel at 0.00002440, acting as a strong support from which the price can rebound.
We have a major support area in green that pushed the price upward at 0.00002372.
Entry price: 0.00002552.
First target: 0.00002694.
Second target: 0.00002882.
Third target: 0.00003118.
To manage risk, don't forget stop loss and capital management.
When you reach the first target, save some profits and then change the stop order to an entry order.
For inquiries, please comment.
Thank you.

$76k incoming. Will Bitcoin de-couple from the altcoins? BTC.DCOINBASE:BTCUSD $76K incoming. Will Bitcoin de-couple from the altcoins? BTC.D

SEI - MACD Liquidity Tracker Nailed the Long, Now Flipping ShortThe MACD Liquidity Tracker Strategy just clocked a +103% long trade on SEI before momentum flipped and a short signal fired on this 8H chart.
The previous long captured a textbook impulse — clean MACD crossover, EMA alignment, and breakout confirmation. Now price is back under the 50/100 EMA, and MACD is turning decisively bearish.
📌 What’s notable:
QTP Strategy caught the entire move from ~$0.19 to ~$0.38
Fresh short entry printing as structure breaks down
MACD histogram and signal lines aligning with bearish momentum
If trend continuation plays out, this short could target the $0.24–0.22 zone. Alternatively, a reclaim of $0.30+ would invalidate.
Built-in logic helps filter out chop, so we’re watching to see if this becomes the next clean leg — or a trap before reversal.
—
Test it yourself with our preset configs or tweak for SEI’s volatility.
Ready for this reversal?👇

