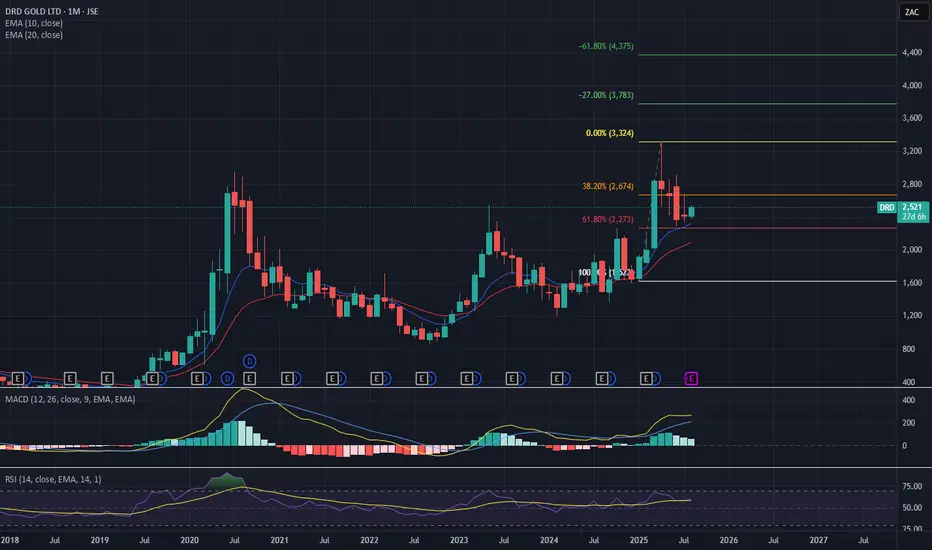
STRONG BUY | DRD Strategy: Impulse Correction
Direction: Bullish
Moving Average: Blue above Red
Fib Retracement: 38.2 reached
MACD > 0
1st Target = 3324
2nd Target = 3783
3rd Target = 4375
Lots: Can't trade on Meta, but hold 5000 of the stock.
RISK: Tariff Wars continue to hamper global growth as supply chains feel the brunt of the disruption.
Trade 2/20
Chart Patterns
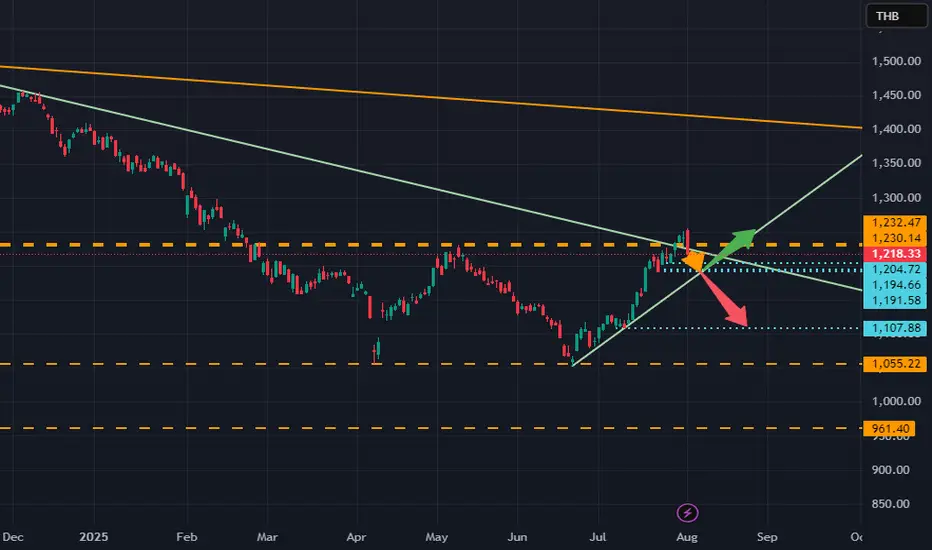
Analysis on SET INDEX: After the target hit, what comes nextDear All
Currently, SET INDEX has reached 1245- 1250 and on the first day, it can hold at this level.
However, once the tax news released, not only it fail to make new high, it fell drastically.
As a result, it can be concluded that the upward momentum is now ceased.
Also, with the big red, the set is entering the new stage.
the case is as followed,
1. most likely went down to around 1190-1200.
After which it should either
1.1 can hold at 1190-1200 and go back to retest the high 1250 once more
1.2 can not hold at 1190, it should be expected to 1110.
Best of luck
Not a trading advise.
Trader PP
Downtrend not over yet !First upside attact till $171.
Then continue about to $150.
Up for 2 days, down for 2-4 days last time before the next mid term uptrend.

The 7 Secrets Of Trading MasteryIn this video we are going to talk about:
Buy Limit Orders
Sell Limit Orders
Reversal Patterns
Double Tops
Double Bottoms
Using The Rocket Booster Strategy
The Power Of Risk Management
Watch this video on CAPITALCOM:EURAUD in order for you to learn more
take care and trade safe.
Rocket Boost This Content To Learn More
Disclaimer;Trading is risky please a simulation ion trading account
before you trade with real money
also learn risk management and profit taking strategies.

USOIL BULLS ARE STRONG HERE|LONG
USOIL SIGNAL
Trade Direction: short
Entry Level: 67.26
Target Level: 68.46
Stop Loss: 66.46
RISK PROFILE
Risk level: medium
Suggested risk: 1%
Timeframe: 1h
Disclosure: I am part of Trade Nation's Influencer program and receive a monthly fee for using their TradingView charts in my analysis.
✅LIKE AND COMMENT MY IDEAS✅

EUR/CHF SHORT FROM RESISTANCE
Hello, Friends!
EUR/CHF pair is in the uptrend because previous week’s candle is green, while the price is obviously rising on the 5H timeframe. And after the retest of the resistance line above I believe we will see a move down towards the target below at 0.926 because the pair overbought due to its proximity to the upper BB band and a bearish correction is likely.
Disclosure: I am part of Trade Nation's Influencer program and receive a monthly fee for using their TradingView charts in my analysis.
✅LIKE AND COMMENT MY IDEAS✅

EUR/NZD BEARS WILL DOMINATE THE MARKET|SHORT
Hello, Friends!
EUR/NZD pair is trading in a local uptrend which we know by looking at the previous 1W candle which is green. On the 12H timeframe the pair is going up too. The pair is overbought because the price is close to the upper band of the BB indicator. So we are looking to sell the pair with the upper BB line acting as resistance. The next target is 1.929 area.
Disclosure: I am part of Trade Nation's Influencer program and receive a monthly fee for using their TradingView charts in my analysis.
✅LIKE AND COMMENT MY IDEAS✅

Pengu inverse 12 hourOn the inverse chart I believe what we are seeing is a trend line break followed by a failed reclaim. This then lead to two swing high fails and is now starting its way into continuation (UP). On the hourly I believe it is currently on the cusp of its last “gasp” as it’s creating the peak of its rounded bounce. Still a few hours for this candle to confirm but at this moment I am anticipating acceleration towards ATH.

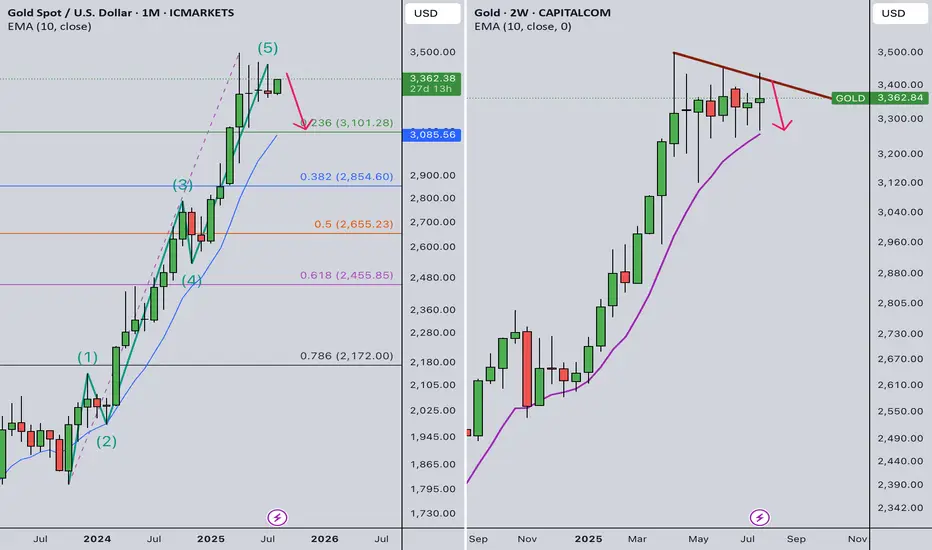
Gold Weekly Summary and Forecast 8/2/2025In monthly TF, gold has completed the full Elliot wave and it should go into a series of correction. But in 2W TF, it printed out a green bar. However, the trendline still valid. As long as the trendline is not broken, I am still bearish in gold in medium term.
Therefore, for next week, gold should first go up and should be capped at 3410. Price could quickly drop after that.
Let's see how the market plays out next week.
GBPNZDA swing move on GBPNZD. Price is likely to breakout from a bearish flag and also a Clear candle stick rejection from a Fib level

Amber Enterprises Amber Enterprises – Q1 FY26 Concall Highlights
## Robust Growth | Strategic Capex | Margin Focus
## Financials
- Revenue: ₹3,449 Cr (↑ 44% YoY)
- Operating EBITDA: ₹263 Cr (↑ 31% YoY)
*Margin impacted by product mix*
- PAT: ₹106 Cr (↑ 42% YoY)
- FY26 EBITDA Margin Guidance: 8–9%
Resistance 8000 support 7820
Weekly RSI taken support @ 60

One of these lines will be right..I expect a pump in the next 2 days otherwise we will fall and continue on the next support line. Odds are 70/30

SILVER WILL FALL|SHORT|
✅SILVER is going up now
But a strong resistance level is ahead at 37,60$
Thus I am expecting a pullback
And a move down towards the target of 36,69$
SHORT🔥
✅Like and subscribe to never miss a new idea!✅
Disclosure: I am part of Trade Nation's Influencer program and receive a monthly fee for using their TradingView charts in my analysis.

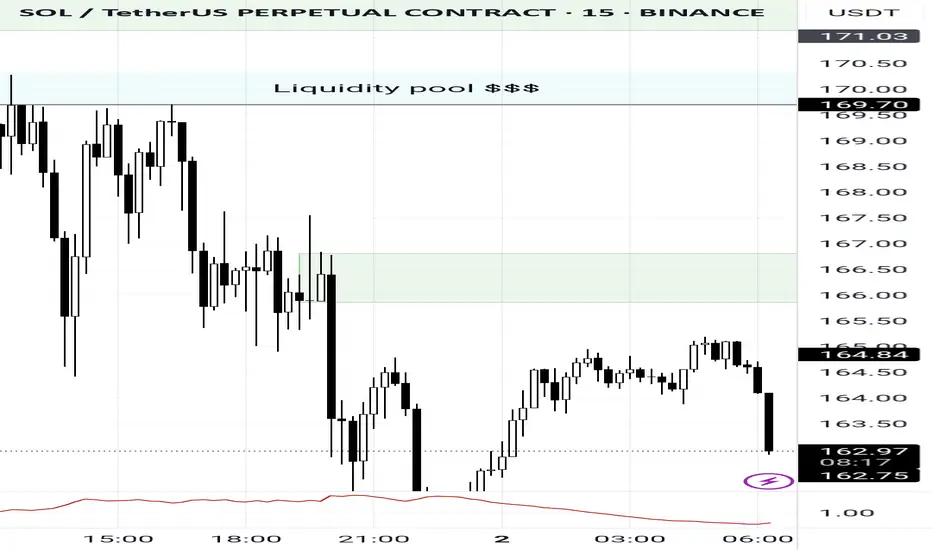
SOL BEARISH CONTINUATIONAs the market continues to create new lows, something caught my eye.
3 areas of unwicked impulsive moves (FVG's) lying around 165.18 - 166.80, 167.65 - 169.69 and 170.32 - 172
With this, I identified two order blocks
.
I'm traditionally wired to prefer the latter because there's more confluence factors;
A liquidity pool 169.70 - 170.3 established by price struggling to close above that level followed immediately by a FVG into an OB.
Price would have an instant reaction downwards if it traded to those levels.
However, the buying pressure might not be sufficient to push price to those levels before the crash.
Hence the other order block.
I'd be paying close attention to observe how it plays out.
Bid on AI system limited Pakistan top IT services companyABCD pattern
Rsi div
Trend reversal
3 bull point to buy
comment if you have any bearish point.

Sui chance for +60% on this zoneSui continue to grap liquidation but on the monthly and weekly timeframe we are still bullish.
I just saw good zone for trade. At 3.15 we have daily EMA + fibonacci 0.64 + Daily FVG.
I will suggest to add some leverage because invalidation is close to 2.9.
In this mid term bull market of altcoins we can see that SUI has good performance.
Ivan

Apollo Micro Systems - Long*Apollo Micro Systems - CMP - 124 / Positional Trade*
*Buy Range 120 - 125 ONLY / Stop Loss 85 in weekly candle closing*
*Target 1 - 150*
*Target 2 - 165*
*Target 3 - 180 / 200*
Disclaimer: This is my view and for educational purpose only.

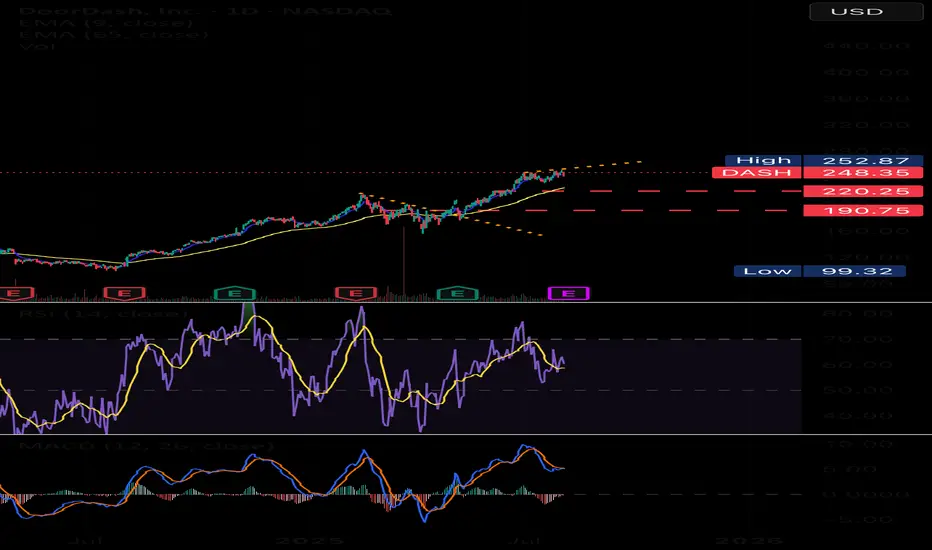
$DASH NASDAQ:DASH buyers look hesitant to buy right now after the weak job report and the Fed signaling no rate cuts anytime soon. This adds pressure on consumer pockets, limiting discretionary spending. If this trend continues, we might see DoorDash consumers slow down their activity, which could impact the company’s revenue growth.
With macro headwinds and reduced consumer demand, NASDAQ:DASH price action could remain under pressure in the short term. A break below key support levels may trigger further downside unless the market sentiment shifts with improved economic data.
NE - Looking for strong bullish continuationN wave with N, NT & V projection.
Cup & Handle pattern.
The pattern strongly resembles a "Cup and Handle" formation, supported by an N wave structure with Ichimoku alignment.
Cup and Handle Pattern
Cup Shape: Smooth U-curve from Nov 2024 to Jul 2025.
Handle: A short pullback forming higher lows between late July and early August.
Breakout Area: 0.740 is the rim resistance — breakout above this will confirm the Cup & Handle.
- Valid Cup & Handle characteristics:
Rounded bottom (accumulation phase).
Handle with light pullback and low volume.
Breakout attempt with increasing volume (watch confirmation).
Price is well above the Kumo: Clear bullish trend.
- Tenkan-sen > Kijun-sen: Short-term momentum is bullish.
V as immediate resistance at 0.715. If price stay above this level, confirming the bullish continuation.
Entry (Breakout Buy) 0.740 (above resistance/handle)
Aggressive Entry 0.660–0.675 (on handle support bounce)
Stop Loss 0.620 (below handle and Tenkan/Kijun)
TP1 (V) 0.715
TP2 (NT) 0.770
TP3 (N) 0.815
- Chikou Span is above the cloud and price: Confirming trend support.
- Kumo Future is Bullish: Strong foundation for continuation.
Note:
1. Analysis for education purposes only.
2. Trade at your own risk.

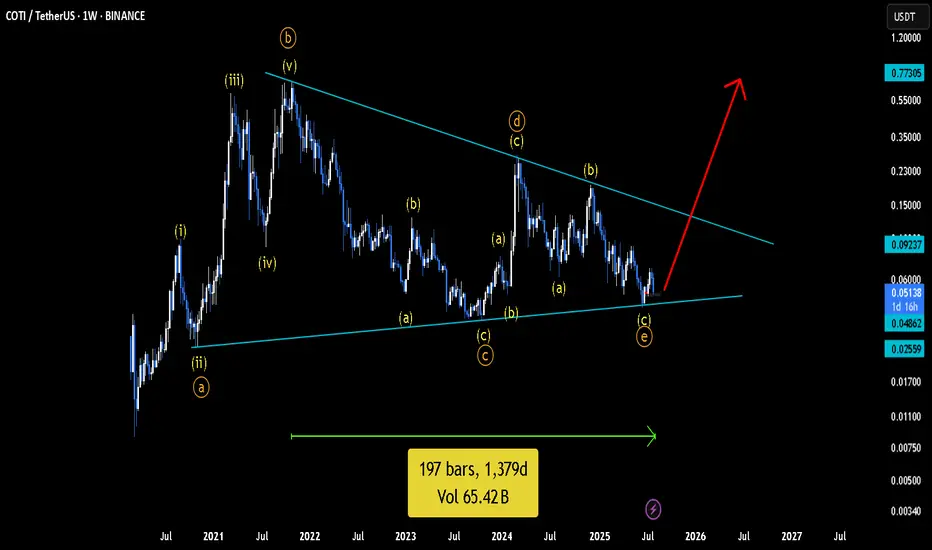
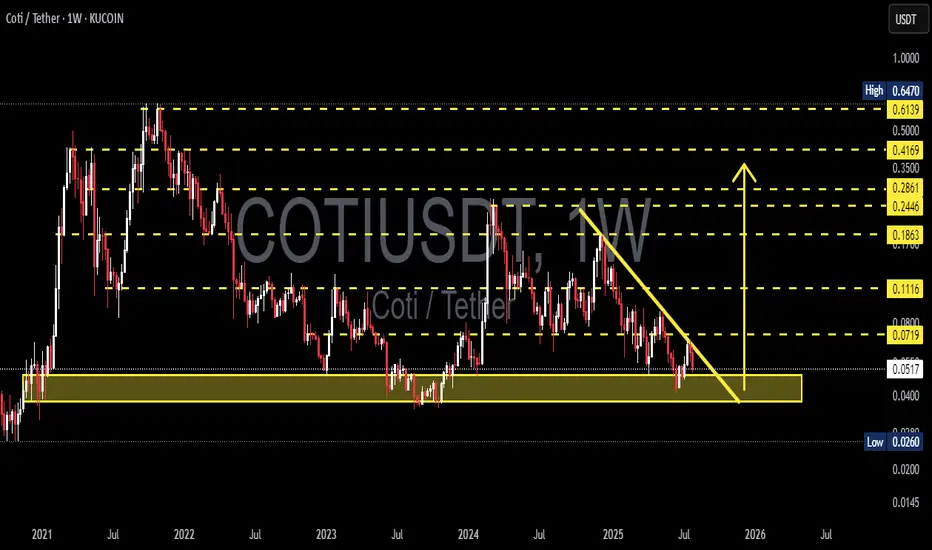
COTIUSDT Weekly Analysis Potential Reversal?📍 Current Price Position – On Top of Historical Support!
The COTI/USDT pair is currently testing a crucial support zone between $0.0400 – $0.0517, which has been a key demand zone since early 2021. This isn't just any support — it's a macro psychological area that has repeatedly triggered strong reversals in the past.
We are at a make-or-break level, where the next move could define the mid-term trend.
---
🧩 Price Structure and Pattern
📐 The chart shows a descending triangle pattern with:
Consistently lower highs (marked by the downward yellow trendline),
Flat horizontal base around the major support zone.
This pattern can result in:
A powerful breakout if the trendline is broken, or
A sharp breakdown if the horizontal support fails.
---
📈 Bullish Scenario: Reversal Momentum Building?
If price:
Breaks above the descending trendline (~$0.0719), and
Closes a weekly candle above that resistance zone,
➡️ We could see a breakout move with targets at:
Resistance Level Target
Initial Target $0.1116
Mid-Term Target $0.1863
Strong Zone $0.2446 – $0.2861
Long-Term Bullish $0.35 – $0.4169
📌 A confirmed higher high and higher low structure above $0.11 would strengthen the bullish case.
---
📉 Bearish Scenario: Breakdown from Support
If:
Price fails to hold the $0.0517 – $0.0400 support area,
and prints a weekly close below this zone,
➡️ The next bearish targets could be:
Support Level Target
First Support $0.0260
Psychological Level $0.0200
Extreme Panic Zone $0.0150 – $0.0100
⚠️ This would indicate a capitulation phase, likely to trigger panic selling and deeper lows.
---
🧠 Strategy Notes for Traders
✅ For Position Traders:
The $0.040 – $0.0517 area is a prime watch zone for reversal setups with tight stop-loss below $0.040.
Excellent Risk:Reward potential if reversal confirms.
✅ For Swing Traders:
Breakout above the trendline offers a solid entry signal.
Targets up to $0.1863 look achievable with strong volume.
✅ For Conservative Traders:
Wait for breakout + retest confirmation before entering.
Avoid FOMO — let the weekly candle close guide your decision.
---
⚡️ Final Takeaway
> COTI/USDT is at a tipping point!
This long-standing support is the last line of defense for the bulls. A breakout can trigger a macro trend reversal, while a breakdown will extend the downtrend and invite heavier selling pressure.
Watch for the weekly close, trendline reaction, and volume behavior — the next major move is likely just around the corner.
#COTI #COTIUSDT #CryptoAnalysis #AltcoinWatch #DescendingTriangle #BreakoutTrading #SupportAndResistance #PriceAction #ChartPattern #WeeklyAnalysis
Bullish potential detected for TLCEntry conditions:
(i) higher share price for ASX:TLC along with swing up of the DMI indicators and swing up of the RSI indicator, and
(ii) observation of market reaction at the support/resistance level at $5.31 (from the open of 12th May).
Stop loss for the trade would be, dependent of risk tolerance (once the trade is activated):
(i) below the support level from the open of 21st November (i.e.: below $5.05), or
(ii) below the recent swing low of 3rd June (i.e.: below $4.96).

Potential outside week and bullish potential for CXOEntry conditions:
(i) higher share price for ASX:CXO above the level of the potential outside week noted on 27th June (i.e.: above the level of $0.1025).
Stop loss for the trade would be:
(i) below the low of the outside week on 20th June (i.e.: below $0.083), should the trade activate.
