Quick Video Updating Previous PENGU Charts SharedI wanted to record a brief video of my thoughts for PENGU and where we may be headed. This is an overall compilation from the previous charts shared and how/why I feel this was a good entry for a run towards ATH on this chart. It looks to me that we have a strong support level that has formed along with a quick wick testing a previous weekly level. Right now we seem to be in a small range and in need of some momentum to begin a strong move as this coin has been recently known to do. With it being a Sunday I am not sure we get it today, but would love to see it! Alerts set for confirmations for both right and wrong scenarios on this trade idea as always. Enjoy your weekend!
Chart Patterns

KAIA Bullish DivergenceBINANCE:KAIAUSDT
Trade Setup:
Target 1: 0.1472 (0.786 Fibonnaci Golden Zone).
Target 2: 0.1544 (0.618 Fibonnaci Golden Zone).
Target 3: 0.1594 (0.5 Fibonnaci Golden Zone).
Target 4: 0.1808 (0 Fibonnaci).
Stop Loss: 0.1265 (1.272 Fibonnaci).
RSI Analysis: The RSI is showing a bullish divergence, suggesting potential bullish momentum. The current RSI is around 21.23, approaching oversold territory, so caution is advised.

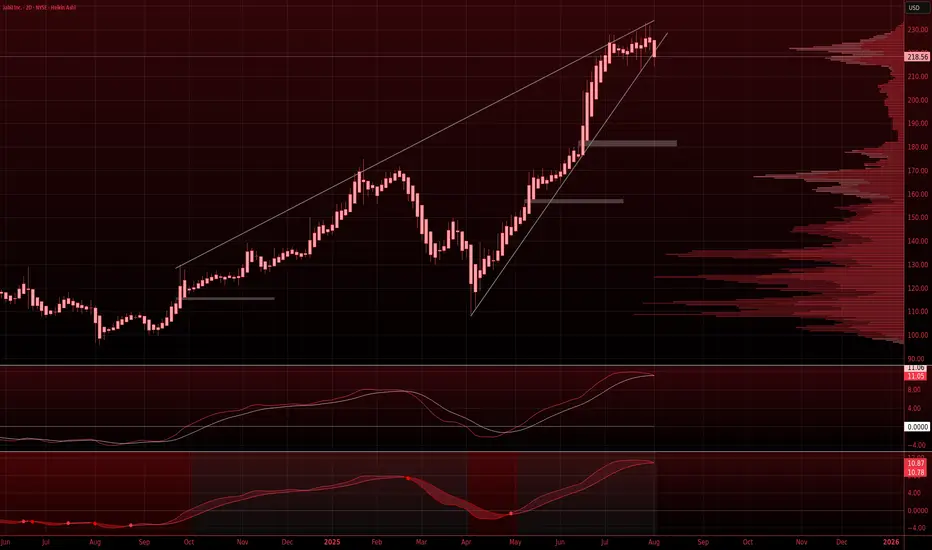
Jabill oscillators close to flipping bearish on the 2-day chartBearish on the short term (30 days) on Jabill Inc, $JBL.
Gaps at $180 and $157 on the 2-day chart.
See chart.
SHOPIFY ready to perform Price has break upwards and retest raising channel.
Strong signal for the further growth.
Target is on chart
DYOR
NFA

XAUUSD Update 03 Augt 2025 BOUNCINGAs we knew on last weekend, price has bounced from 3267 level. It wont touch 3245-50 as a support.
From this reaction, we will follow on this week, is the price will break 3378 resistance ?
Is the price will retest 3400 level again and again ?
And if it so, it seemlikes a bullish momentum.
Just becarefull, waiting for the price make a correction first.
Have a blessing week ahead !

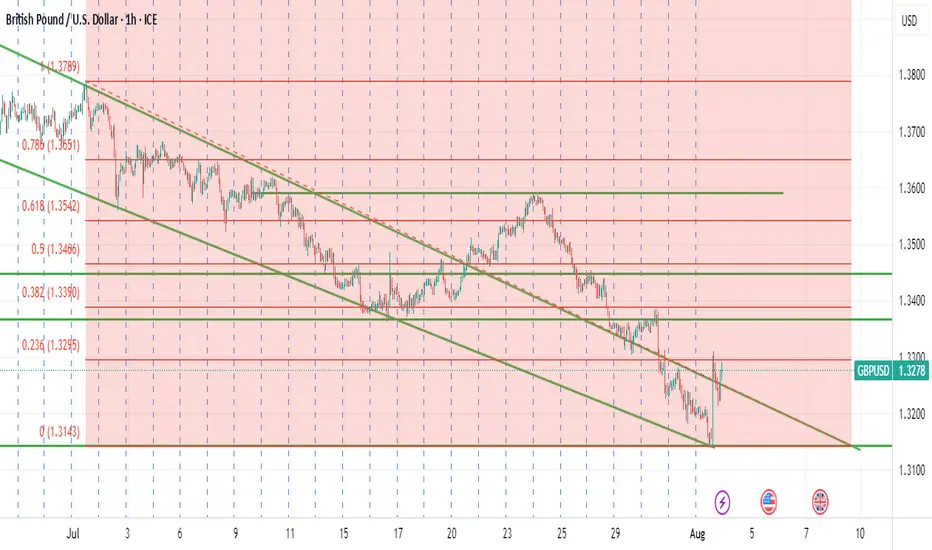
GBPUSD – WEEKLY FORECAST Q3 | W32 | Y25📊 GBPUSD – WEEKLY FORECAST
Q3 | W32 | Y25
Weekly Forecast 🔍📅
Here’s a short diagnosis of the current chart setup 🧠📈
Higher time frame order blocks have been identified — these are our patient points of interest 🎯🧭.
It’s crucial to wait for a confirmed break of structure 🧱✅ before forming a directional bias.
This keeps us disciplined and aligned with what price action is truly telling us.
📈 Risk Management Protocols
🔑 Core principles:
Max 1% risk per trade
Only execute at pre-identified levels
Use alerts, not emotion
Stick to your RR plan — minimum 1:2
🧠 You’re not paid for how many trades you take, you’re paid for how well you manage risk.
🧠 Weekly FRGNT Insight
"Trade what the market gives, not what your ego wants."
Stay mechanical. Stay focused. Let the probabilities work.
FRGNT
FX:GBPUSD

INIT/USDT - Double bottom INIT has successfully double-bottomed around the $0.35 zone, confirming it as a strong demand area. The first leg off this support showed a powerful push from buyers, signaling renewed interest and a potential trend shift. Now, price action is heating up again as buyers step in aggressively with rising volume, reinforcing the bullish momentum.

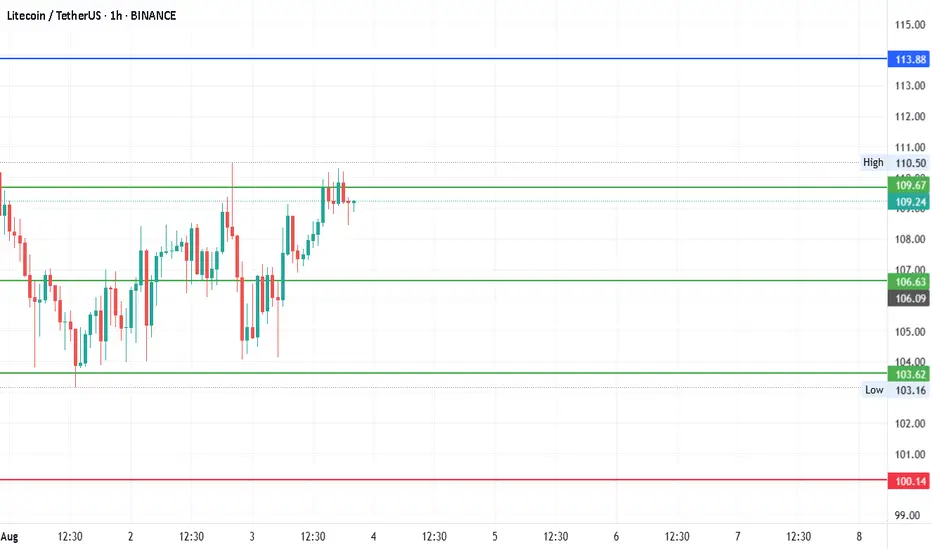
#LTCUSDTDate: 03-08-2025
#LTCUSDT - Current Price: 109
#LTCUSDT Pivot Point: 107 Support: 104 Resistance: 110
#LTCUSDT Upside Targets:
Target 1: 113
Target 2: 117
Target 3: 120
Target 4: 124
#LTCUSDT Downside Targets:
Target 1: 100
Target 2: 97
Target 3: 93
Target 4: 89
#Crypto #Bitcoin #BTC #CryptoTA #TradingView #PivotPoints #SupportResistance
#TradingView #Nifty #BankNifty #DJI #NDQ #SENSEX #DAX #USOIL #GOLD #SILVER
#BHEL #HUDCO #LT #LTF #ABB #DIXON #SIEMENS #BALKRISIND #MRF #DIVISLAB
#MARUTI #HAL #SHREECEM #JSWSTEEL #MPHASIS #NATIONALUM #BALRAMCHIN #TRIVENI
#USDINR #EURUSD #USDJPY #NIFTY_MID_SELECT
#SOLANA #ETHEREUM #BTCUSD #MATICUSDT #XRPUSDT #LTCUSDT
BTCUSD--Short-03-08-25--After last week, expecting price will move down further to monthly support-1 and monthly support-2

Potential 4H Head and shouldersA potential h&s could be shaping, the daily trend is down but the weekly chart is looking for support.

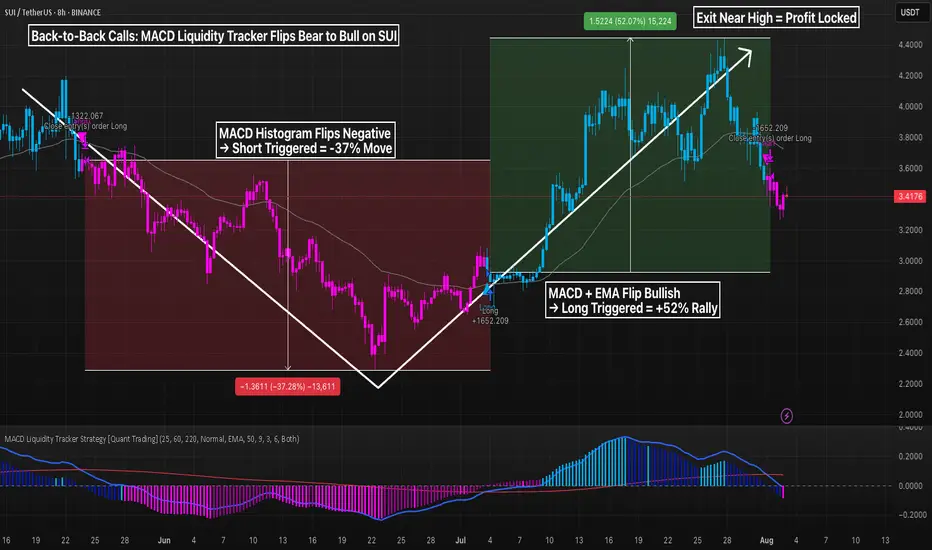
Back-to-Back Calls MACD Liquidity Strat-> Bear to Bull on SUIWhen the market flips, most traders get stuck holding bags.
Not here.
The MACD Liquidity Tracker Strategy flipped short near the top and long near the bottom — catching a clean -37.28% drop followed by a +52.07% rally on SUI 8H.
Here’s how it works:
– EMA filter confirms direction
– MACD histogram + crossover signals timing
– Strategy waits for true momentum before flipping
You don’t need to predict the bottom. You need a tool that reacts fast enough to capture moves, but slow enough to ignore noise.
⚙️ Settings Used:
– MACD: 25 / 60 / 220
– EMA Filter: 50 / 9 / 3
– Entry Mode: Both (Histogram + Crossover)
This is what smart automation looks like: fewer trades, more clarity, and real trend capture.
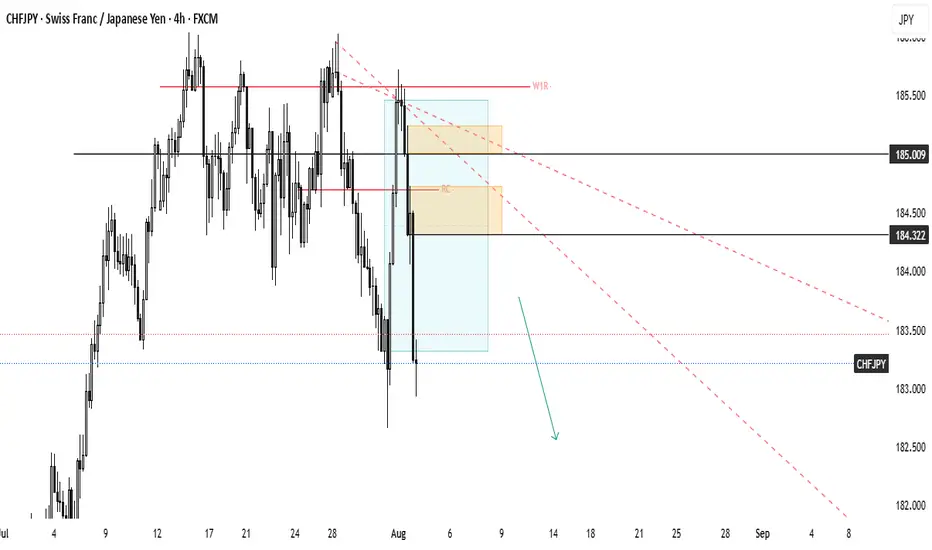
CHFJPY give very Confluence Setup! Is it Good ?Based on my observations, it is quite simple setup. It should going okay. it is the reason;
the main reason are correlation between uchf and chfjpy are inversely proportional. And it is correlate.
base on trendline, its look like price in making 3 drive pattern, such a good price action. I also mark 2 significance zone that possible to create an edge.
please follow for more

ETH 4H – MACD Histogram Caught The 54% Increase, Did You?The MACD Liquidity Tracker Strategy doesn’t just catch trends — it shows you how strong they are. On this ETH 4H chart, a textbook move unfolds:
🔹 Histogram flipped positive → Long entry triggered
🔹 Rising bars = building momentum
🔹 Tallest bar = momentum peak (July 21)
🔹 Shrinking bars signaled a weakening trend before price ever reversed
🔹 Histogram turned negative → clean exit at the top
The MACD histogram is a direct visual of momentum:
– Bars rising = acceleration
– Bars shrinking = exhaustion
– Crossing below 0 = confirmation of reversal
⚙️ Strategy Settings:
– MACD: 25 / 60 / 220
– EMA Filter: 50 / 9 / 3
– Entry Mode: Histogram + Crossover Combo


SPY: Growth & Bullish Forecast
The price of SPY will most likely increase soon enough, due to the demand beginning to exceed supply which we can see by looking at the chart of the pair.
Disclosure: I am part of Trade Nation's Influencer program and receive a monthly fee for using their TradingView charts in my analysis.
❤️ Please, support our work with like & comment! ❤️

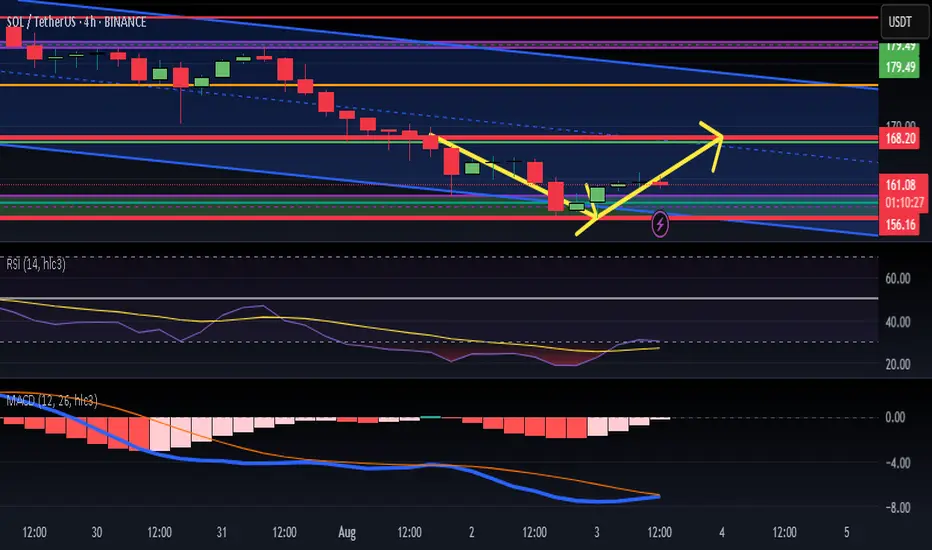
two important level keywe stuck in two level important main support in 61.8 fib 157 and daily resistance in 167 i think market will try resistance three time and will try two time resistance in 167 and bullish trend is start
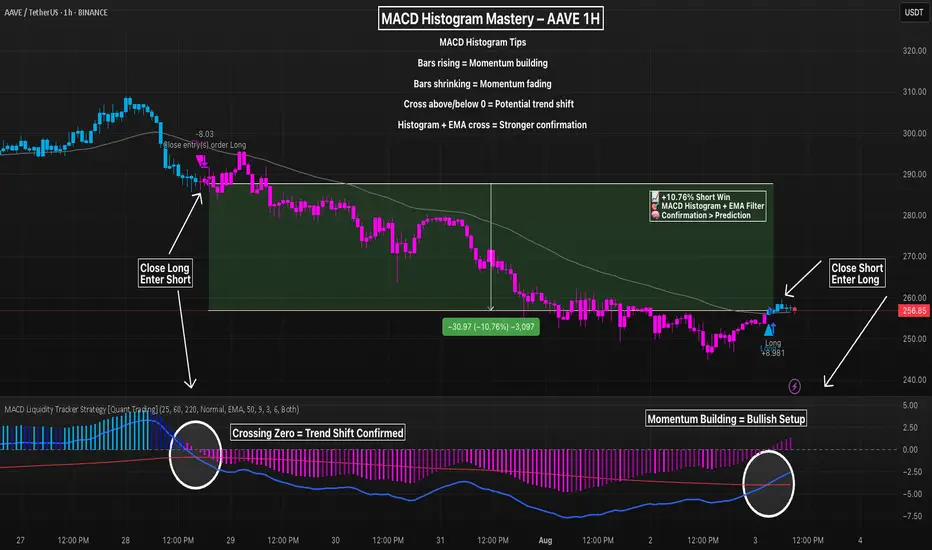
Master MACD Histogram + EMA Filter To Filter Out NoiseThe MACD histogram isn’t just noise — it’s a leading signal for momentum shifts when interpreted correctly. On this AAVE 1H chart, a textbook transition plays out:
– Rising histogram fades → crosses below 0
– EMA filter confirms trend shift
– Strategy flips short at the peak, locks in a +10.76% move
The recent long trigger occurs only after the histogram begins rising, crosses above zero, and price breaks back above the 50/9/3 EMA filter.
💡 Histogram Tips:
– Rising bars = bullish momentum building
– Shrinking bars = momentum weakening
– Crossing the zero line = potential trend reversal
– Best results come when histogram + EMAs align
⚙️ Settings Used:
MACD: 25 / 60 / 220
EMA Filter: 50 / 9 / 3
Entry Mode: Both (Histogram + Crossover Confluence)
📈 Use histogram transitions as an early signal — but always confirm with trend filters to avoid fakeouts.
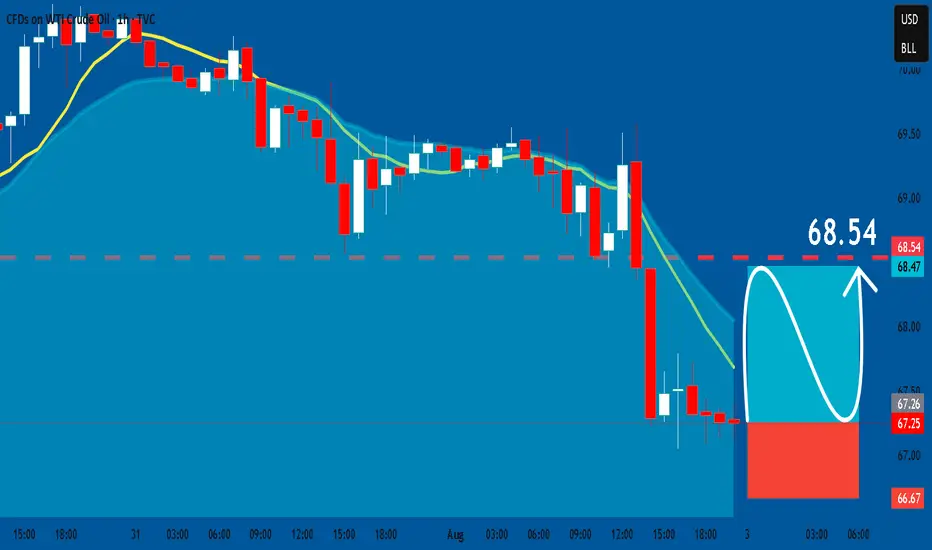
USOIL: Long Trade with Entry/SL/TP
USOIL
- Classic bullish pattern
- Our team expects retracement
SUGGESTED TRADE:
Swing Trade
Buy USOIL
Entry - 67.25
Stop - 66.67
Take - 68.53
Our Risk - 1%
Start protection of your profits from lower levels
Disclosure: I am part of Trade Nation's Influencer program and receive a monthly fee for using their TradingView charts in my analysis.
❤️ Please, support our work with like & comment! ❤️
#BitcoinDate: 03-08-2025
#Bitcoin Current Price:113646
Pivot Point: 112812 Support: 111359 Resistance: 114274
Upside Targets:
🎯Target 1: 115329
🎯Target 2: 116384
🎯Target 3: 117724
🎯Target 4: 119063
Downside Targets:
🎯Target 1: 110300
🎯Target 2: 109240
🎯Target 3: 107901
🎯Target 4: 106561
#TradingView #Nifty #BankNifty #DJI #NDQ #SENSEX #DAX #USOIL #GOLD #SILVER
#BHEL #HUDCO #LT #LTF #ABB #DIXON #SIEMENS #BALKRISIND #MRF #DIVISLAB
#MARUTI #HAL #SHREECEM #JSWSTEEL #MPHASIS #NATIONALUM #BALRAMCHIN #TRIVENI
#USDINR #EURUSD #USDJPY #NIFTY_MID_SELECT
#SOLANA #ETHEREUM #BTCUSD #MATICUSDT #XRPUSDT
#Crypto #Bitcoin #BTC #CryptoTA #TradingView #PivotPoints #SupportResistance

GBPUSD MONDAY ENTRY Looking for price to break through the fib area for a long position. Fundamentals are showing that price will continue to be bullish because of the NFP release last Friday as well as the trade deals.

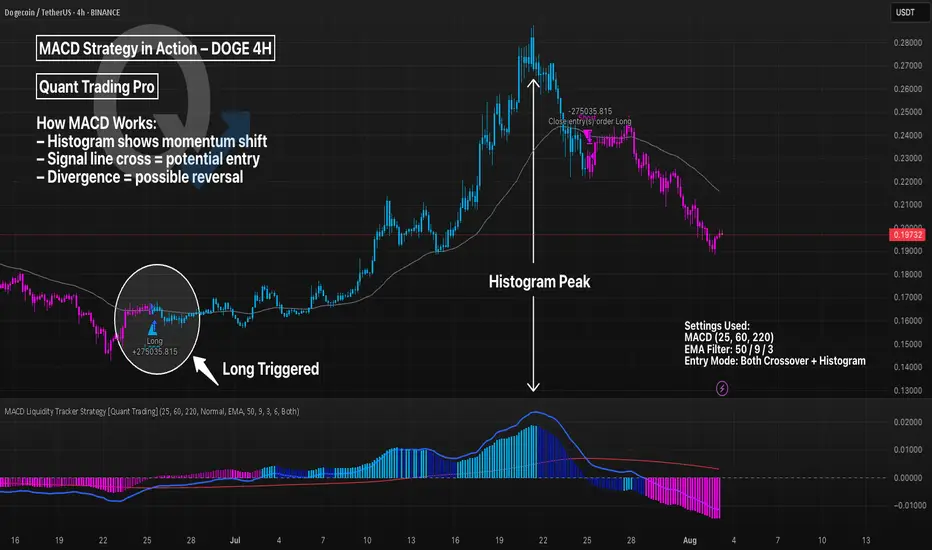
MACD Liquidity Strategy in Action – DOGE 4HThe MACD (Moving Average Convergence Divergence) is a trend-following momentum indicator. It uses two EMAs to generate signals via crossovers and histogram shifts.
This chart shows DOGE 4H with a long-only MACD Liquidity Tracker Strategy, using:
Fast EMA: 25
Slow EMA: 60
Signal Line: 220
These longer settings reduce noise and provide higher-conviction swing entries, though at the cost of late signals.
💡 Tweak Tip:
Lower values (e.g. 12/26/9) = more signals, better for scalping
Higher values (e.g. 25/60/220) = fewer signals, better trend filtering
Adjust the EMA filter (50/9/3 here) to match asset volatility
📊 Use MACD for:
Trend continuation confirmation
Exit timing via histogram fading
Divergence spotting (momentum vs price)