Gold---sell near 3355, target 3330-3320Gold market analysis:
The gold buying and selling game in the past two days is quite fierce. The daily line is washed back and forth, with a combination of one Yin and one Yang. The upper and lower shadows of the daily line are relatively long. Yesterday, the daily line closed with a standard hammer candle pattern. After breaking the strong support of 3320, the price did not continue to fall, but bottomed out at 3308 and began to rise strongly, which eventually led to the short-term selling dream being shattered again. The daily line and K showed alternating conversions. The short-term trend is vague, but the long-term trend is still buying. This wave of repairs has the participation of fundamentals and the repair of gold itself. In the big cycle, it is difficult to form a daily selling trend without breaking the position of 3281. In addition, the fundamentals all support gold. I think the possibility of a deep fall in gold in the near future is very small. We are just a follower. In the short term, we focus on the intraday trend to operate. Yesterday, the daily line had a tail, and the possibility of continuing to fall today is small. Let's look at the repair rebound in the Asian session first. The first suppression position for buying rebound is around 3357. This position is also a form suppression and an indicator suppression. The other suppressions are around 3366 and 3377. Note that gold is not unilateral. When encountering great pressure, we must also consider selling opportunities. Today, I think it will rebound first and then fall back.
Support 3327 and 3320, strong support 3308, pressure 3344.3357.3366.3377, and the strength and weakness dividing line of the market is 3340.
Fundamental analysis:
There are not many fundamentals this week. The data released yesterday still suppressed gold as a whole, but the gold tail market still bottomed out and rebounded.
Operation suggestions:
Gold---sell near 3355, target 3330-3320
Chart Patterns

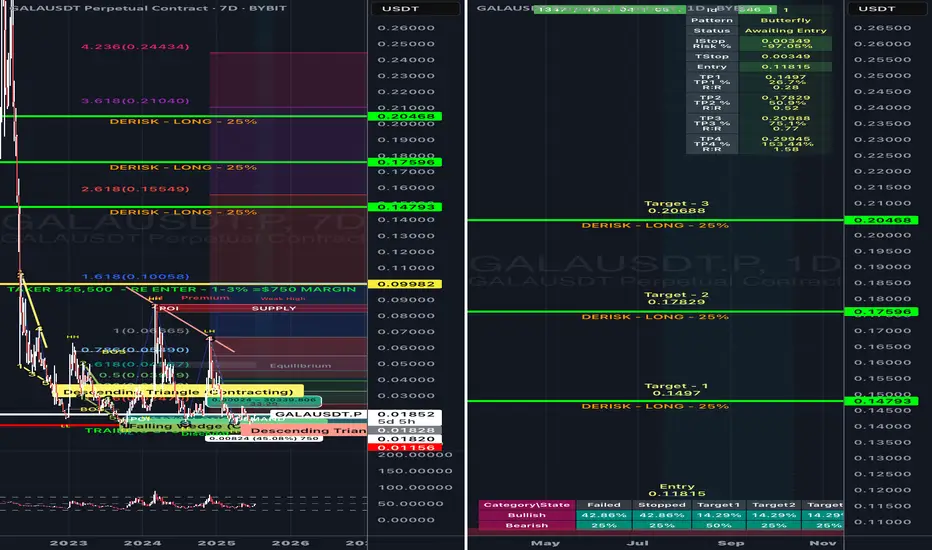
2-3 YEARS BEAR MARKET FOR GALA NOW SHOWING SIGNS Gala USD showing signs of a contracting triangle on a seven day along with a Fibonacci extension targets going as low as .08 - .20+
Is there growth ahead?!Hello friends...
Filecoin is one of the high-potential cryptocurrencies in the market, it is currently in an attractive area.
It is suitable for a step purchase.
The growth of altcoins is happening one after another, I don't know if you have noticed it yet?
You have to be patient because it may start growing at some point and leave you behind in the market.
Follow our market page to see more analysis

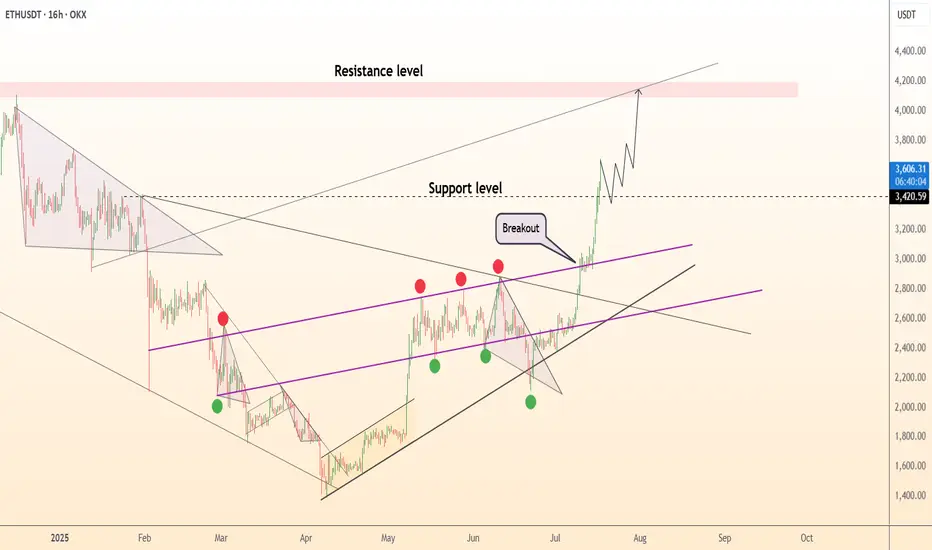
DeGRAM | ETHUSD retest of the support level📊 Technical Analysis
● ETH exploded out of the purple median channel, invalidating March-July lower-highs; retest of 3 210 held as a fresh higher-low, confirming trend acceleration.
● Price is now travelling the channel’s outer parallel; flag pole projected from the 2 430→3 210 thrust aligns with the 4 150-4 250 supply zone shown in pink.
💡 Fundamental Analysis
● CME ether futures OI hit a 14-month high on 17 Jul while exchange balances dropped to a five-year low, signalling strong institutional demand and tight float ahead of expected spot-ETF approvals.
✨ Summary
Long 3 210-3 300; hold above 3 210 targets 3 600 → 4 200. Bull view void on a 16 h close below 3 020.
-------------------
Share your opinion in the comments and support the idea with like. Thanks for your support!
sushiusdtsushiusdt loks like it has completed accumulation and now looking to taking out SOS . wait for next higher low for entry

BBAI - Cup with Handle Long Cup Formation: BBAI carved out a rounded base over several months, bottoming near $4.00 and gradually climbing back toward resistance around $8.00.
Handle Formation: After testing the $8.00 zone, the stock pulled back slightly into a tight range between $6.80 and $7.50, forming the “handle”—a sign of healthy consolidation before a breakout.
Breakout Level: The breakout occurred at $8.22, confirmed by a surge in volume and RSI strength, suggesting institutional accumulation.
Price Target: Based on the depth of the cup, the projected upside ranges from $10.50 to $12.00, with extended potential toward $15+ if momentum continues.

AUDUSD could fall again despite bullish momentumAUDUSD could fall again despite bullish momentum
AUDUSD found strong support near 0.6460.
Overnight the price rose despite the lack of any news on the economic calendar.
This could be related to the low volume of the current month and perhaps small currency injections or profit taking create such moves.
The price is not yet clear, but there is a high possibility of further decline in the coming days. It may show signs of reversal soon and could fall to 0.6460 and 0.6400.
You may find more details in the chart!
Thank you and Good Luck!
PS: Please support with a like or comment if you find this analysis useful for your trading day
Disclosure: I am part of Trade Nation's Influencer program and receive a monthly fee for using their TradingView charts in my analysis.

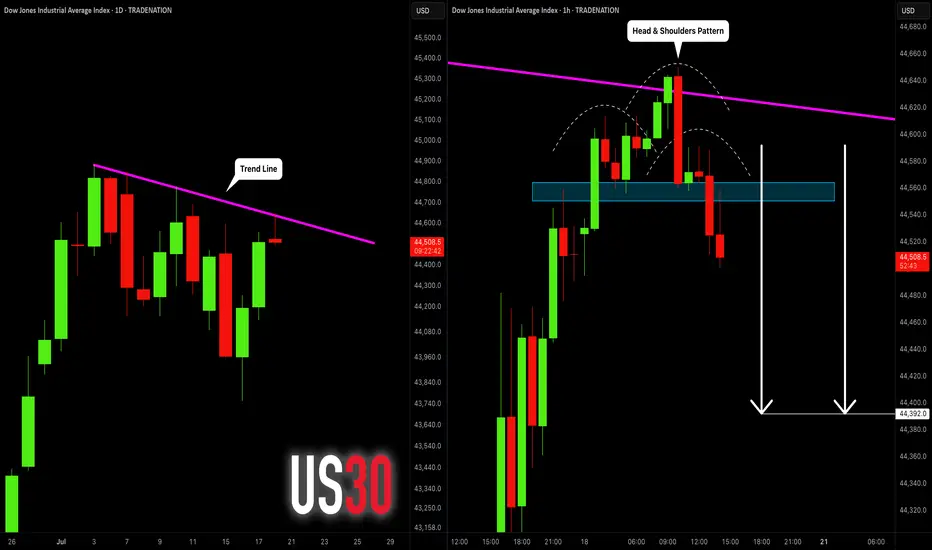
DOW JONES INDEX (US30): Bearish Move From Trend Line
I see a test of a strong trend line on US30.
The price formed a head & shoulders pattern on that
and a breakout of its neckline on an hourly time frame.
I expect a retracement to 48390
❤️Please, support my work with like, thank you!❤️
I am part of Trade Nation's Influencer program and receive a monthly fee for using their TradingView charts in my analysis.
Solana Eyes 15% Rally, Targeting $210 After Key Support BounceHello✌
Let’s analyze Solana’s upcoming price potential 📈.
BINANCE:SOLUSDT is approaching a key daily support near the 0.38 Fibonacci level, setting up for a potential 15% rally with a target around $210. Breaking above the important psychological resistance at $200 could confirm a bullish trend continuation. 📈 If this level holds, SOL looks well-positioned for further upside in the coming weeks. 🚀
✨We put love into every post!
Your support inspires us 💛 Drop a comment we’d love to hear from you! Thanks , Mad Whale 🐋

High Probability Short for Asia: Major Profit at 3318 Description:
Gold remains under pressure below multiple descending trendlines and is consolidating above key support. With volatility high, there’s a strong chance of a breakdown during the Asia session.
Trade Plan:
Wait for a retest of the 3,340–3,355 resistance zone (yellow box).
Watch for a bearish rejection (such as a strong wick, bearish engulfing, or high selling volume) at this zone—do not short blindly.
Enter short after confirmed rejection.
Trade Management:
Take a big part of your profit at 3,318 (first blue support line).
Once 3,318 is hit, immediately move your stop-loss to breakeven (your entry) for the remaining position.
Let the rest run toward the next targets: 3,301 and 3,299, and possibly as low as 3,247 if the breakdown is strong.
Key Points:
High-probability move is expected during the Asia session.
Trade only on confirmation, not at random levels.
If price reclaims and holds above 3,355, bearish idea is invalid.
Summary:
Look for a confirmed rejection near 3,340–3,355. Take most profit at 3,318, move stop-loss to breakeven, and hold the rest for a potential deeper drop.

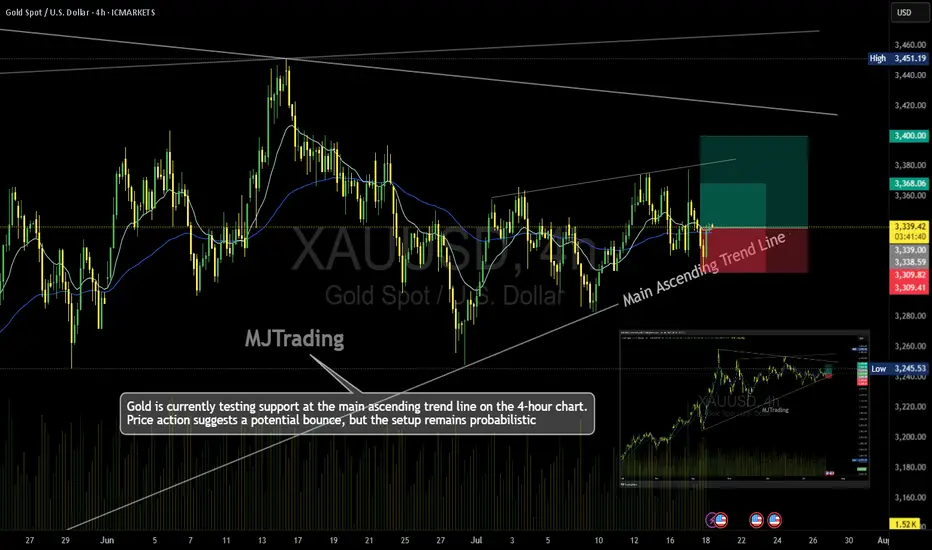
Gold (XAU/USD) – 4H Time Frame Trade Idea📈MJTrading:
Gold is currently testing support at the main ascending trend line on the 4-hour chart. Price action suggests a potential bounce, but the setup remains probabilistic—ideal for traders who operate on higher time frames and manage risk with discipline.
🔹 Trade Setup
Entry: 3340
Stop Loss: 3309
Take Profit 1: 3368
Take Profit 2: 3400
🔍 Technical Context
Price is respecting the long-standing trend line, hinting at bullish continuation.
Risk-reward ratio is favorable, especially for swing traders.
A break below the trend line invalidates the setup—hence the tight SL.
⚠️ Note: While the trend supports upside potential, failure to hold the trend line could trigger deeper retracement. Trade the probabilities, not the certainties.
In case it's not shown properly on your monitor because of different resolutions:
Psychology Always Maters:
#MJTrading #Gold #XAUUSD #Trend #Trendline #Forex #Chart #ChartAnalysis #Buy #Long
EURUSD Will Collapse! SELL!
My dear subscribers,
This is my opinion on the EURUSD next move:
The instrument tests an important psychological level 1.1663
Bias - Bearish
Technical Indicators: Supper Trend gives a precise Bearish signal, while Pivot Point HL predicts price changes and potential reversals in the market.
Target - 1.1632
About Used Indicators:
On the subsequent day, trading above the pivot point is thought to indicate ongoing bullish sentiment, while trading below the pivot point indicates bearish sentiment.
Disclosure: I am part of Trade Nation's Influencer program and receive a monthly fee for using their TradingView charts in my analysis.
———————————
WISH YOU ALL LUCK
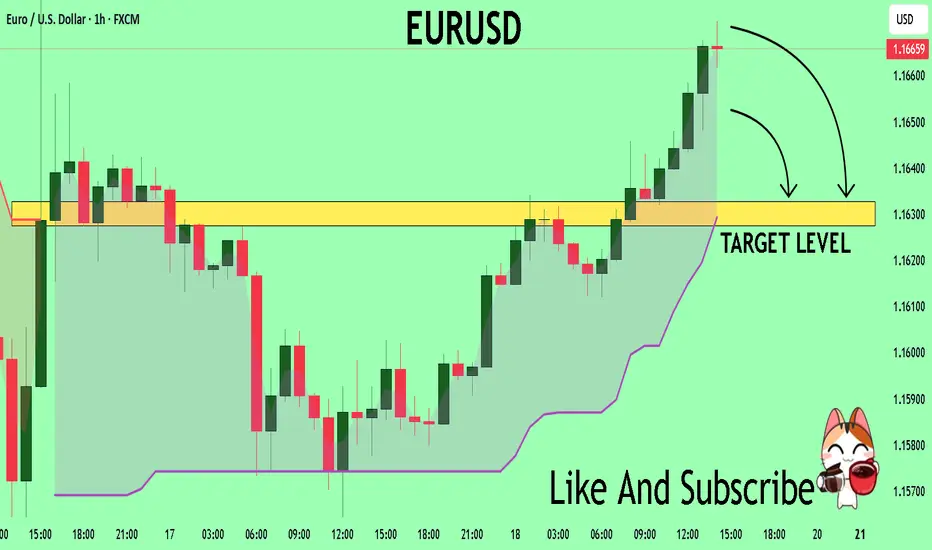
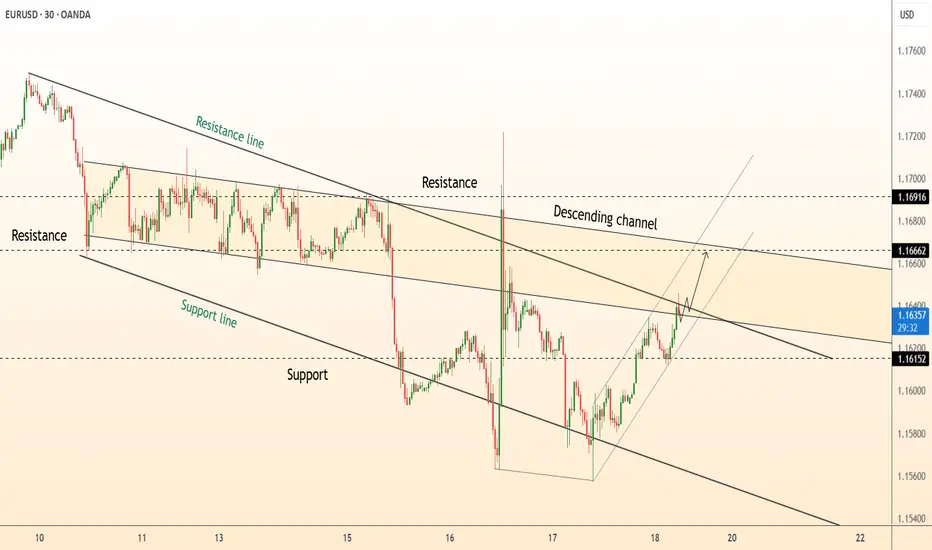
DeGRAM | EURUSD reached the resistance line📊 Technical Analysis
● EUR/USD has reclaimed the inner resistance of the 8-day descending channel after a V-shaped rebound from the lower rail; candles are now riding a fresh micro up-sloper.
● A 30 min close above 1.1666 (channel roof / prior pivot) confirms trend reversal and projects the measured move to the higher congestion band at 1.1690-1.1700.
💡 Fundamental Analysis
● Yesterday’s dip in US 2-yr yields after weaker Philly-Fed new-orders and higher jobless claims softens dollar demand, while ECB minutes signalled no rush to ease further, supporting the euro.
✨ Summary
Long 1.1630-1.1650; break of 1.1666 targets 1.1690 → 1.1700. Invalidate on an H1 close below 1.1585.
-------------------
Share your opinion in the comments and support the idea with a like. Thanks for your support!
XAU / USD 1 Hour ChartHello traders. Looking at the push up from the overnight sessions, I am waiting to see if we push back down or do we start moving up. So for me, I am watching the $3354 area. If we can break and close above that, and with volume and favorable conditions for gold, we could partially fill, or fill the wick to the left marked on the chart. Let's see how things play out. There is no big new today here in the US. Watching the 30 min, the hourly and the 4 hour candles to see if I can get a good entry for scalp buy / sell trades. BIg G gets a shout out. Be well and trade the trend. Happy Friday.

LINK to $230 - $1,087 ALT EW Count Stablecoin Supercycle Part 6!Genius Stablecoin Act just got passed! LETS GO! STABLECOIN SUPERCYCLE!
A few months ago I presented a Primary Elliott Wave Count that suggested Chainlink would top out between $60-$100. Here is the Alternative Elliott Wave Count that suggests that Chainlink will easily hit $230 this market cycle and possibly even 4 digits!
In this alternate wave count, Chainlink is trading in a series of nested 1-2, 1-2, 1-2, 1-2 structures, and the Wave 3 expansions that are about to occur aren't going to send Chainlink to the moon, they are going to send Chainlink to Pluto and beyond. Chainlink will easily hit the 1.618 fibbonaci retracement from the 2021 Bull Market Top to the 2023 Bear Market Bottom which results in a $230 Chainlink. The 2.272 fibbonaci retracement lands Chainlink at $1,087. LOL!
Is this a high probability trade setup? No. Nested 1-2 structures are prone to failing because if one single 1-2 setup fails, it becomes a domino effect where the next 1-2 wave structures are prone to failing. As stated before, I am still expecting the primary wave count to take place with Chainlink topping between $60-$100.
Why did I make this post? Because... everyone is still very underweight alt coins lmao. As stated in previous Ethereum posts, DISBELIEF RALLY happening before your very eyes.

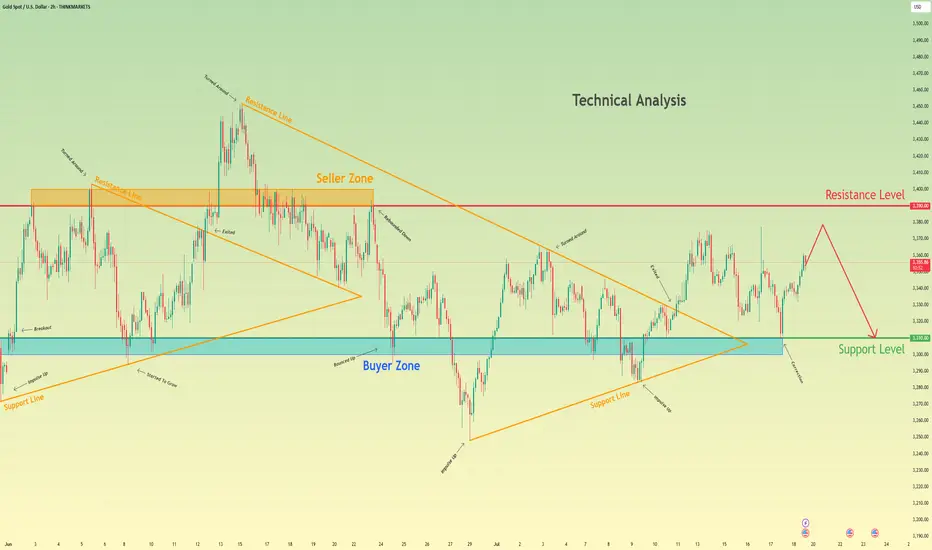
Gold may rise a little and then drop to support levelHello traders, I want share with you my opinion about Gold. Initially, gold was trading within a large consolidating pennant, showing both upward and downward impulses as it moved between the converging trend lines. The price eventually saw a breakout from this pattern, followed by a strong impulse up, but this momentum stalled as it approached the major horizontal resistance level at 3390. This level, which corresponds with the upper seller zone, has proven to be a significant barrier for buyers, rejecting the price and confirming a strong seller presence in that area. Currently, the market is in a corrective phase after being rejected from the highs. The price is drifting upwards once again in what appears to be a final retest of the aforementioned seller zone. This slow upward movement lacks the impulsive strength of the previous trend, suggesting that buyers are losing control and sellers are preparing to defend the 3390 resistance level once more. I expect this corrective move to fail upon reaching the seller zone around 3390. After this retest, I anticipate a sharp reversal and the beginning of a new downward trend. The logical target for this move is the major support level at 3310, an area that has historically acted as a strong buyer zone. That is why my TP is set at 3310. Please share this idea with your friends and click Boost 🚀
Disclaimer: As part of ThinkMarkets’ Influencer Program, I am sponsored to share and publish their charts in my analysis.
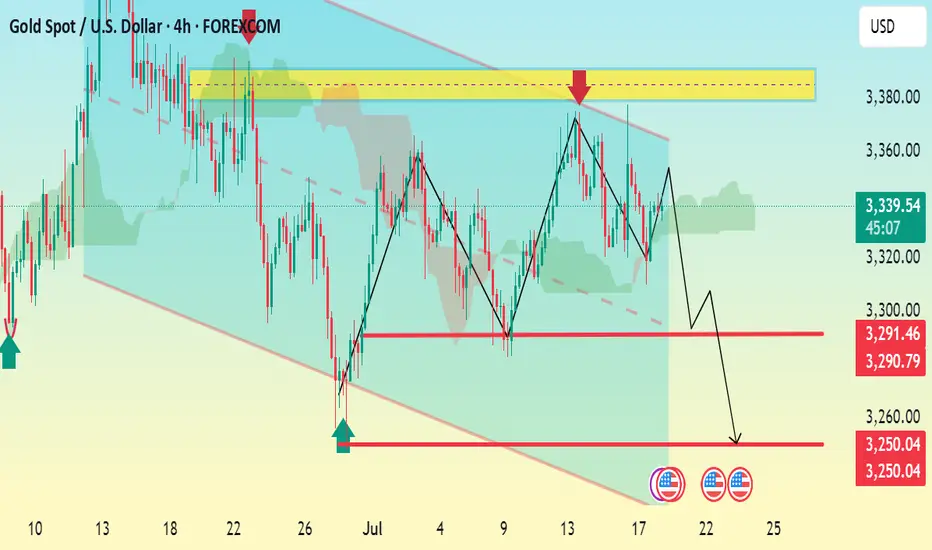
XAU/USD 4H Bearish Continuation Setup Analysis:Price recently rejected from the key resistance zone around 3,370–3,380 (highlighted in yellow).
A double top pattern is evident, indicating bearish pressure.
Price broke the rising trendline support and is forming lower highs.
Immediate support levels lie at:
3,291.46
3,290.79
A confirmed break below this support could send price toward the next major support at 3,250.04, which aligns with the projected move.
Bearish Bias:
As long as price remains below 3,344, the structure favors further downside.
Watch for a break and retest of the 3,291–3,290 zone for confirmation.
📉 TP Zones:
TP1: 3,291
TP2: 3,250
🛑 Invalid if price breaks above: 3,344
Gold continues to be weak, but be careful about operations📣Gold prices fell 2% last Friday, hitting a near one-month low. Optimistic trade-related agreements boosted risk appetite and weakened the attractiveness of gold as a safe-haven asset. This week, the market will usher in a group meeting of major central bank governors around the world (Fed Chairman Powell, European Central Bank President Lagarde, Bank of England Governor Bailey, Bank of Japan Governor Kazuo Ueda, and Bank of Korea Governor Lee Chang-yong). The market will also usher in non-agricultural data. In addition, Powell's remarks on whether to resign may ignite the market this week. Gold prices may fluctuate more around the lower track of the Bollinger Band at $3,270/ounce this week.
Technical analysis:
Last Friday, the K-line had a lower shadow, and the Bollinger Band did not diverge. It is not easy to go short directly in operation, but wait for the rebound to confirm 3295 and the key resistance of ma5 to be short.
💰 Operation strategy: Rebound to 3280-3283 to go short, target 3270-3265, stop loss 3288-3290
If you are a beginner, I suggest you first understand what trading is.

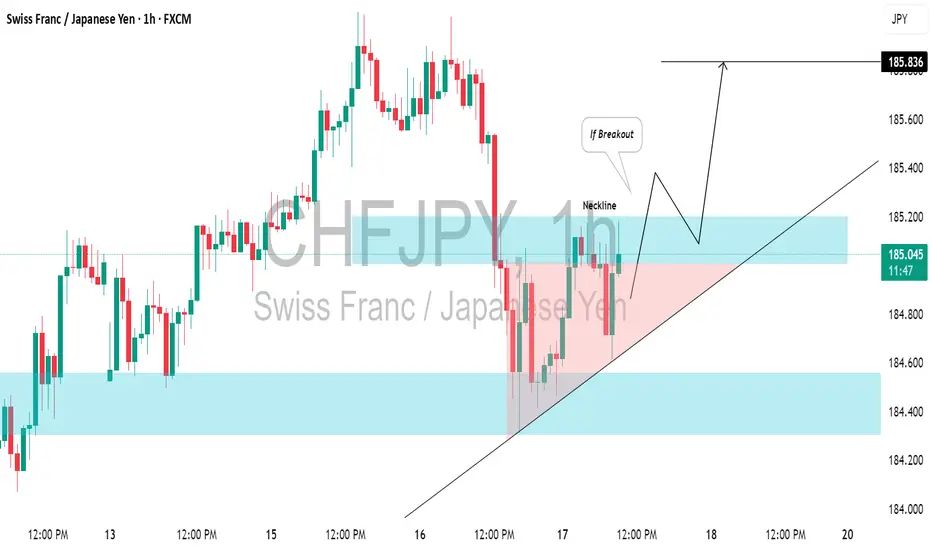
CHFJPY: Your Trading Plan For Today⚠️CHFJPY is currently testing a recently breached key daily/intraday resistance level, which is likely to have become support.
We will look for a confirmation to buy when there is a bullish breakout above the neckline of an ascending triangle pattern on the 1-hour chart.
A close above 185.20 will validate this breakout, and we anticipate a bullish continuation towards at least 185.83.
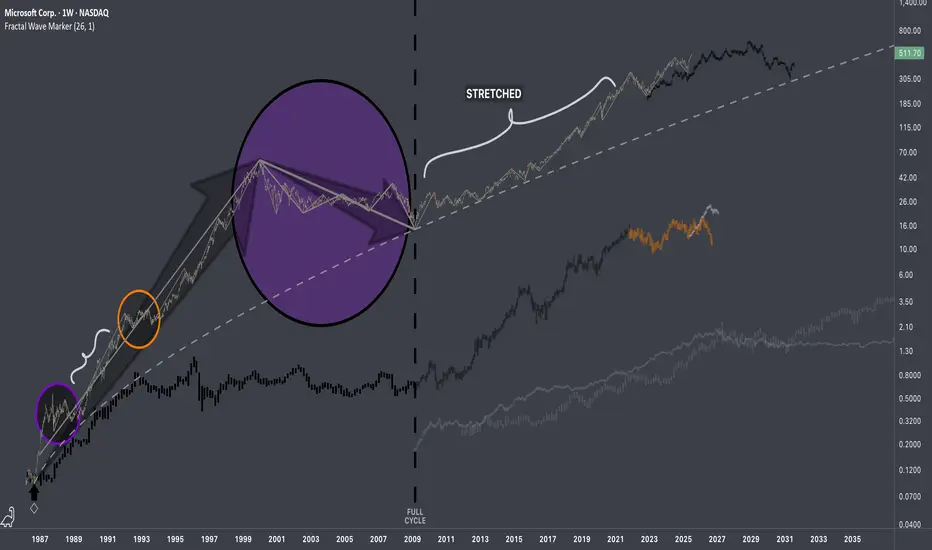
$MSFT: Fractal Hierarchy IResearch Notes
Fluctuations reappearing at broader scale.
If both are manifestations of the same pattern, then the next segments can be applied accordingly.
The remaining part can be deformed (depending on future volatility which can accelerate completion of composite sub-cycles)
Documenting it publicly to keep record of these particular recurring patterns.
Long - XRP (Weekly Chart)Long Swing Position
Perfectly bounced from .618 and RSI above 50. Expect the bullish momentum
Entry : $2.15
Resistance: $2.3
PT1: $2.7
PT2: $3.39
PT3: Update after crossing PT2
Stop loss: If it shows sign of weak rally to the upside, RSI cross below 50. Stop loss below fib 0.5 at $1.9 & monitor price movement when hitting fib 0.618 -> stop loss below it or re-entry when showing strong rally sign.

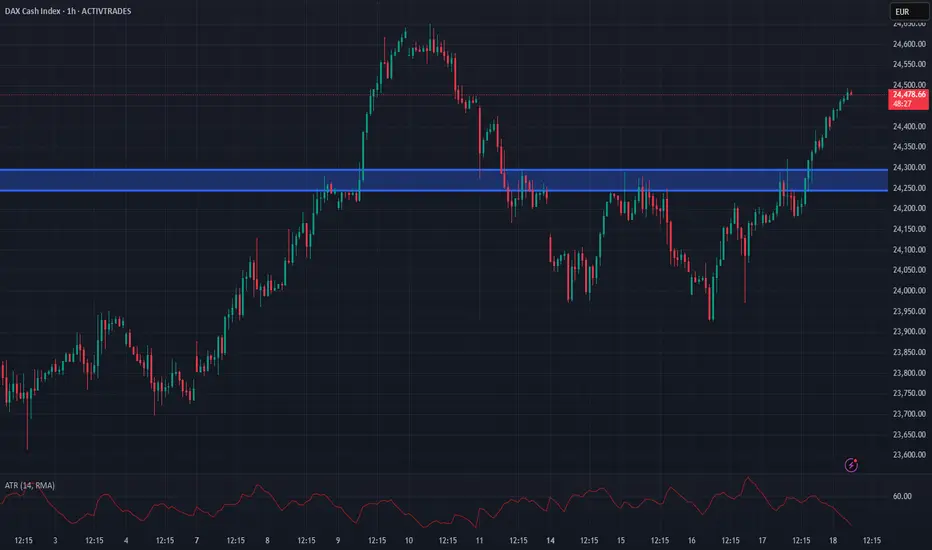
Dax Breaks Higher to keep the bullish toneDax has moved back above the 24245-24295 zone impulsively and we retain the overall bullish tone
Retests of this area can provide an opportunity to get long
Stops need to be below 24170
Targets can be back towards 24400 and even hold a runner back to the All time highs
Short term next target for ETH - 1100$; Market crash in JuneEthereum will be reaching 2808$ in coming days before month May is closed.
ETH almost reached main liquidity zone for this rally and also 200MA. As soon this level is done - expect another market crash in June.
Next crash will be super fast and most of altcoins will drop even lower.
Target for ETH in month of June is between 1100$ and 1300$.
After this crash we will see altcoin season and ETH will lead it.
We are entering last phase of a bull run. There are about 3 months left before we enter a bear market officially.
Here is previous idea from 1300$ to 2808$
