LOOKING FOWARD TO SHORT THIS WHAT'S YOUR OPINIONS This is not a financial advice its just an insight on what a market can print out based on the current data and stats any one can share in the comment section
Chart Patterns

BITCOIN CME GAP IS FILLING RIGHT NOW!#Bitcoin CME Futures
Bitcoin is dipping — and all signs point to the CME gap getting filled.
Historically, these dips have been aggressively bought, so a strong bounce from here looks likely.

Fakeout before huge breakout in EURUSD#EURUSD Fakeout before huge candle breakout.
Just a learning experience how fakeouts are very frequent on forex and crypto market

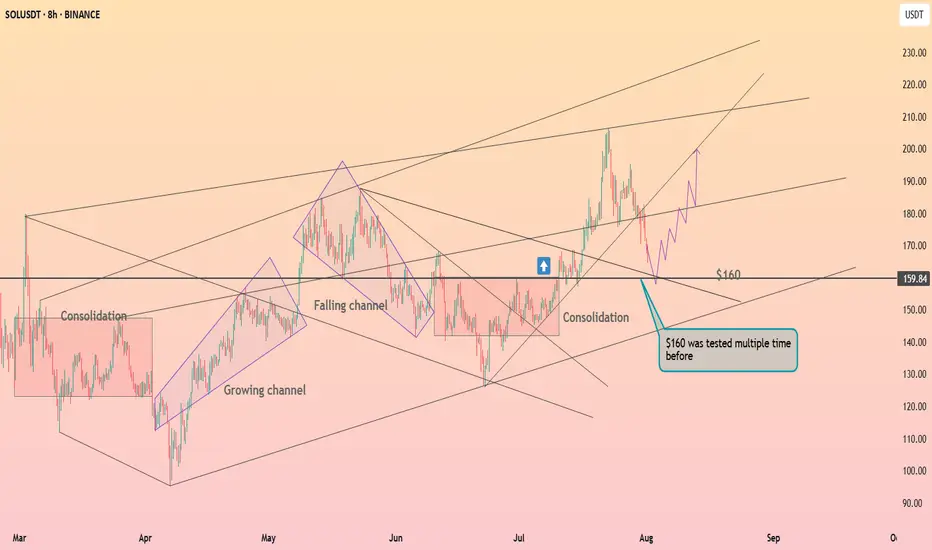
Solana above the $160 level ┆ HolderStatBINANCE:SOLUSDT is retracing toward the $160 support after failing to hold above $190. Price previously broke out from a falling channel and may find support at $160 again, where multiple reversals have occurred. A bounce here could fuel a move to $200.
USDZAR-SELL strategy 6 hourly chart Reg. ChannelSame as the USDX of course, the pair is overbought. i felt yesterday we may see higher, but was not convinced to belong, however, we can add to our SELL, or have SELL position up here. The Reg. Channel is violated amidst this overbought status provides a good warning of potential corrective action.
Strategy SELL @ 18.2000-18.2500 and take profit near 18.0350 for now.

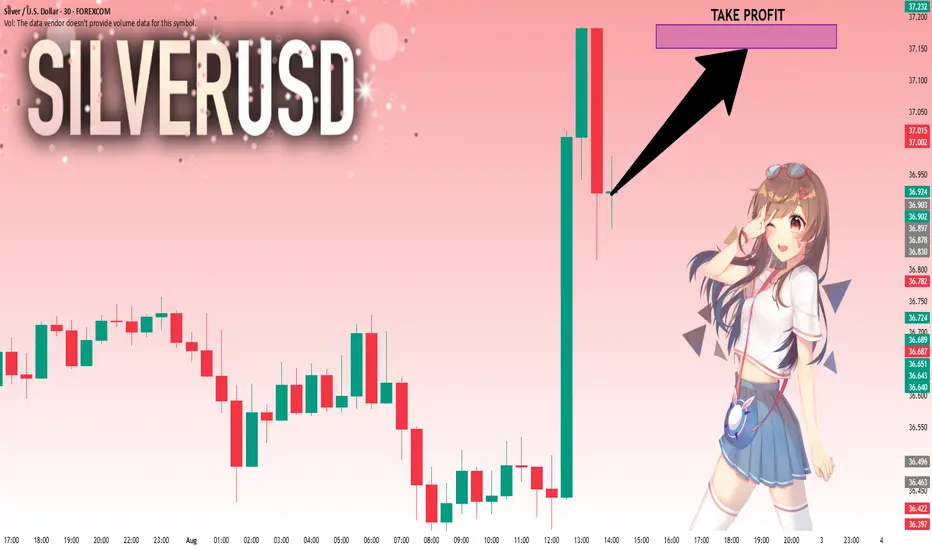
SILVER: Local Bullish Bias! Long!
My dear friends,
Today we will analyse SILVER together☺️
The recent price action suggests a shift in mid-term momentum. A break above the current local range around 36.920 will confirm the new direction upwards with the target being the next key level of 37.150 and a reconvened placement of a stop-loss beyond the range.
❤️Sending you lots of Love and Hugs❤️
Range again $ETHDue to typical ETH behavior we can form a range
Can be identified without any lines where I suppose will stay for a month or so consolidating

Panic sets in. but its all goodThe crypto market has experienced a strong panic driven correction as the FED refuses to cut rates and inflation is on the rise while wages are slowly in decline.
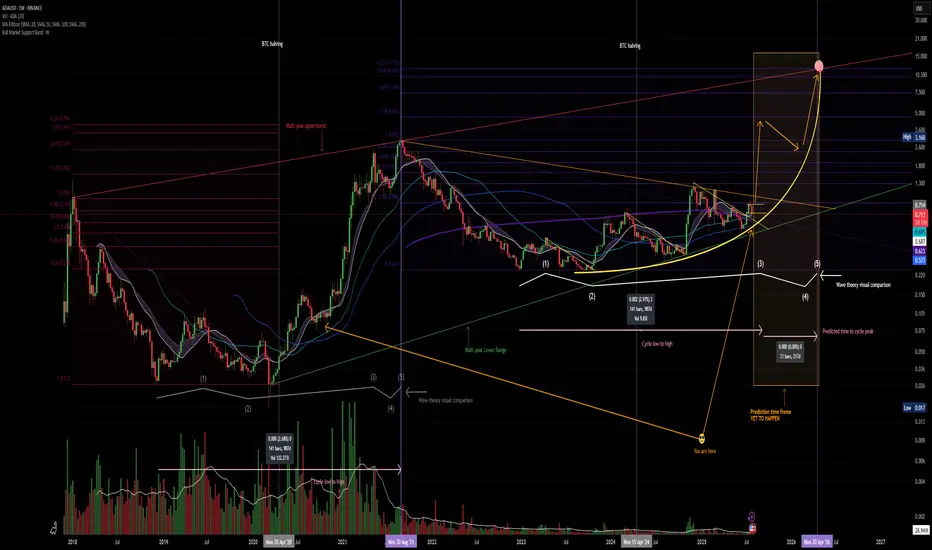
CRYPTOCAP:ADA continues to provide thrills and chills
Is it time to dump? and cry into your empty wallet?
IMO NO, CRYPTOCAP:BTC has recently taken out liquidity below the $117,000.00 price point which is a normal move, if you are over leveraged it can feel horrible but I assess as a normal correction.
CRYPTOCAP:ADA price remains in the range in which it has formed .93 - .71 the possibility that CRYPTOCAP:ADA can dip deeper to .65 is possible but unlikely. This correction provides a cooling off of MACD and RSI on higher timeframes and the chart still remains BULLISH.
Remember be greedy when others are fearful.
A man who says he never had a chance never took a chance!
GOLD 2 HR CHART Gold 2 hr chart based on the 2hr time fame , the price support at 3384 creating a ascend channel

Bull Trap Confirmed: GBPUSD's 8% Rally Faces ExhaustionLets Face it we had a great 6 months already clocking 60%+ Returns already.
And after sitting ducks for almost 2 months now we finally have a trade.
- Its a very self explanatory chart
- Trading at resistance
- Head & Shoulder pattern
And the best part the right shoulder is still yet to be formed! My favourite type of entry.
1.It gives a better risk reward ratio (1:7 expected)
2.Better Entry (No long red candles)
3. And even if the pattern fails it we may still reach the neck line which is target 1.
Entry Criteria
- A Red candle at the entry Line Marked
- Stoploss Above the Entry Candle
Target 1- 1.3361
Target 2- 1.3252
Target 3- 1.3169
Keep Your Risk Reward Intact! Not An investment Advice

Bearish Engulfing on Risk. Average quarterly downside since 2023 open is 4.07%. Is a retest of near the yearly open on order over the month of August? Markets are no longer pricing in a Fed rate cut in September. Will that be the near term bearish fuel?

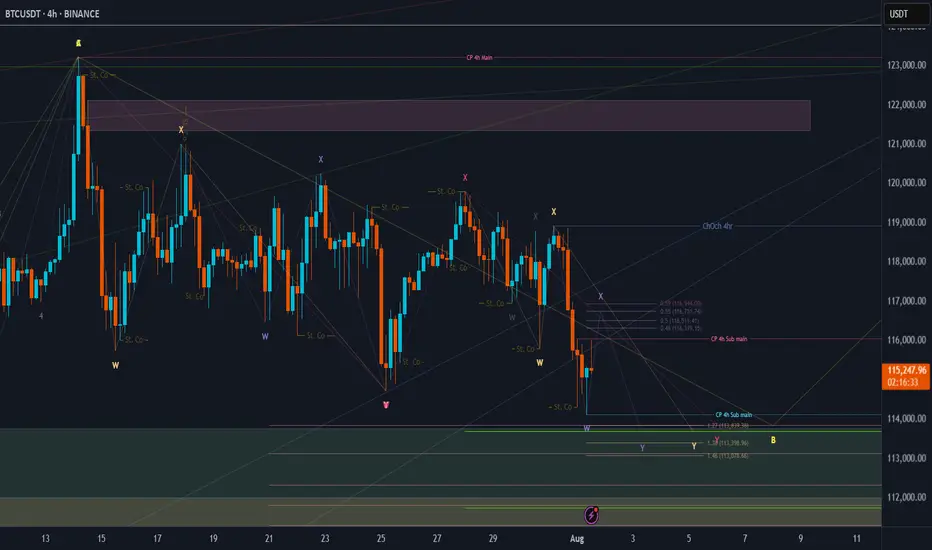
BTC Price Prediction and Elliott Wave AnalysisHello friends,
>> Thank you for joining me in my analysis. We have finished the pink X wave directly, then we have gone to the final pink Y wave, which consists of wxy in orange counting. Now we are moving into the final Orange Y wave.
>> our confirmations:
* 4Hr TF: Breaking 118990 for the next hours, we will end the whole Yellow B "correction" wave successfully. .
Keep liking and supporting me to continue. See you soon!
Thanks, Bros
Pudgy Penguins (PENGU): Huge Volatile Movement IncomingPengu coin seems to be in a pretty dangerous zone; while we are hovering near the ATH and seeing some smaller pullback prices, we are yet to see the potential huge breakout take place or breakdown happen.
We have marked 2 zones to keep an eye on; if either of those zones is broken, a huge volatile movement will happen so be careful!
As long as we are above the Sell Zone, we are going to look for more MSB areas for smaller long scalps!
Swallow Academy

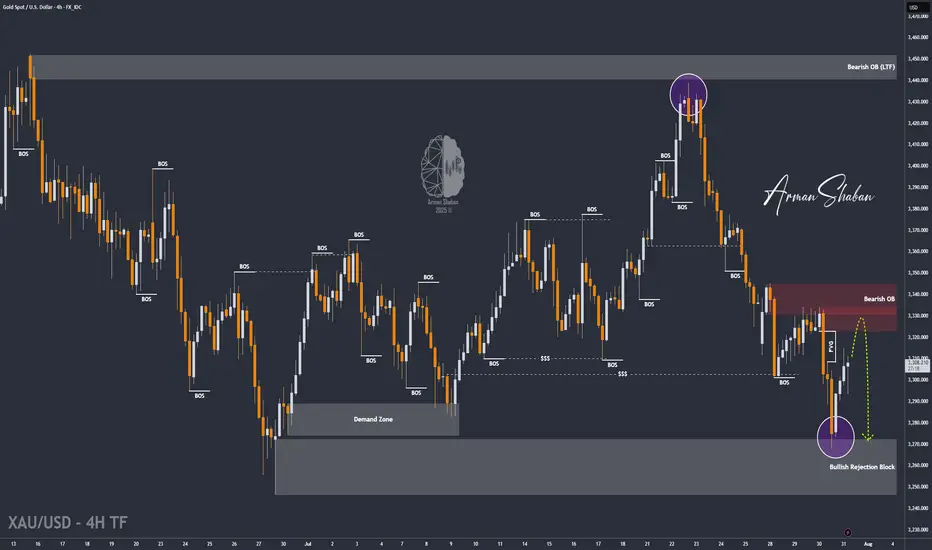
XAU/USD | Next Key Zone: Watch for Rejection at $3334! (READ)By analyzing the gold chart on the 4-hour timeframe, we can see that, just as expected, the price dropped from $3310 to $3288 in the first leg, where it hit a demand zone and bounced up to $3305, delivering a 170-pip rally. The main bearish move from $3333 to $3288 yielded 450 pips, bringing the total return on this analysis to over 620 pips!
In the second phase, gold dropped sharply again to $3268, and once more found demand, currently trading around $3307. If the price holds above $3294, we could expect further upside toward the $3322–$3334 zone. Once gold reaches this area, a strong bearish rejection is likely, with a potential return of 250 to 400 pips.
All key supply and demand levels are marked on the chart — make sure to monitor them closely and study the chart in detail. Hope you’ve made the most of this powerful analysis!
Please support me with your likes and comments to motivate me to share more analysis with you and share your opinion about the possible trend of this chart with me !
Best Regards , Arman Shaban
More Pullback=Further Launch!!The structure has morphed
once again but the direction expectation
is still 100% in tact. In fact, all
we're doing right now is pulling
the bow string back a little more to
allow the arrow to fly up that
much further and faster! BTFD!!!!

Gold OutlookI think Gold is about to do a minor recovery Pump , after days of Red, maybe we are about to see some relief green, this is my very first long trade

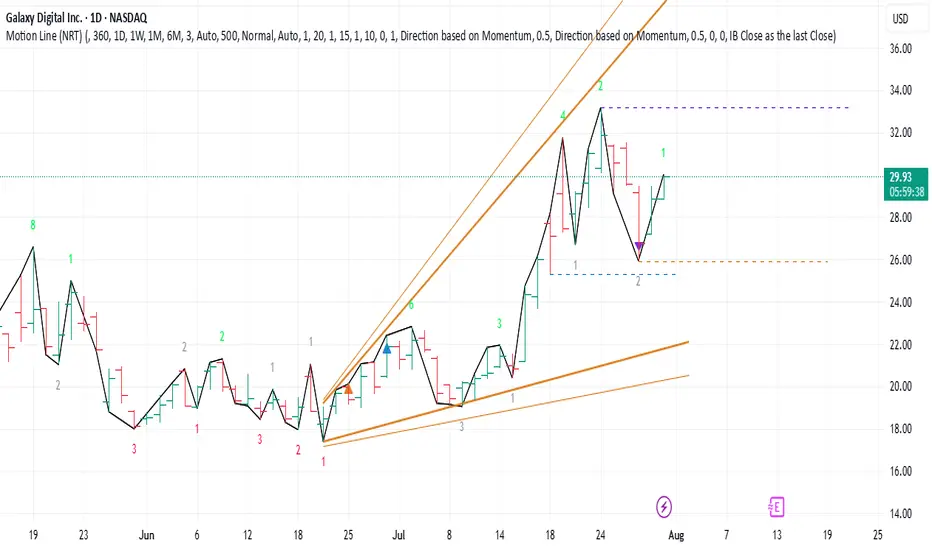
TradeUSAsignals RecommendationsLong (5% of your portfolio) GLXY (Order filled @ 29.57)
We have an up trend under Time traders control (brown arrow) with a correction more than 38.2%.
A comeback trendI think the downward trend will continue.
As you can see on the chart, if there is no news, the trend continues in a channel.
Gold Crashes $100 After Hitting Monthly High | What’s Next?In this video, I break down everything that moved the price of gold last week, from the early-week rally toward $3,430 to the sharp midweek drop toward $3,325. We go beyond the surface, diving into what caused the reversal, and how I'm approaching next week’s market using a simple ascending channel on the 4-hour chart.
With major events like the FOMC rate decision, U.S. GDP, PCE inflation, NFP and the August 1 tariff deadline all on the radar, this analysis will help you stay grounded and prepare for volatility.
👉 If you find this content valuable, don’t forget to Boost, Comment, and Subscribe for weekly market breakdowns.
Disclaimer:
Based on experience and what I see on the charts, this is my take. It’s not financial advice—always do your research and consult a licensed advisor before trading.
#goldanalysis, #goldforecast, #xauusd, #goldpriceprediction, #technicalanalysis, #fundamentalanalysis, #tradingstrategy, #forextrader, #priceaction, #fomc, #usgdp, #pceinflation, #goldtrading, #forexeducation, #dollarvsgold, #tariffnews, #chartanalysis, #forexmentorship, #rebuildingthetraderwithin


Xlm -Just hit my T2 target7/23- My first post
-Xlm was $.42
7/24- T2 (top of range) hit $.4
7/27-Pumped 15%
as anticipated
8/1 -T2 bottom Hit (WT)
Could go lower and hit WT Low...
But I love it when a plan comes together.
I hope my T3 doesn't get hit (after this bounce).
May the trends be with you.


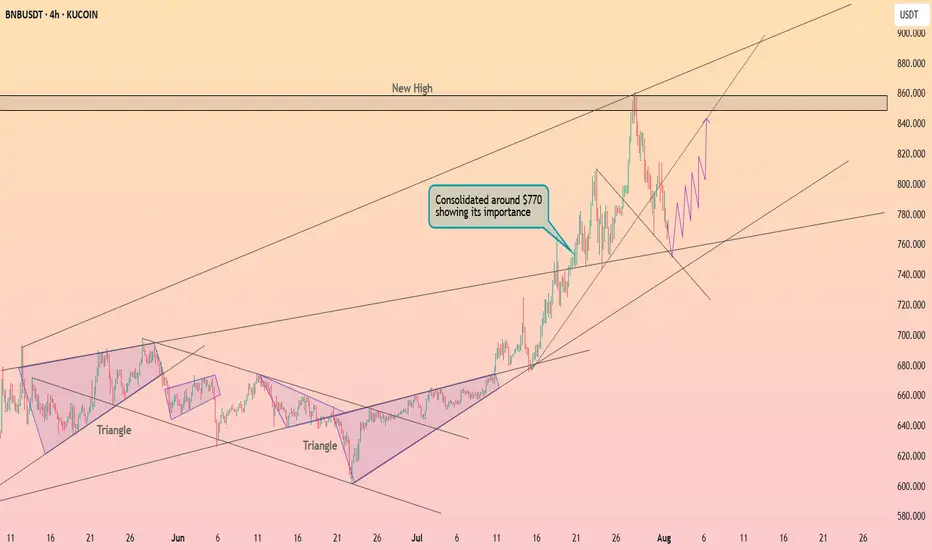
Binance coin around $760 ┆ HolderStatBINANCE:BNBUSDT has retraced from its recent high and is consolidating just above $770, a former resistance now acting as support. A bounce from this level would reinforce the uptrend and open the door for a potential push toward $860, continuing the bullish structure.