ABCD Pattern may play.EFERT
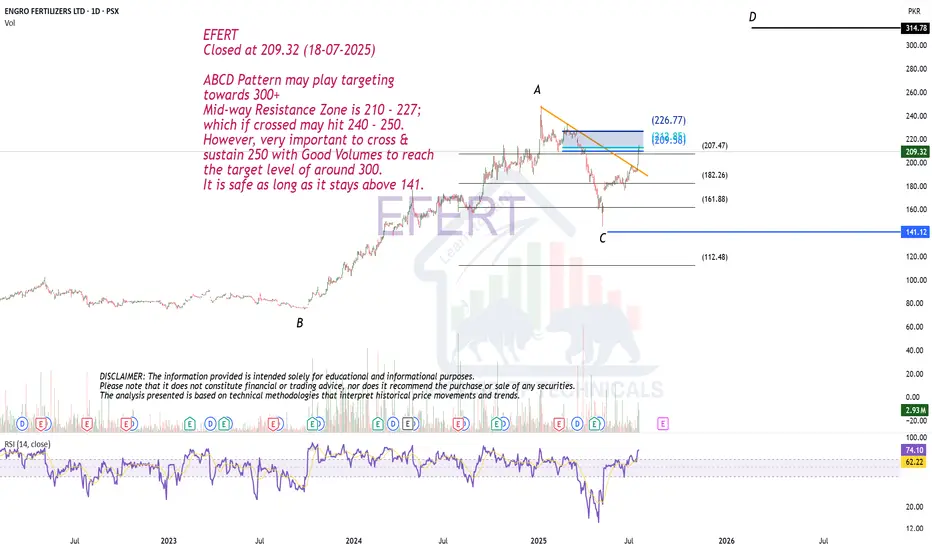
Closed at 209.32 (18-07-2025)
ABCD Pattern may play targeting
towards 300+
Mid-way Resistance Zone is 210 - 227;
which if crossed may hit 240 - 250.
However, very important to cross &
sustain 250 with Good Volumes to reach
the target level of around 300.
It is safe as long as it stays above 141.
Chart Patterns
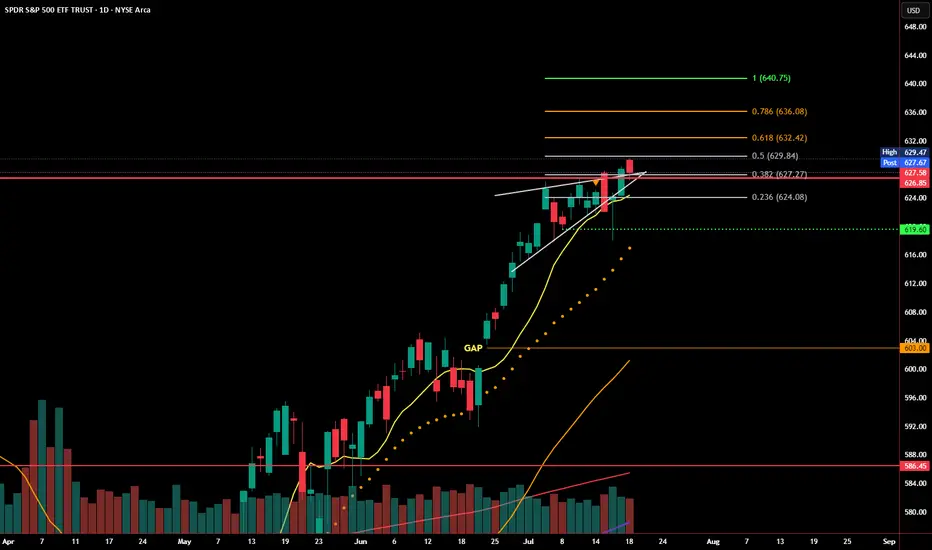
SPY Reclaims Rising Wedge Support - Bear Trap or Breakout Setup?SPY dropped below its rising wedge earlier this week, but that move may have been a bear trap. Price quickly reversed, reclaiming the wedge trendline and closing just below a key Fibonacci level at 629.84.
Buyers stepped in aggressively near the 0.382 and 0.236 retracement zones, defending short-term support. The bounce came on increased volume, signaling strength behind the recovery. Momentum remains intact as long as SPY holds above 626.
Now, bulls need to confirm with a breakout above 629.84–631.96 to open the door to the next levels at 635.63 and 640.30. Failure to break through could lead to another rejection and revisit lower support zones.
Levels to watch:
Support: 626.64, 623.62, 619.60
Resistance: 629.84, 631.96, 635.63
SPY is at a decision point. Reclaiming wedge support is a bullish signal, but bulls need follow-through to avoid another fakeout in the opposite direction.
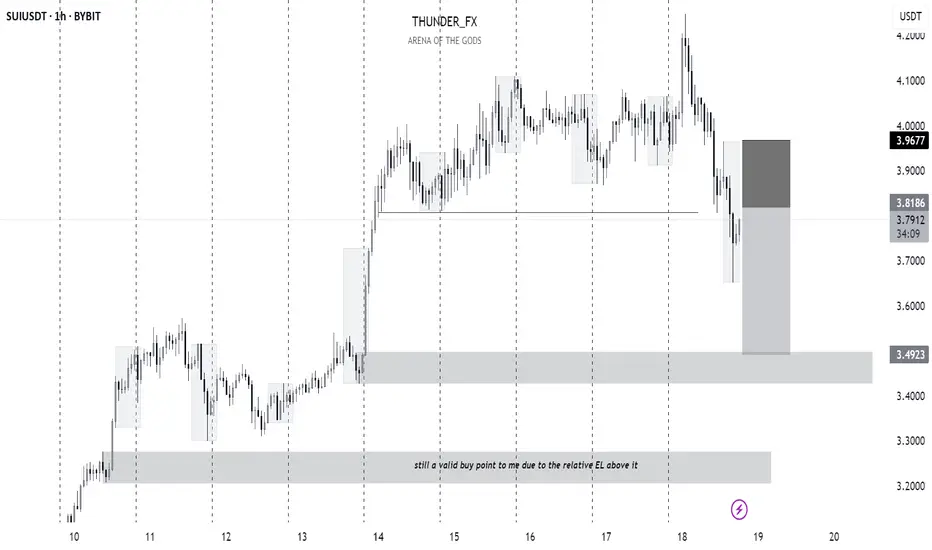
Possible SellSUI is looking to reprice lower. A buy into the 1hr fvg would most likely see price go lower.
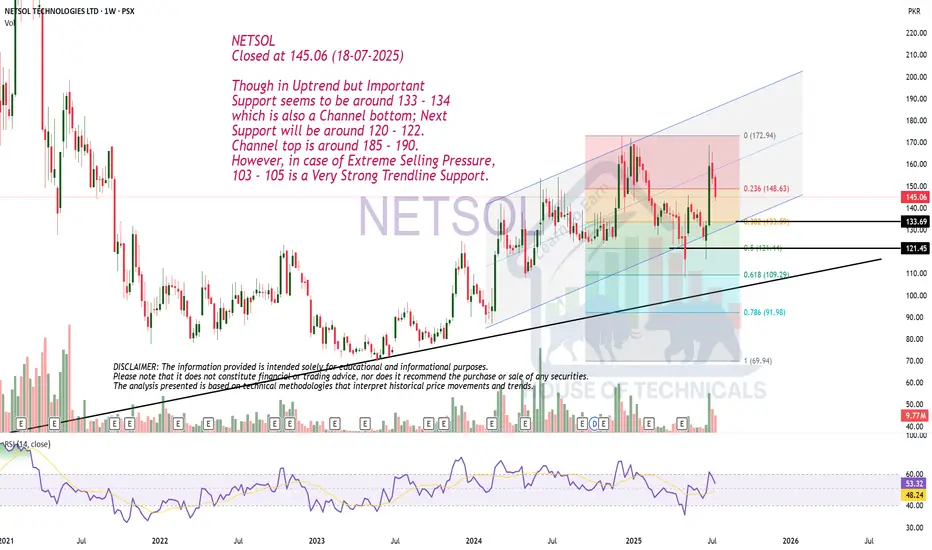
Though in Uptrend but..NETSOL
Closed at 145.06 (18-07-2025)
Though in Uptrend but Important
Support seems to be around 133 - 134
which is also a Channel bottom; Next
Support will be around 120 - 122.
Channel top is around 185 - 190.
However, in case of Extreme Selling Pressure,
103 - 105 is a Very Strong Trendline Support.
Sell and wait because of the 100days growth rule 100 days for ETH BTC and most. Some more days for doge maybe and solana. Then i may buy back if it is a quick drop.

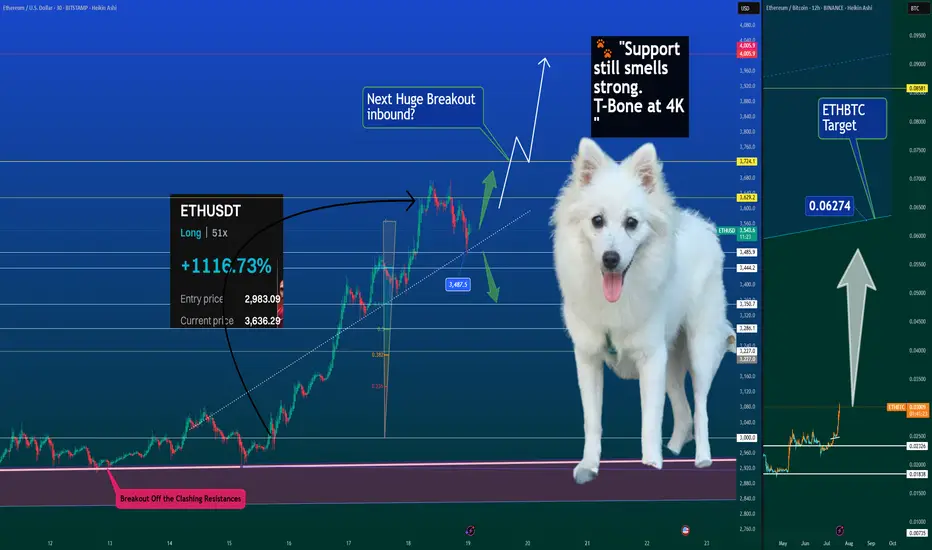
Is ETH Season Officially Here? 🚀🐾 Ethereum Breaking Out – Is ETH Season Officially Here? 📈💥
Ethereum is showing strength across the board — outperforming Bitcoin, reclaiming trendline support, and eyeing a possible breakout continuation. While macro narratives swirl (crypto legislation, rate cut vibes, political tailwinds), ETH is finally doing what ETH does best — lead.
📊 Chart Breakdown:
ETHUSDT is respecting the dotted trendline off the breakout.
Price is hovering around $3487 support, an area that aligns with Fib retracement and the last impulse base.
If bulls can maintain structure, $4000–$4050 is a natural magnet above.
📈 On the ETHBTC side, we’re aiming for the 0.06274 level — this ratio breakout is classic ETH season behavior, where Ethereum not only rises but pulls the rest of the market with it.
👀 And yes… even Elon my Dog is sniffing this one out:
🐾 "Support still smells strong. T-Bone at 4K." Then we go higher for the Cow.
📊 Order Flow Data Confirms:
Premium: Still slightly negative — market hasn’t fully rotated in.
Funding: Light and positive — sustainable, not euphoric.
Open Interest: Saw a soft reset — leverage was cleared out, opening room to rally.
Spot volume: Steady and supportive, not chasing.
🔥 +1116% ROI from the last long from $2,983.09. If you’re holding ETH — you’re holding the mic right now. Let's not drop it.
This could just be the beginning — and when ETH leads, the rest tends to follow.
Elon and the whole 🐶 Dog Team are on high alert. Breakout energy is thick.
One Love,
The FXPROFESSOR 💙
Disclosure: I am happy to be part of the Trade Nation's Influencer program and receive a monthly fee for using their TradingView charts in my analysis. Awesome broker, where the trader really comes first! 🌟🤝📈
//@version=5 indicator("Fibonacci Altseason Levels", overlay=tru//@version=5
indicator("Fibonacci Altseason Levels", overlay=true)
var float base = 0.2 // ضع هنا القاع
var float top = 1.0 // ضع هنا القمة
var float retrace = 0.6 // ضع هنا نهاية التصحيح
fib1 = base + (top - base) * 1.618
fib2 = base + (top - base) * 2.618
fib3 = base + (top - base) * 3.618
plot(fib1, "Target 1.618", color=color.green, linewidth=2)
plot(fib2, "Target 2.618", color=color.orange, linewidth=2)
plot(fib3, "Target 3.618", color=color.red, linewidth=2)

EUR/USD Bearish Reversal Confirmed – Smart Money Distribution Ne📅 Posted July 18, 2025 | 🔍 VolanX Protocol Insight
📉 Market Outlook:
The EUR/USD pair has rejected the premium supply zone (1.17–1.18) after failing to maintain structure above the red trendline. Price is now breaking down with bearish pressure building toward equilibrium at 1.09544.
📊 VolanX DSS Breakdown:
🔴 Premium Rejection confirms distribution by institutional players.
📈 Trendline Violation + SMC BOS = Shift to markdown phase.
🧠 VolanX Signal Score: Neutral → Bearish
→ Favoring short plays targeting deeper liquidity blocks.
🌐 Macro Narrative (Q3 2025):
🇺🇸 USD Strength: Driven by sticky inflation and delayed Fed cuts (Q4 expected).
🇪🇺 Eurozone Softness: Germany's PMI fell below 50; ECB’s cautious tone continues.
🏦 Rate Divergence Play: US-EU real yield gap widening → capital flowing into USD.
🎯 Probabilistic Target Path (Yellow Line):
✅ 1.1500: First liquidity gap
✅ 1.1150: Midblock retrace
🎯 1.09544: Equilibrium & High-Confidence Institutional Re-entry Zone
🛡️ VolanX Protocol Note:
This forecast is part of the WaverVanir Smart Futures Playbook. All trades are structured with AI-defined probability zones, institutional positioning layers, and macro-event syncing. The VolanX engine will reassess upon retest of the 1.1500 mid-zone.
#EURUSD #Forex #SmartMoney #MacroFX #VolanX #WaverVanir #LiquidityZones #InstitutionalTrading #TechnicalAnalysis #ForexSignals #DXY #Eurozone #FED #ECB #OptionsFlow

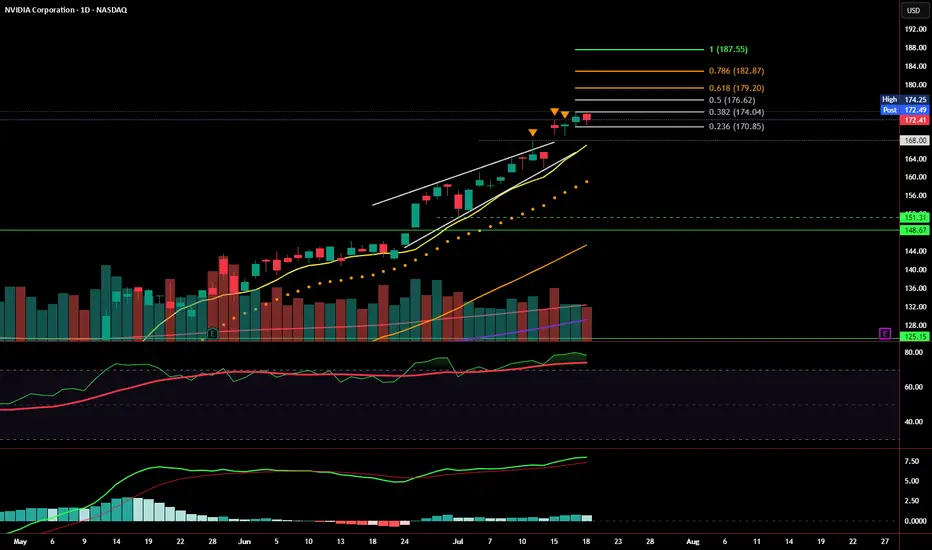
Weekly Close: Still Bullish, But Momentum Is SlowingNVDA closed the week at $172.41, just under short-term resistance and holding well above the prior rising wedge structure. Price action remains technically bullish, with a healthy consolidation forming just below the 0.382 Fibonacci retracement at $174.04.
That said, momentum is beginning to cool, and the next few sessions will be key.
📊 Current Read: Mildly Bullish
Price is holding above key support levels: 9 EMA, $170.85, and prior wedge resistance
No breakdowns — structure remains intact
However, volume is fading, and MACD is flattening, suggesting possible buyer fatigue
RSI remains elevated, not yet signaling reversal, but approaching caution territory
A confirmed breakout above $174.25 sets the stage for Fibonacci targets at:
🔸 $176.62, $179.20, $182.87, and $187.55
A close below $170.85 , and especially $168, would invalidate the current bullish structure and shift bias to bearish — targeting the $151.31–148.67 support zone.
Summary:
📈 Bias: Bullish - but cautious.
Price is consolidating near highs with no signs of breakdown yet. Continuation likely if bulls step in early next week.
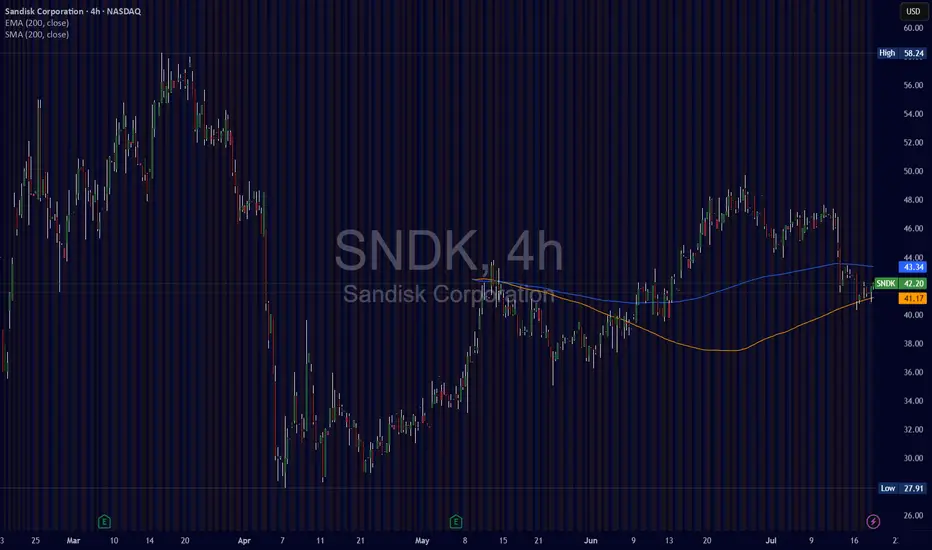
SanDiskIt seems that everyone typically looks toward the magnificent 7 for easy returns because they are so prevalent in our day to day lives. However, many people overlook companies like NASDAQ:SNDK mainly because their brand isn't shoved in our faces 24/7. But that's okay, SanDisk still controls about 1/4 of all small device storage market share, meaning they more than likely are here to stay for a while. Even though the stock is volatile, I have taken a substantial position in this company with the intent to sell for a nice profit.
My current position:
Buy 1 @ 45.39 ( July 7, 2025)
Buy 2 @ 42.15 ( July 14, 2025)
Currently the stock is trading above or near the 4 Hour 200 EMA and 200 SMA both of which are clearly moving at an uptrend. As for the industry itself, storage cards are always in demand especially for small consumer devices which has and absolutely gargantuan market. Most large institutions and rating agencies have this tock as a buy with some targets raising as high as $80 per share. Although that is optimistic this trade is aiming for a timeframe of 3 to 5 months, which could work out with that price target.
Here's the goal, sell 90% to 100% of the entire position with a price target of $62. It's just that simple.
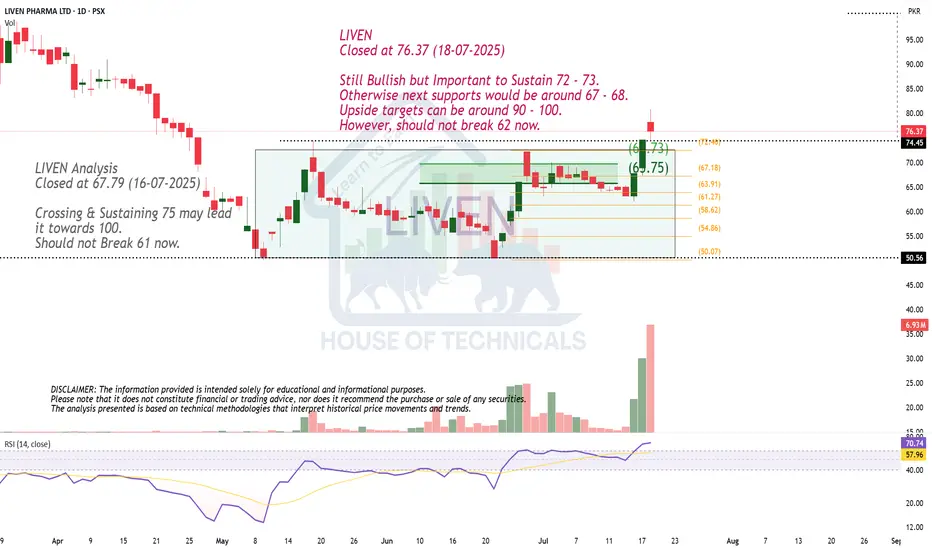
Still Bullish but ..LIVEN
Closed at 76.37 (18-07-2025)
Still Bullish but Important to Sustain 72 - 73.
Otherwise next supports would be around 67 - 68.
Upside targets can be around 90 - 100.
However, should not break 62 now.
Party Over? Time to get back to senses!- NASDAQ:HOOD valuation is way stretched and it should correct to a reasonable valuation.
- This needs correction. Let's see how it folds out in next 6-12 months

Important Resistance !ISL
Closed at 97.96 (18-07-2025)
Important Resistance is around 98 - 104.
Once crossed with Good Volumes, we may
witness upside move towards 130 & then
around 150.
On the flip side, 94 - 96 & then around 80 - 83
are the Important Support Levels.

BTC Battles Resistance – Can Bulls Reclaim the Channel?🔥📈 BTC Battles Resistance – Can Bulls Reclaim the Channel? 🧠🚪
Bitcoin is now knocking on the door of the broken channel support — what was once a floor is now acting as resistance. For bulls to regain momentum, price must reclaim and close back inside the channel, ideally above 118.6K.
📍 Key Structural Notes:
We've already broken below the internal channel — this is no longer a confirmed uptrend.
Current resistance is the same trendline that previously acted as support — classic technical flip.
Failing here keeps BTC vulnerable for a deeper move toward the Main Support at 114.9K, where the real test lies.
📊 Order Flow Context:
Funding remains mildly positive, showing no panic from longs.
Premium is near-zero — market isn't chasing.
OI is steady, showing neutral positioning but potential for sudden volatility.
Spot volume picked up during the recent move, but not strong enough to confirm a breakout… yet.
🧩 Scenarios:
✅ Breaks back above 118.6K with volume → Targets: 122.4K, 126.7K, 128.7K (channel continuation).
❌ Rejection at resistance → Eyes on 114.9K. Losing that, and we enter danger territory toward 106K.
We’re at a decision point — and these are the moments that shape the next leg.
One Love,
The FXPROFESSOR 💙
Disclosure: I am happy to be part of the Trade Nation's Influencer program and receive a monthly fee for using their TradingView charts in my analysis. Awesome broker, where the trader really comes first! 🌟🤝📈

I am starting to think TradingView is Haunted. Anyways... ZM🎯 BOATS:ZM Gap Fill Setup – Targeting $84.53 by Week of 7/22
Zoom (ZM) may be setting up for a bullish gap-fill retracement off strong confluence support near $73.81. After a full fib retrace to the 0.5–0.618 zone, the current candle structure shows potential for a reversal toward the unfilled gap at $84.53.
🧠 VolanX Thesis:
✅ 0.5 Fib from March–May rally holding firm
✅ Gap from early June remains unfilled
✅ Bullish reversal candle forming at support
⚠️ Volume drying up on downside = potential exhaustion
🎯 Fib Levels to Watch:
🔹 0.618 = $77.27 (resistance → reclaim zone)
🔹 Gap Fill = $84.53
🔹 1.236 / 1.618 = $89.68 / $92.60 (momentum extension zones)
📈 Trade Idea (Illustrative):
plaintext
Copy
Edit
Entry: $74.50
Stop: $71.90
Target 1: $84.53 (gap fill)
Target 2: $89.60 (Fibonacci extension)
Gap fills often occur within 3–7 trading days when supported by fib reversal structure + buyer absorption.
Not Fin Advice! TY
📌 #ZM #Zoom #VolanXProtocol #GapFill #SmartMoneyConcepts #FibRetracement #DailySetup #WaverVanir #BreakoutTrading #TradingView

SEI — Breakout & D1 OB Target1. Support 0.33–0.36 holding
2. Entry after SR breakout
3. Target: D1 OB 0.47–0.54
4. Stop below 0.33

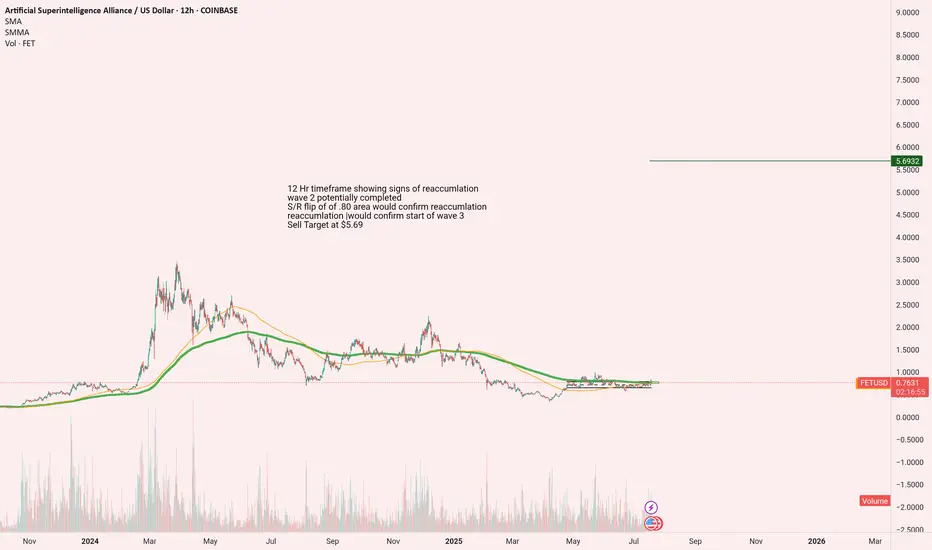
LONG FET - Reaccumlation IMO12 Hr timeframe showing signs of reaccumlation
Wave 2 potentially completed
S/R flip of of .80 area would confirm reaccumlation
reaccumlation would confirm start of wave 3
Sell Target at $5.69 if 0.80 area is flipped to support
Inside day on MondayThe structure in the daily S&P 500 chart implies an inside day for Monday. It indicates a loss of momentum and is potentially bearish.

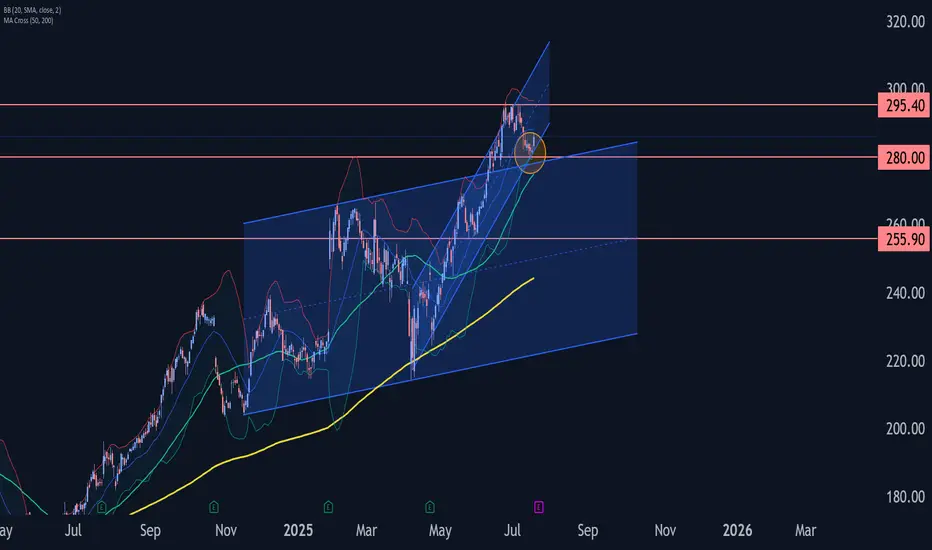
IBM Wave Analysis – 18 July 2025
- IBM reversed from support zone
- Likely to rise to resistance 295.40
IBM recently reversed up from the support zone between the support level 280.00, upper trendline of the recently broken weekly up channel from 2024 and the support trendline of the more recent up channel from April.
This support zone was further strengthened by the lower daily Bollinger Band and by the 38.2% Fibonacci correction of the sharp upward impulse from May.
Given the clear daily uptrend and the oversold daily Stochastic, IBM can be expected to rise further to the next resistance 295.40 (which stopped the previous waves 3 and (b)).
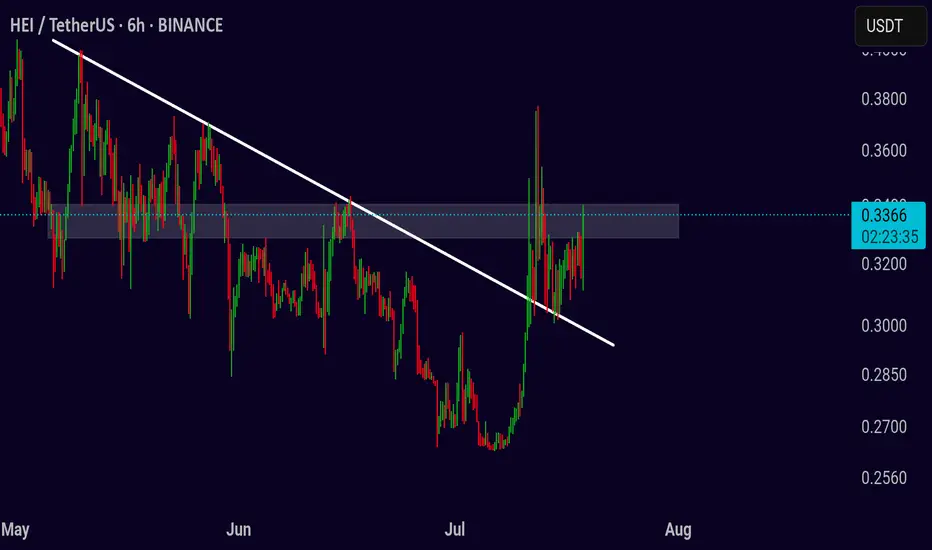
Breakout Strategy for HEI/USDT: Key Resistance TestedBreakout Strategy for HEI/USDT: Key Resistance Tested
The HEI/USDT chart is currently consolidating under a clear descending trendline, signaling a potential breakout. As price approaches this key resistance, the market is poised for a critical move. Will HEI break higher or continue lower? Let’s break down the potential scenarios.
Bullish Breakout Opportunity
If the price breaks above the 0.3500 resistance level, it could trigger a bullish breakout. A strong move above this resistance would signal increased buying momentum, with target levels at 0.3700, 0.4000, and possibly even 0.4400. Placing a stop loss just below 0.3200 will help protect against a failed breakout. Always monitor volume during the breakout, as an increase in volume confirms the strength of the move and validates the breakout.
Bearish Breakdown Risk
If the price fails to break above 0.3500 and drops below the 0.3200 support, it could signal a bearish breakdown. In this case, shorting the market may be considered, with target levels around 0.3100 and 0.2900. A stop loss just above 0.3350 will provide a safety net. Again, volume plays a key role—low volume on the breakdown may indicate a false move, so keep an eye on it.
Pro Tip
Volume is the most reliable indicator to validate the strength of both breakouts and breakdowns. A surge in volume during either move adds confidence to your trade. Make sure to manage your risk with well-placed stop losses and adjust your position size according to the market conditions.
Focus on price action, and be prepared to act quickly as HEI/USDT nears its breakout point. Whether the price breaks higher or lower, this strategy will help you stay ready for either outcome.
DOGE–USDT: Consolidation in Play, Eyes on Next Big Breakout 🐶🚀 DOGE–USDT: Consolidation in Play, Eyes on Next Big Breakout 📊✨
DOGE has been riding a powerful channel, recently tagging the upper channel resistance around $0.254 before consolidating. Here's the current roadmap:
🔎 Key Levels & Structure
Upper Channel Resistance: Approx. $0.254
Intermediate Resistance: $0.2466
✅ Support Zone to Watch: $0.2166
🔽 Deeper Support: $0.1843
Until DOGE decisively breaks channel resistance at $0.254, we expect a period of choppy action within the funnel. That’s where planning entries and exits matters most.
🎯 Breakout Targets
A clean breakout above $0.254–0.2466 with volume could trigger a new leg.
A fresh high-target projection lands around $0.32, with even higher potential if momentum rockets.
Remember: structure always guides — from support → breakout → next peak.
🧠 Educational Takeaway
We're trading based on the levels, not hoping for a miracle.
Enter near the channel floor, manage risk between support levels.
Wait for confirmation at resistance breakout — momentum is your friend.
This disciplined, technical approach is what separates real traders from dreamers.
One Love,
The FXPROFESSOR 💙
Disclosure:
I am happy to be part of the Trade Nation's Influencer program and receive a monthly fee for using their TradingView charts in my analysis. Awesome broker, where the trader really comes first! 🌟🤝📈
“Technical analysis? Yeah… even Doge respects the lines.” 📈
— Elon Musk, probably 🐶🚀
Elon’s take (my dog) : “Technical analysis? Yeah… even Doge respects the lines.”
It’s a cheeky way to remind everyone: success isn’t luck. It’s levels. Discipline. Watching the structure. 📊
Next steps:
🟢 Aim for $0.254 breakout — momentum could push us towards $0.32+
🟡 Manage risk around support zones — respect them, or be caught offside
This isn’t just meme money — it’s structured momentum. For traders, that matters more than hype.
One Love,
The FXPROFESSOR 💙

OP Eyes 1.33 – New Entry in Play After awesome last trade🎯🚀 OP Eyes 1.33 – New Entry in Play After 1,744% Leveraged Play 📈🔥
Fresh off the last OP move, where we caught a 75x long from $0.6380 to $0.7864 — netting +1744% — we’re not slowing down. It's time for the next phase. 📊
✅ My New Trade Setup:
📌 Last Entry: $0.6380
📈 Current Price: $0.7864
💡 New Entry Zone: Around $0.73–0.74
🔓 Big Breakout Level: $0.884
Once we break and close above $0.884, the next target opens up cleanly:
🎯 $1.33 – technically projected from prior range extensions.
🔍 Support Levels:
First Support: $0.7300
Deeper Support: $0.6900
These levels are key to reloading and protecting capital. If price respects the zone, we attack again. If not, we wait. That’s trading. 💼
This post is educational — it’s about knowing the levels, understanding the flow, and avoiding emotional trading. 🧠
We don’t blindly chase breakouts. We prepare, we watch, and we execute when structure confirms. The difference between pros and gamblers is simple: discipline and levels. 📐📉📈
Let’s see how OP performs at this pivot.
One Love,
The FXPROFESSOR 💙

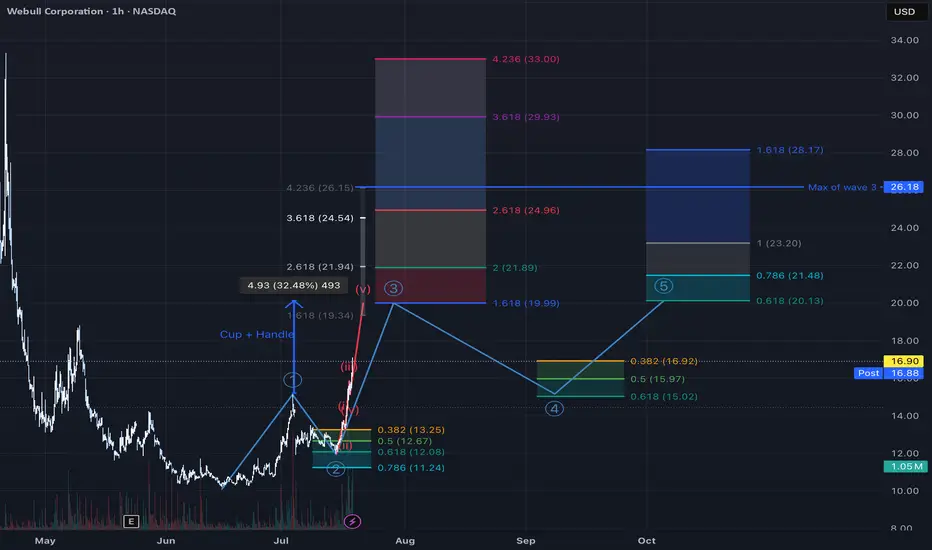
Conservative target zone estimationNASDAQ:BULL my first target zone estimation using elliot wave theory. Obviously, I tried to focus on the most conservative alternative.
Due to the additional cup and handle pattern i am pretty confident that wave 3 reaches at least $20 within the next few days.