USDT + USDC Dominance🦇 Bearish Bat Pattern Forming :
A potential Bearish Bat is developing, with price nearing the final zone where reversals typically occur — the Potential Reversal Zone (PRZ).
What to watch:
🔻 If the pattern completes and gets rejected in the PRZ:
That could signal a shift away from stables and back into riskier assets — a bullish sign for altcoins and the broader crypto market.
🔼 If price breaks through the PRZ:
The pattern fails. That would point to continued risk-off behavior — more capital flowing into stables and away from alts.
🧠 Pattern isn't confirmed yet — the key move is still ahead. Watch price closely as it enters the PRZ. The reaction there will shape the next major trend.
Chart Patterns

Third Quarter 2025 Nigerian share picks Update....Percentage Up!Here's a summary and update on the third quarter 2025 Nigeria stock picks based on the price comparison between July and August - 1month:
Q3 2025 Trading View: Nigerian Stock Picks Update
Strong Performers with Significant Gains:
BUACEMENT: Up 48%, showing strong momentum as a cement sector leader.
DANGSUGAR: Increased by nearly 37%, notable growth in the sugar sector.
ELLAHLAKES: Shares rose over 36%, a promising performer.
DANGCEM: Cement stock up about 20%, continuing solid growth.
ETRANZACT: Up 24%, showing steady improvement in the tech/payment sector.
MULTIVERSE: Grew by 24%, indicating healthy gains in diversified tech.
NB: +28.8%, good growth for the banking/finance sector.
Moderate or no Growth:
ARADEL: Small increase of about 1%, steady but minimal movement.
HMCALL: Stable with a minor 1.4% increase, remaining consistent.
TRANSPOWER: No price change, holding steady for now.
Overall Market Sentiment:
Average gain across all picks is approximately +22%, a strong positive trend overall.
Indicates a bullish sentiment on these carefully selected third-quarter stocks.
Opportunity exists to take advantage of higher momentum sectors like cement, sugar, and tech/payment companies.
Trading Takeaway:
The Q3 2025 picks demonstrate robust growth potential, especially in key sectors like construction materials and tech/payments. Conservative performers provide portfolio stability while high growth stocks offer upside. Continual monitoring for volume and market news is recommended to capitalize on gains and manage risks moving forward.

Bullish Momentum Ahead? XAAUSD Price to Watch!The market just closed above 3,353 , which is our BOS and RBS level. It was previously a resistance, then became support, and now it's being tested as resistance again. Looking at how gold moved last week, it came really close to the major resistance area I had marked. Unfortunately, it didn’t quite reach my pending order, which was set just a bit lower.
After reviewing the price action, I noticed that gold reacted to an order block before making its move upward. Luckily, we managed to catch a nice HnS sell setup & the golden zone fibo I had marked earlier, using my trusted golden Fibonacci levels. They’ve consistently delivered reliable entries.
Looking ahead to the upcoming week, I’ll be using the same golden fibo setup. The market is showing a clean pattern, and I’ve already mapped out a solid entry zone. The zone is fairly wide, but with proper risk management and entry layering, there’s definitely good potential for profit .
Let’s see how things play out next week. That’s all from me for now. If you found this helpful, feel free to like and follow for more analysis.

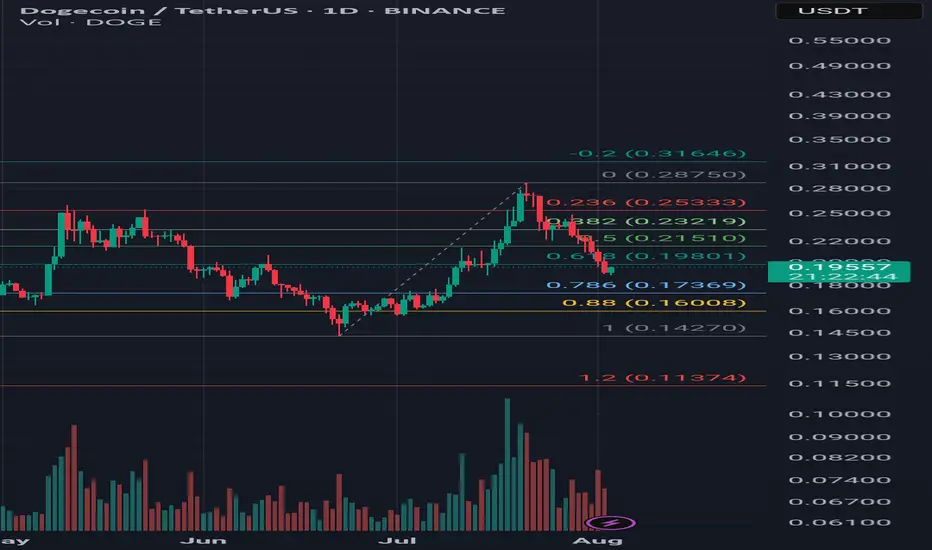
DOGE/USDT Trade Idea – Potential Cup & Handle Pattern Timeframe: Technical Analysis:
Price rallied from 0.142 to 0.287 and is currently forming the handle of a potential cup & handle pattern.
Price is sitting at the key 0.618 Fibonacci retracement level (0.198 USDT).
If this support holds and price breaks above resistance levels with strong volume, the cup & handle pattern may activate.
---
🎯 Targets:
1. First resistance: 0.215 USDT (50% Fib)
2. Second resistance: 0.232 USDT (38% Fib)
3. Key breakout level: 0.287 USDT
4. Classic pattern target: 0.432 USDT
---
🛡 Stop Loss:
Below 0.170 USDT (slightly under the 0.786 Fib & handle bottom)
---
✅ Entry Confirmation Criteria:
1. Hold above 0.198 support
2. Break and close above 0.215
3. Breakout above 0.287 with strong volume
---
💡 This analysis is for educational purposes only and is not financial advice. Always use proper risk management.
MAGIC : Magic is neededHello friends🙌
📈Given the good rise we had, the price is now in the ascending channel, now in the specified support areas, you can buy in steps with risk and capital management and move to the specified targets.
🔥Follow us for more signals🔥
*Trade safely with us*

GOLD 1H: Fibo speaks louder than words - $3365 in focusGold is testing the upper zone near $3362–3365, which is just above the 0.5 Fibonacci level ($3353) from the previous impulse. The price has already bounced from the top of the channel, indicating potential exhaustion of the current upward move.
Technicals:
- MA50 and MA200 are below the price — bullish trend intact
- RSI is cooling down from overbought territory
- Fibo 0.5 ($3353) was breached, but no clear confirmation yet
- Channel resistance remains unbroken
Plan:
- If price rejects $3365, targets are $3340 and $3314
- If price holds above $3365, next move could be toward $3377+
- EMA structure supports further upside, but caution is needed at this zone
Gold isn’t shouting - it’s whispering key levels. Listen closely.

BTC PERPETUAL TRADE ,Short from $113,700
BTC PERPETUAL TRADE
SELL SETUP
Short from $113,700
Currently $113,700
Stoploss $116,800
Targeting $111,600 or Down
(Trading plan BTC go up to $115K
will add more shorts)
Follow the notes for updates
In the event of an early exit,
this analysis will be updated.
Its not a Financial advice

EUR-USD Will Fall! Sell!
Hello,Traders!
EUR-USD will hit the
Horizontal resistance of 1.1620
On Monday after making a
Powerful move up on Friday
And as the pair is locally
Overbought a local bearish
Correction is to be expected
Sell!
Comment and subscribe to help us grow!
Check out other forecasts below too!
Disclosure: I am part of Trade Nation's Influencer program and receive a monthly fee for using their TradingView charts in my analysis.

OMNI : Will it happen again?Hello friends🙌
✅As you can see, everything is clearly and explicitly drawn for you.
✅Just pay attention to risk and capital management for trading and if you like, support us.
🔥Follow us for more signals🔥
*Trade safely with us*

The Great Trap: How Billionaires Are Winning, and You're Not!The Great Crypto Trap: How Billionaires Are Winning—And You're Not
The ETFs, Saylor, and all of Trump's billionaire friends are getting richer—thanks to crypto.
Meanwhile, most retail traders are just trying to stay above water. Leverage trades are wiped out, charts feel rigged, and the market makes you feel like you're swimming against a riptide.
Why?
Because these rich guys have a plan: manipulate you and take your money. That’s how they stay rich.
Understanding their strategy is the first step to stop being their exit liquidity.
🧠 The New Battlefield
Crypto is no longer a playground for cypherpunks and tech rebels. It’s fully institutional now. We're not just trading against whales—we're fighting the same entities that own the media, control Wall Street, and write the rules.
So forget the old ways of thinking. The tables have turned.
🗓 The Sunday Rekt Routine
To maximize destruction, they need to avoid friendly fire. So they pump on the weekend when retail is free and optimistic, then dump on Monday to close the CME gap—like clockwork.
The playbook:
Weekend: Pump. Trap your long.
Monday: Dump. “Fill the gap.” Liquidate everyone.
Response:
Don’t fall for weekend FOMO. Exit Sunday afternoon. Wait until Tuesday to re-enter, once Monday’s high and low are set. Trade smart, not emotional.
📈 Top-of-the-Market FOMO
You’ve seen it before. Just before the crash, the media frenzy begins. Influencers say “Don’t miss this pump!” or “99% will miss the next big move!” The ETF gods hint at new inflows. It's a setup.
They're not hyping it for your benefit—they're offloading their bags in your face.
Just look at the charts:
BlackRock bought billions to drive BTC to 121K.
Then, in 72 hours, they dumped billions.
Saylor? Silent. No new buys. That’s not coincidence—it’s coordination.
Response:
Check the MACD, RSI, and Stochastic RSI on daily or weekly timeframes. If they're maxed out and the influencers are screaming green—it’s probably too late.
When they stop buying, the dump is already planned.
🧰 How to Outsmart Them
Watch the MACD for crossovers and divergence.
Monitor RSI zones—don’t long into extreme overbought conditions.
Use Stoch RSI to anticipate momentum shifts.
Rule: When everything is overheated, and FOMO is peaking—step back. Let them dump into each other. You’ll get your entry later, cleaner and cheaper.
⚔️ This Is War
Make no mistake: this is a war for your money.
They want yours. You want theirs.
Only the smart survive.
To be continued.
DYOR.

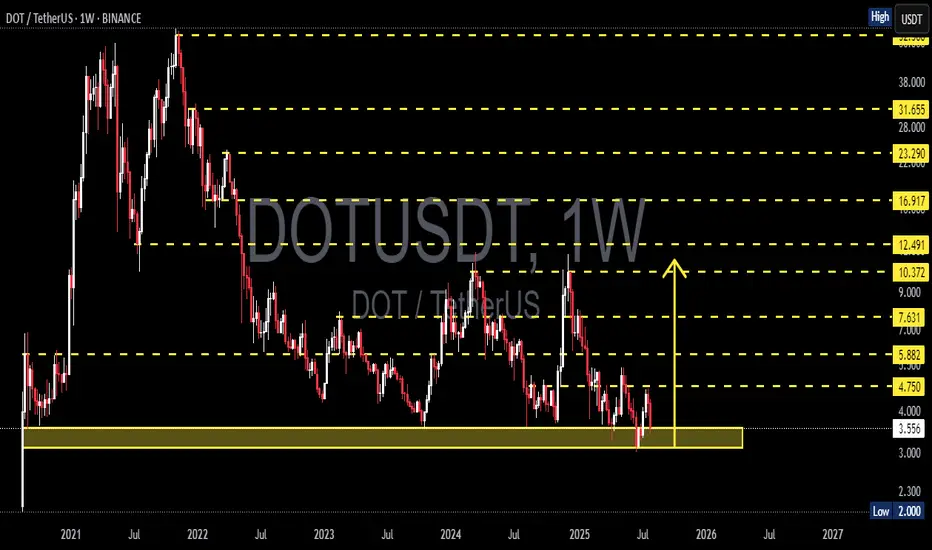
DOTUSDT On the Edge of a Major Rebound or a Devastating BreakdowPolkadot (DOT) is once again retesting one of its strongest macro support zones between $4.00 – $3.55, a historically significant demand area that has provided major price bounces since mid-2022.
This isn’t just a random level—it’s a critical accumulation base where large buyers have consistently shown interest. With price now hovering around this zone again, the next move could be decisive for DOT's mid- to long-term trend.
---
🔍 Price Structure & Key Patterns
Extended Accumulation Phase: DOT has been trading in a sideways range for over 80 weeks, indicating a potential bottoming structure forming after a prolonged downtrend.
Strong Historical Demand: The $4.00 – $3.55 region has acted as a key support multiple times since 2022, reinforcing its importance as a make-or-break zone.
Potential Trap Setup: Current price action could be forming either a bull trap or bear trap, depending on whether price rebounds or breaks down. Weekly candle confirmation will be key.
---
🟢 Bullish Scenario (Upside Reversal)
If price holds and prints a strong bullish candle (e.g., bullish engulfing or long-tailed hammer), expect the following upside targets:
Short-term: $4.75 – $5.88
Mid-term: $7.63 – $9.00
Long-term: $10.37 – $12.49, aligning with prior distribution zones
✅ A breakout from this long accumulation base could trigger a massive short squeeze and renewed buying momentum.
---
🔴 Bearish Scenario (Breakdown)
If DOT closes below $3.55 on the weekly chart:
Confirms breakdown from macro support
Opens downside risk toward $2.30 – $2.00
Would print a new lower low, extending the bear market phase and potentially triggering capitulation
⚠️ Speculative long positions should include tight risk management below $3.50.
---
🧠 Market Sentiment & Strategy
DOT appears to be in a "Capitulation meets Hope" phase—selling pressure is exhausting, but bullish conviction hasn't yet taken control.
Ideal entry zones lie within the current demand range, with tight stops.
Watch for a daily breakout or bullish momentum confirmation next week before committing to positions.
---
📌 Final Takeaway
> DOT is standing at the edge of a cliff—or a launchpad. The $3.55–$4.00 zone has repeatedly been the foundation for rebounds. If history repeats, this may be the beginning of a new uptrend. If not—brace for deeper downside.
⏳ The market is watching. Will DOT break out… or break down?
#DOTUSDT #Polkadot #CryptoTechnicalAnalysis #SupportResistance #CryptoRebound #BearishOrBullish #AltcoinOutlook #CryptoBreakdown #WeeklyChart #AccumulationZone #DOTAnalysis
Sell gbpusdOur last selling idea already running 400+ pips in sell
Now market structure clear for sellers
Daily trend broken making lower lows and lower high
In our view we more looking sell
Monthly selling engulfed
More sell side minimum 600+ pips

EPIC : Risky signal...Hello friends🙌
🔊Due to the good price growth, we have found important support points for you.
Now, due to the price correction, we have found buy points for you and you can buy with risk and capital management and move with it until the goals we have set for you.
🔥Follow us for more signals🔥
*Trade safely with us*

BTC HUGE DROP TO 113,400$ - BIG CRASH !*Sorry for posting to late as I am between a trip in Malaysia.*
Details:
Entry: Now - 117,000 $
Target Price: 113,410 $
Stop loss: 119,460 $
Trade Ideas:
Market creating a flag pattern here. Though its not only the logic we have some secret logics here and indicators which I shared in the VIP.
What is required to Join VIP?
- Nothing just you have to share 10% of your profit with us at the end of the month which you earned from our signals. Yeah this is just the requirement, trade where ever you like your favorite broker or else you don't need to pay fees first or create account thru our link.
Trade Signal:
I provide trade signals here so follow my account and you can check my previous analysis regarding BITCOIN. So don't miss trade opportunity so follow must.
BINANCE:BTCUSDT BINANCE:BTCUSDT.P BINANCE:BTCUSD

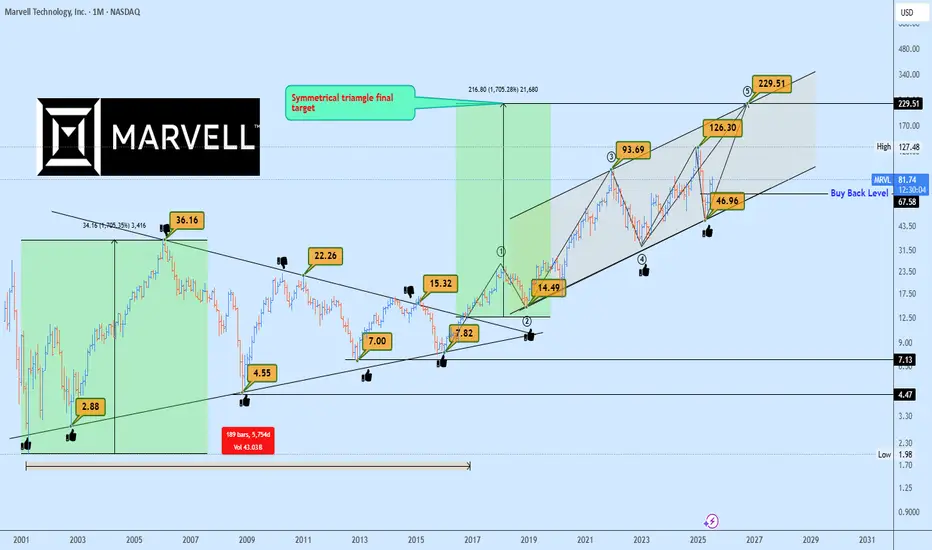
MRVL Massive 15-Years Symmetrical Breakout Targets AheadMarvell Technology (MRVL) has just completed a monumental breakout from a 15-years symmetrical triangle, a rare and powerful long-term accumulation structure. This type of macro consolidation typically precedes a major directional expansion, and in this case, the breakout confirmed bullish continuation.
Currently, MRVL is forming a rising channel structure, with price bouncing cleanly from the lower boundary confirming demand and the continuation phase of the macro move.
The 1:1 projection from the symmetrical triangle gives us a clear target trajectory, with the final leg potentially extending to $229, aligning perfectly with the upper boundary of the rising channel.
In the short to mid-term, the ideal buyback opportunity rests near $67.50, should the market retest previous breakout support or the lower boundary of the channel once more. This zone offers asymmetric risk-to-reward potential for long-term investors and swing traders alike.
Key Targets
📈 $67.50 – Buyback Opportunity Zone
📈 $229 – Rising Channel Top / 1:1 Expansion Target
A breakout this large is no coincidence, it’s backed by years of price compression and institutional positioning. Now is the time to watch closely.
📩 Drop your view in the comments and share your stock requests for quick analysis.
Only stock assets will be accepted under this post.
CFX Bulls Eyeing 38% Surge Toward Explosive 0.29 TargetHello✌
Let’s analyze Conflux’s upcoming price potential 📈.
BINANCE:CFXUSDT has shown solid bullish momentum recently, supported by a series of positive fundamental catalysts 📈. Price is now approaching a daily support zone that also aligns with a key Fibonacci retracement level. If this level holds, I’m expecting a potential move of around 38% to the upside, with a mid-term target near 0.29 . Watching closely for price action confirmation around support before considering entry 🚀.
✨We put love into every post!
Your support inspires us 💛 Drop a comment we’d love to hear from you! Thanks , Mad Whale

BTC Bear Divs5 hidden bear Divs on yesterdays daily. 2 wicks on the 50MA. If the engulfing holds, nice setup for a reversal with a target of 130 +/- by EO August.

EUR/USD: Risk OnEUR/USD Daily Setup: Riding Risk-Off into the 1.1050 Zone
Chart: Daily (showing 0.146–161.8% Fib extensions, supply/demand zones, trendline)
Analysis & Plan:
Macro Drivers: Fed/ECB rate divergence and yield spread keep USD bid; risk-off bias intact.
Key Levels:
Supply (short zone): 1.1636–1.1750
Invalidation: Daily close above 1.1800
Demand Targets:
1.1278 (100% Fib ext)
1.1056 (161.8% Fib ext + demand confluence)
1.0521 (“strong low” area)
Trigger:
Risk-On Break: Watch for rejection at 1.1589–1.1636; failure confirms fresh sell signal.
Trade Execution:
Enter Short near 1.1589–1.1636 on bearish price action / daily close below 20-day MA.
Stop-Loss: Above 1.1800 supply high.
Take Profits: Scale out at 1.1278, then final at 1.1056.
Rationale: Aligns Fibonacci confluence zones with macro USD strength and trendline support breaks.
Tags:
#EURUSD #Forex #Fibonacci #SupplyDemand #TechnicalAnalysis #TradingVie

ETH/USD – Critical Reversal Zone?
### 🚀 ETH/USD – Critical Reversal Zone?
**🔍 ETH Futures Multi-Model Signal | Consensus: LONG | Confidence: 77%**
---
**🧠 Key Highlights (DS + OA Model Consensus):**
* **Price:** \$3,375 → Trading *below* EMA9/SMA20 = short-term bearish, but hitting strong **support zone**
* **Support:** \$3,248 (Bollinger Lower) & \$2,987 (SMA50)
* **Resistance:** \$3,487 (EMA21), \$3,620 (SMA20)
* **Volume:** -10.3% (5D) → Selling **weakening**
* **RSI:** 49.5 → Neutral but oversold on short-term
* **MACD:** Bearish crossover, but showing **divergence**
* **Volatility:** Bollinger width 9.18% = **Breakout Setup**
---
### 📈 Trade Setup – Conditional LONG
| Entry | Stop Loss | Target | R/R | Confidence |
| ------- | --------- | ------- | ------ | ---------- |
| \$3,375 | \$3,229 | \$3,690 | 1:3.24 | 77% ✅ |
🪙 **Trade Type:** Scale-in (50% @ \$3,375, 50% @ \$3,275)
📊 **Take Profits:**
* TP1: \$3,485 (EMA21)
* TP2: \$3,590 (SMA20)
* TP3: \$3,690 (Weekly VWAP Anchor)
---
### ⚠️ Risk Dashboard
* 🚨 BTC < \$58K → Setup invalid
* 📉 No Open Interest Data – monitor liquidation triggers
* 🧠 Max Position Risk: **1.25%** | Use hard stop-loss
* ⏰ Entry Timing: **London Open (8:00 GMT)**
---
### 💬 TL;DR
ETH is sitting in a **high-confluence reversal zone**. Weak sell volume, macro bullish trend, and volatility contraction signal a potential bounce. 📊 **Risk-defined long** setup favored by both models.
🧠 “Smart money doesn’t chase — it positions early.”
---
📌 **#ETH #CryptoTrading #ETHUSDT #Futures #BreakoutSetup #BollingerBands #MACD #RSI #DeFi #Ethereum #CryptoSignals #TradingView**


XAUUSD Possibility of a small correction towards 3330, re-entering the bearish phase and moving towards the specified targets

LIVE TRADEHello friends🙌
Given the good trend we had, now that we have had a price correction, we can enter the trade with risk and capital management and move towards the specified goals.
🔥Follow us for more signals🔥
*Trade safely with us*
Mid-Term Analysis on Gold (XAUUSD) (Weekly Chart)In this post I have laid out the two main Smart Wave Counts and scenarios for this pair. Note that the invalidation levels are to be monitored for confirmation of the counter cases.
