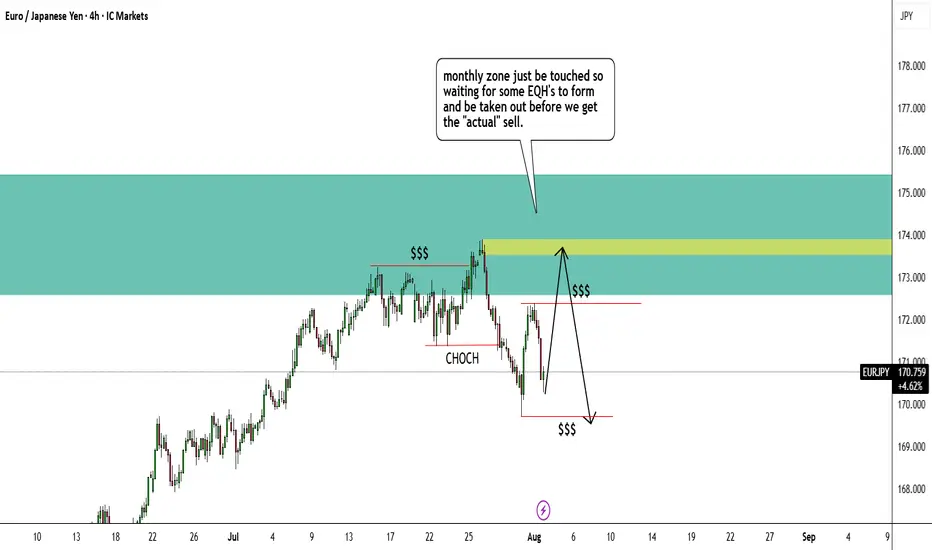
EURJPY shortsHello everyone
I got a EURJPY short trade coming up soon.
Reason being is that price came back to the monthly supply zone (blue)
Price than made a EQH zone which got taken out and created a CHOCH.
Price is now consolidating and has formed EQL and EQH but i believe price will break EQH first to come back to 4hr supply zone (yellow).
Some news is also coming out as well which could influence price as well
Chart Patterns
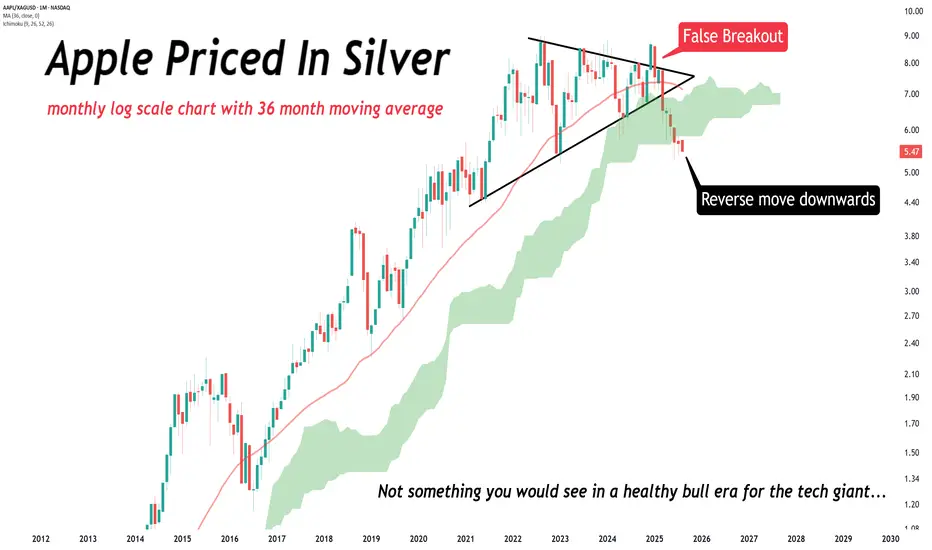
Since December, Apple LOST 37% of its value (priced in silver).Since December, Apple LOST 37% of its value (priced in silver).
You should NOT be seeing this happen in a bull era for the tech giant.
Huge breakout in Union Bank
After it's Q1 results Union bank is trading near it's previous breakout level, and is ready for a huge upside from here.
If we look at the past trends of Union Bank ( See below Images )
We can clearly see after a correction of about 40 to 50%, share rises with a huge breakout and it always rises for more than 100%.
Whoever missed the opportunity at first, this is the best to get into the stock for a potential profit target of 250.

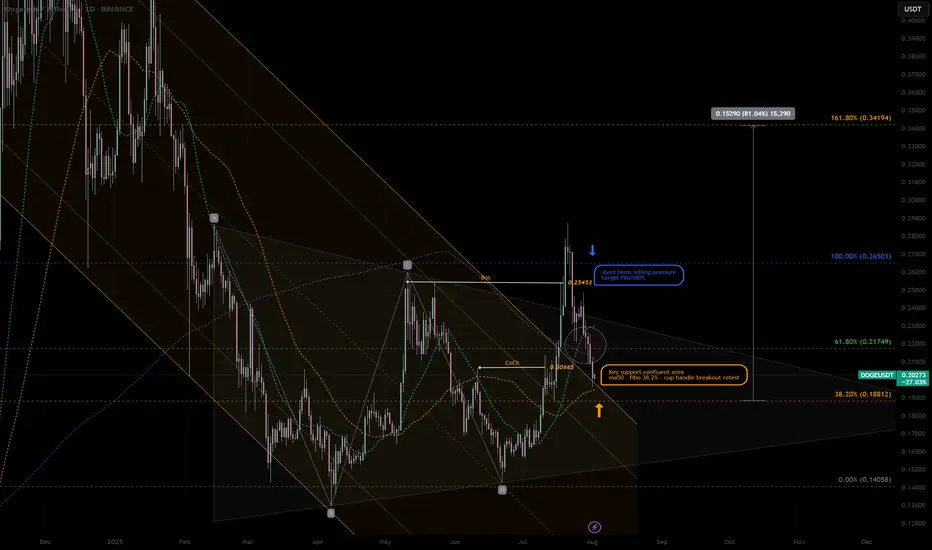
DOGEUSDT|Pullback Confluent Support -cup&handle next ext. +80%DOGE - retraced at the confluent support zone, high potential pullback buy position:
- SMA50 Dynamic support—often attracts mean-reversion buys.
- cup & handle support retest Price retested prior breakout zone—flips resistance to support.
- key 38% Fib “sweet spot” pullback level after corrective moves.
- Previous Change of Character marks shift from bearish to bullish structure—support confluence.
Potential Entry & Risk Management
Entry Zone
- Aggressive: immediate handle breakout support
- Conservative: Wait for liquidity pattern and re-bounce confirmation candle above SMA50
Stop-Loss
-Below Cup Handle low -10% larger position prior swing high RR:2.5/1
-Suggested SL: previous low -0.17 USDT - 5% below entry
Initial Targets
-Key resistance 61.8% Fib retracement — 0.217 USD
-100% Prior swing high — 0.26 USD
-162% Next extended target - 0.35 USD
Trade Rationale
-Mean-reversion into SMA50 and Fib 38.2% zone aligns multiple buyers.
-Pattern support: Cup & handle retest confirms breakout strength.
-Structure flip: CoCh zone indicates bullish regime shift.
Watch-Outs
-Rejection below 0.188 USD erodes support cluster—invalidates setup.
-Rising volume on bounce is crucial—low-volume lifts often fail.
-Beware broader market sell-offs impacting altcoins.
Next Steps:
-Monitor 4-hour candlestick close inside entry zone.
-Check volume spike on reversal candle.
-Adjust risk dynamically if price gravitates toward upper channel resistance.
Always trade with affordable risk and respect your stop..
ETHUSD Break- Test- GO!!! Nothing Changed! 3rd EditionI have been warning about this for some time. Please visit my previous two posts for more info and updates.
Magic!
Click boost, follow, and subscribe for more. Let's get to 5,000 followers ))

GOLD TRADING PLAN – Triangle Squeeze, All Eyes on NFP【XAU/USD】GOLD TRADING PLAN – Triangle Squeeze, All Eyes on NFP
Gold continues to trade within a large symmetrical triangle, tightening toward the end of its range. However, current candle structure shows clear bullish momentum, indicating the potential for a strong upside breakout.
🔍 Today’s Key Focus: Non-Farm Payrolls (NFP)
Market expectations are pointing to weaker-than-expected US economic data, which could trigger strong FOMO-buying for gold if confirmed. A poor NFP report would likely weaken the USD, supporting bullish continuation.
🔑 Strategy and Key Technical Levels:
Watch for a confirmed breakout above the descending trendline to trigger Wave 3 of the bullish structure.
CP ZONE + OBS BUY ZONE triggered yesterday already yielded 160+ pips profit.
Strategy: Prefer buy-the-dip entries. SELL setups only valid on strong resistance rejection. Avoid counter-trend trades near breakout zones.
🟩 BUY ZONE:
Entry: 3276 – 3274
Stop Loss: 3270
Take Profits:
3280, 3284, 3290, 3294, 3300, 3305, 3310, 3320, 3330, 3340, 3350
🟥 SELL ZONE:
Entry: 3339 – 3341
Stop Loss: 3345
Take Profits:
3335, 3330, 3325, 3320, 3315, 3310, 3305

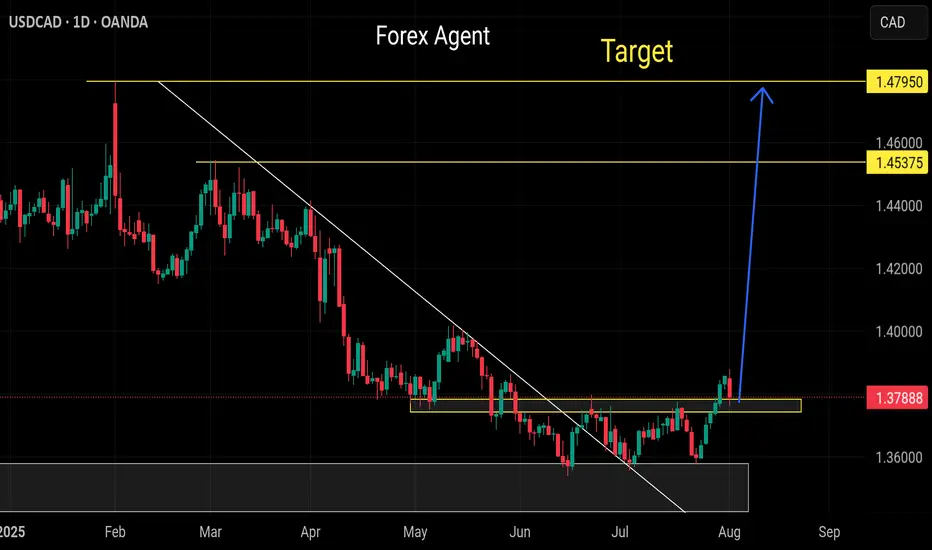
USD/CAD Daily - Triple Bottom Breakout PatternUSD/CAD Daily – Triple Bottom Breakout
The USD/CAD pair on the 1D chart has formed a Triple Bottom pattern, a classic bullish reversal setup after a downtrend. This pattern suggests that sellers were unable to push the price below the established support zone on three separate occasions, signaling strong buying interest.
🔍 Chart Highlights:
Three distinct lows at a consistent support level
Strong bounce after each test of support, confirming bullish defense
Neckline (resistance line) successfully broken, indicating a breakout
Price target projected from the height of the pattern added to the breakout level
📈 Pattern: Triple Bottom
📍 Breakout Level (Neckline): Around 1.37800
🎯 Target: Approx. 1.42000
🛑 Invalidation: A daily close back below the neckline
This breakout may indicate the beginning of a bullish trend continuation, with momentum favoring the bulls as long as price holds above the neckline.

HBAR Momentum Hbar has gained some momentum lately. This is the ideal rally setup.
It has also yet to see real price discovery past .5
Large trade already opened.
DYOR, I believe this coin has a ton of potential.
Hederas' Council consists of entities like Google, IBM, Boeing Through VentureX, Standard bank.. Just to name a few.
But you all don't care about that.

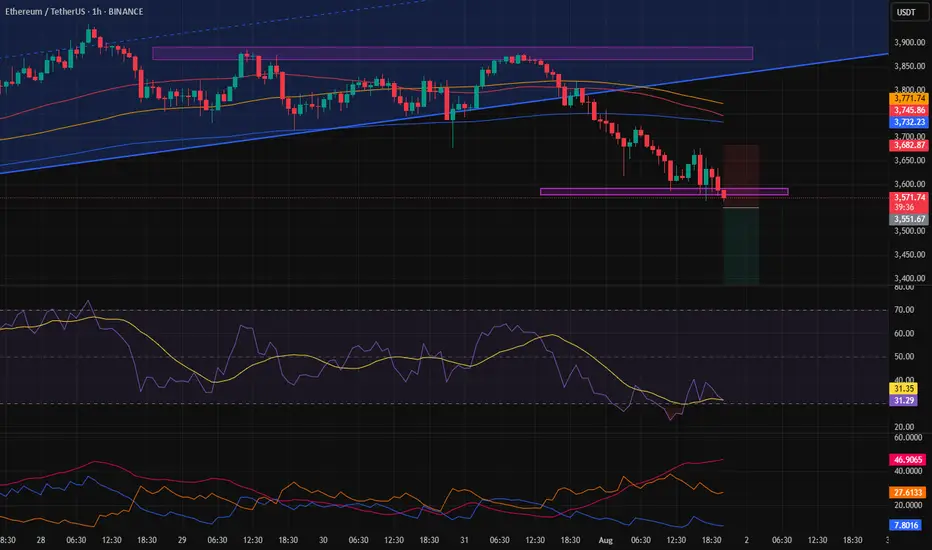
Possibility of Ethereum moving toward the \$3,330 price range.Considering the breakout of the 4-hour channel and confirmation of the downtrend, reaching the \$3,330 level is not out of the question.
This target was derived using a pattern-based projection from the channel breakout.
I’ve personally taken this position, but I’m not recommending it — just sharing for informational purposes.
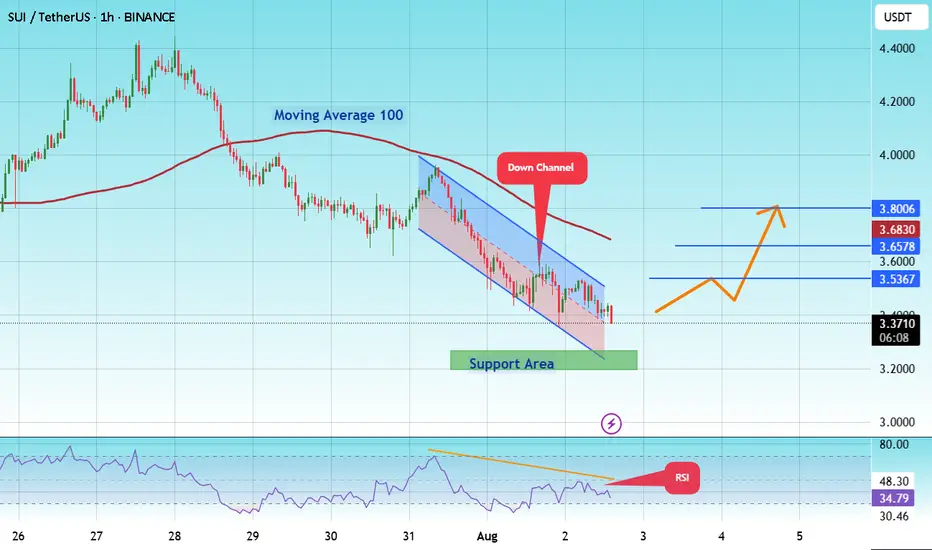
#SUI/USDT Update – Bounce Setup from Demand Zone?#SUI
The price is moving within a descending channel on the 1-hour frame and is expected to break and continue upward.
We have a trend to stabilize above the 100 moving average once again.
We have a downtrend on the RSI indicator that supports the upward break.
We have a support area at the lower boundary of the channel at 3.27, acting as strong support from which the price can rebound.
We have a major support area in green that pushed the price higher at 3.20.
Entry price: 3.38
First target: 3.58
Second target: 3.65
Third target: 3.80
To manage risk, don't forget stop loss and capital management.
When you reach the first target, save some profits and then change the stop order to an entry order.
For inquiries, please comment.
Thank you.
Bullish Momentum Ahead? XAAUSD Price to Watch!The market just closed above 3,353 , which is our BOS and RBS level. It was previously a resistance, then became support, and now it's being tested as resistance again. Looking at how gold moved last week, it came really close to the major resistance area I had marked. Unfortunately, it didn’t quite reach my pending order, which was set just a bit lower.
After reviewing the price action, I noticed that gold reacted to an order block before making its move upward. Luckily, we managed to catch a nice HnS sell setup & the golden zone fibo I had marked earlier, using my trusted golden Fibonacci levels. They’ve consistently delivered reliable entries.
Looking ahead to the upcoming week, I’ll be using the same golden fibo setup. The market is showing a clean pattern, and I’ve already mapped out a solid entry zone. The zone is fairly wide, but with proper risk management and entry layering, there’s definitely good potential for profit .
Let’s see how things play out next week. That’s all from me for now. If you found this helpful, feel free to like and follow for more analysis.

TONCOIN's Situation (4h) !!!The price is within an ascending triangle, which could be encouraging. However, since crypto doesn't always follow patterns, it might break down from below and correct to around $3.4
Best regards CobraVanguard.💚

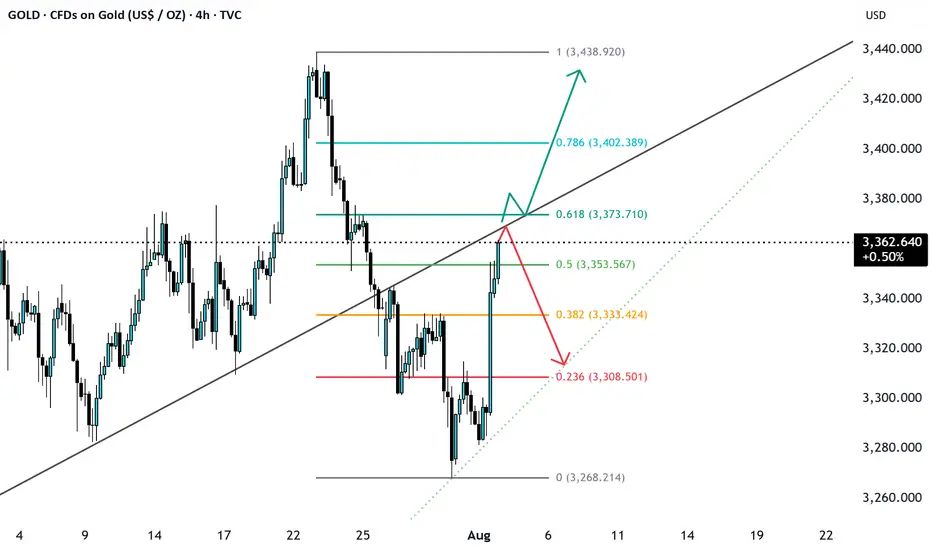
Gold at major resistance and at fib 0.618 level breakout ? Gold after breaking the support, now again reached the support level which will be its resistance now, will it break it or get rejected form here. Enter the long only on breakout and retest till then its bearish trend.
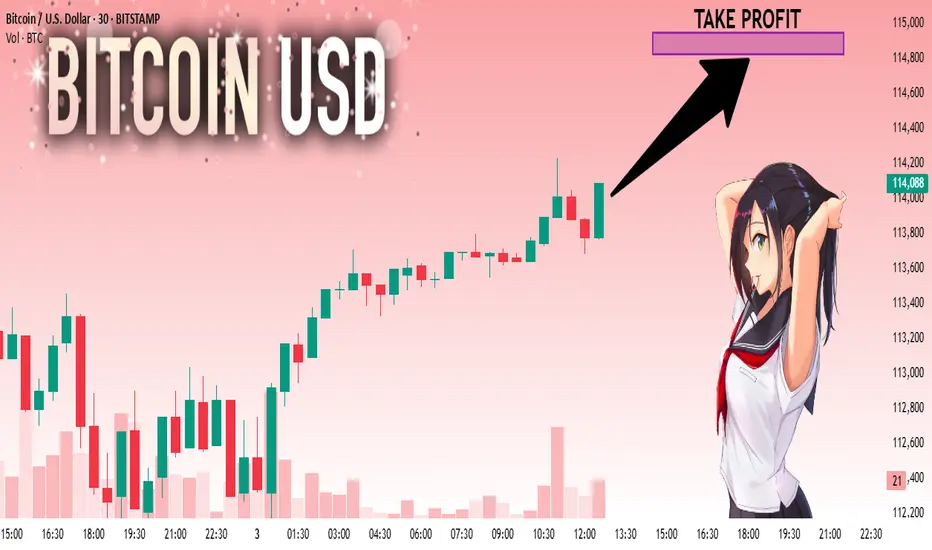
BTCUSD: Local Bullish Bias! Long!
My dear friends,
Today we will analyse BTCUSD together☺️
The market is at an inflection zone and price has now reached an area around 114,020 where previous reversals or breakouts have occurred.And a price reaction that we are seeing on multiple timeframes here could signal the next move up so we can enter on confirmation, and target the next key level of 114,821.Stop-loss is recommended beyond the inflection zone.
❤️Sending you lots of Love and Hugs❤️
Monthly Breakout.PPL Analysis
Closed at 181.78 (01-08-2025)
Monthly Breakout.
Extremely Bullish; potential to touch 240+
However, it should not break 128 now.
174 - 175 & then 165 - 167 seems to be a
Good Support level.

LIVE TRADEHello friends🙌
Given the good trend we had, now that we have had a price correction, we can enter the trade with risk and capital management and move towards the specified goals.
🔥Follow us for more signals🔥
*Trade safely with us*
BTCUSDBTCUSD is getting ready for upside towards 116K-117K.
Disclosure: We are part of Trade Nation's Influencer program and receive a monthly fee for using their TradingView charts in our analysis.

Gold Trend Reversal: MSS Completed Eyes on OB and Breaker Block!The gold market has executed a Market Structure Shift (MSS) in the New York session, indicating a trend reversal. Initially, the market made a Break of Structure (BoS) to the upside, but later dropped sharply and closed below the MSS level, confirming a bearish shift. Currently, the market is likely entering a retracement phase and may look to fill its Pending Demand (PD) arrays.
There are two critical levels from which the market could potentially drop again:
1. The first is an Order Block (OB).
2. The second is a Breaker Block (BB).
Keep a close watch on these two levels. If the market returns to either and presents bearish confirmation signals, it could resume the downward move towards swing lows.
Do Your Own Research (DYOR).

Gold long: Completion of Cycle degree Wave 4Hello, in this video, I go through Gold Elliott Wave structure on a cycle level (again) before zooming in on the latest 5-waves structure that is Cycle level wave 4. I talk about using existing broken trendlines and how that allows me to determine the strength of a move when there are false breakouts, whether to the upside or the downside.
Lastly, I discuss on how to trade this on the short-term using lower timeframe and price action. Most importantly, where to set the stop and the rationale for it.
Good luck!

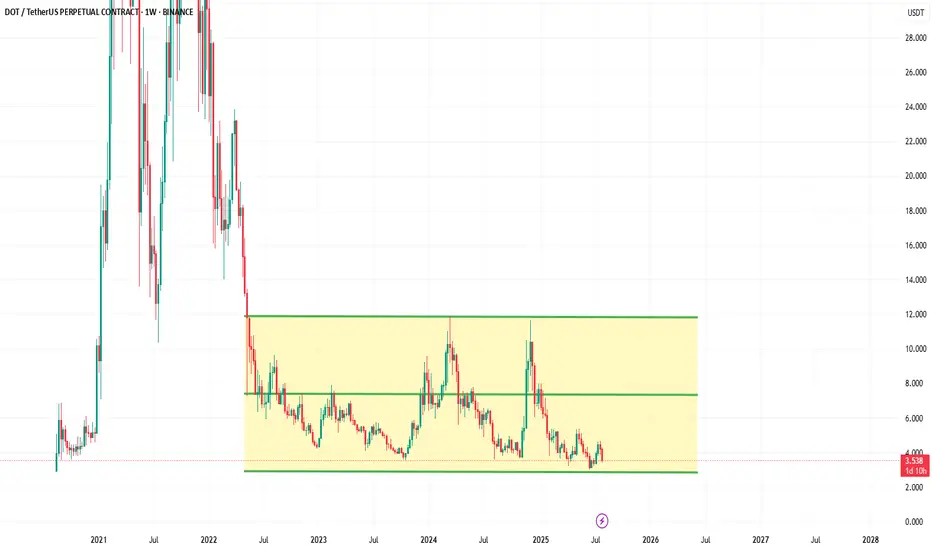
DOT is sitting at the bottom of the Weekly Channel💰 #DOT is sitting at the bottom of the Weekly Channel👀
Given the fact that market is in correction mode, it's literally the dip🔥
Target: 10$📈
GBPUSDGBPUSD needs a correction and a push up soon before any further drop.
Disclosure: We are part of Trade Nation's Influencer program and receive a monthly fee for using their TradingView charts in our analysis.

EURUSDEURUSD needs a correction and another push up this week.
Disclosure: We are part of Trade Nation's Influencer program and receive a monthly fee for using their TradingView charts in our analysis.

Strong buy usdcadOur last buying idea already running 200+ pips
More bullish correction expected
Daily down trend breaks
Respecting fresh support level
800+ pips minimum target