The price of gold is set to rise again!Gold is on the way hitting a record high since the global tension rising we can see gold creating another record high. Please note that it is a swing trades and may take weeks and months to hit the target or it may not even reach the target itself.
Chart Patterns

ETH Derivatives Indicate Bearish Sentiment
A closer look at Ethereum's derivatives landscape reveals growing caution in the market. The 25-delta risk reversals on ETH options for August and September are trading between -2% and -7%, signaling a rising demand for downside protection. In comparison, BTC's risk reversals sit at a milder -1% to -2.5%.
Futures data adds to the picture: ETH open interest is at $47.5B, but key exchanges like Bitget and Hyperliquid show significant drops in long/short ratios (-9.08% and -9.35%). Meanwhile, Binance maintains a relatively low long/short ratio at 0.39, reflecting increasing short interest.
Despite ETH’s impressive 48% rally in July, recent price action has weakened, down 6% in 24h. This divergence between spot price behavior and derivatives sentiment may point to an upcoming correction.
⚠️ Worth watching closely: A break below $3,500 could trigger a sharper unwind of bullish positioning.

XAUUSD Gold Trading Plan – Monday, 4th August 2025 (M30 TF)Strategy Type: Intraday Trend Trading (Buy-the-Dip)
Timeframe: 30-Minute (M30)
Market Bias: Bullish
Execution Style: Step-Ladder Scaling into Strength
🧠 Market Outlook
Gold remains in a bullish trend structure, supported by geopolitical risk, moderate inflation sentiment, and the weakening US Dollar. While Friday showed signs of short-term exhaustion, price is still forming higher lows on the 30-minute chart, suggesting intraday momentum remains to the upside.
Based on current price action and Fibonacci retracement levels, I expect a healthy pullback early Monday before a push towards new short-term highs. I will be trading in phases — buying on dips and scaling out at each resistance zone.
✅ Phase 1: Buy on Dip at 3352 (Key Support Zone)
Entry Zone: 3352
Reasoning:
3352 lines up with M30 demand zone (previous accumulation area)
61.8% Fibonacci retracement of the last M30 bullish swing
Likely to act as intraday support if price retraces from current levels
Confirmation:
Strong bullish candlestick reversal (e.g. bullish engulfing, hammer, or rejection wick) on M30
Volume uptick or bullish divergence on RSI preferred
Stop Loss:
Just below 3346 (below the last valid swing low to protect the trade)
🎯 Target 1: 3361
Why: This is the first intraday resistance and previous minor high on M30
Action:
Secure partial profits (~50%)
Move SL to breakeven or +5 pips to protect capital
Wait for next retracement
✅ Phase 2: Wait for Pullback After 3361
Retracement Zone: Expected dip to 3356–3358 area (new higher low)
Re-Entry Condition:
Retest of breakout level with strong bullish candle on M30
Maintain bullish market structure
🎯 Target 2: 3370
Why: This is the next resistance zone and price magnet based on Friday's volume profile
Action:
Secure additional 30% profit
Trail SL below structure (~3362)
✅ Phase 3: Wait for Final Dip Before Final Push
Retracement Zone: Around 3364–3366 (support flip area)
Re-Entry Condition:
Rejection of this zone with continuation pattern (bullish flag, ascending triangle)
🎯 Target 3: 3379
Why: 3379 is near the top of current intraday channel and strong resistance on 4H/M30
Action:
Close all remaining positions
Assess for potential breakout above 3380 only if momentum is strong
⚠️ Risk Management Plan
Max Risk: 1.5% account risk split across 3 phases (0.5% per entry)
All SLs defined before entry — no averaging down
Trades invalidated if price breaks and closes below 3346 on M30
🔁 Summary Table
Entry Level Target Action
Buy @ 3352 TP1 = 3361 Secure partial profit, trail SL
Re-buy ~3356–3358 TP2 = 3370 Secure partial profit, trail SL
Re-buy ~3364–3366 TP3 = 3379 Close full position
🧭 Other Key Watch Points
DXY: Watching for rejection below 104.60 – bullish for Gold
News Events: Low-impact day; watch for any unscheduled Fed speakers
RSI + Volume: Using RSI (14) and OBV to confirm entry strength on M30

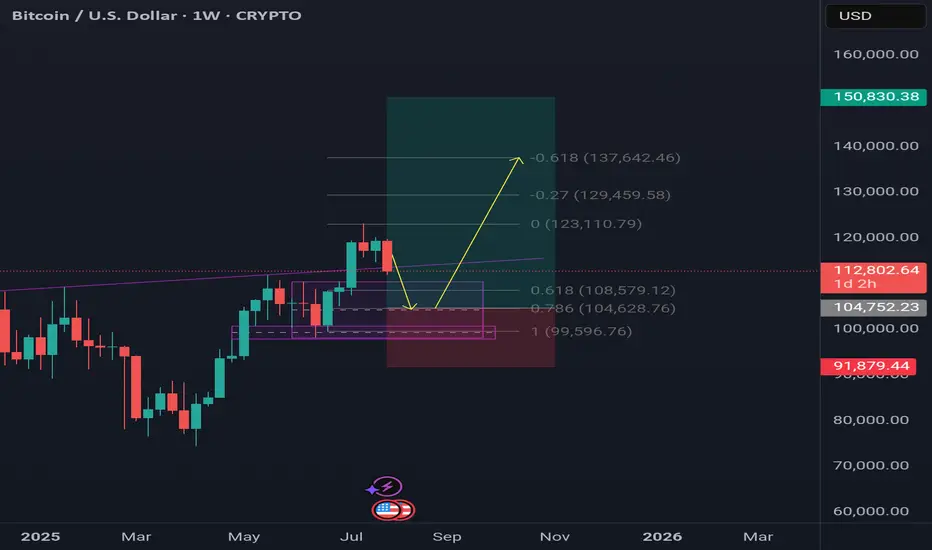
might be going insanebasically ive been thinking way too much and i am trying to be in set and forget mode because i think this is what happens

Bitcoin send it higher . I think btc will stop around 104k region amd then it will continue to give us another leg higher.It is not over yet , it still has to offer us another upside movememt.
Lets send it higher.
Stock Market Forecast | TSLA NVDA AAPL AMZN META MSFTStock Market Forecast | CME_MINI:NQ1! CME_MINI:ES1! SPY QQQ
Mag 7 Forecast | NASDAQ:TSLA NASDAQ:NVDA AAPL AMZN META MSFT GOOG

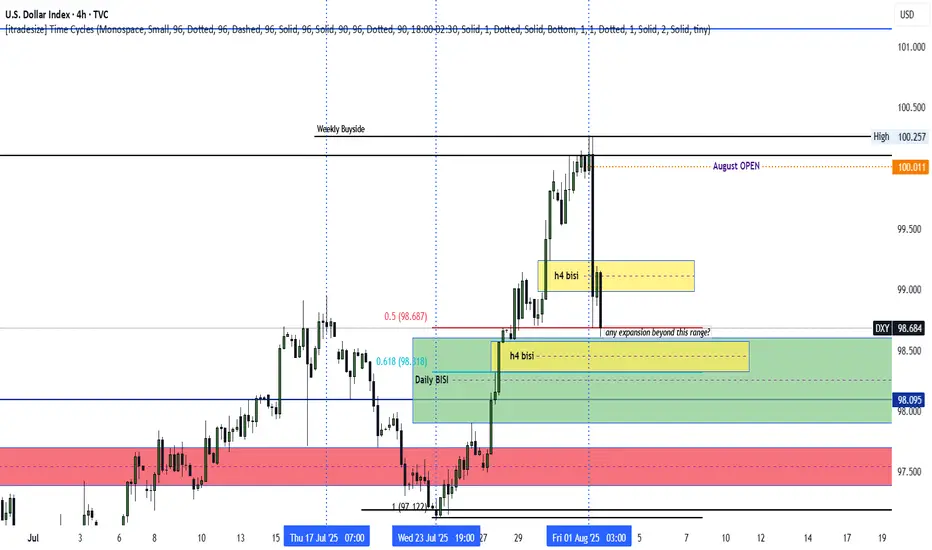
DXY bullish into AUGUSTThe dxy seems poised to rally following a rally above PMHs. The August OPEN decline could end up being nothing but a retracement as we rally high. Monday, Tuesday and Wednesday could range, while Thursday and the NFP push us above August's current highs. An expansion below Friday's New York AM lows (H4) could signal continued decline as we seek to establish weekly LOWS. Patience as the market unfolds is hand is ALWAYS key. Let's chat.
EURUSD short to 1.121Hello Traders,
Factoring in the fundamentals such as US EUR trade deal, $600 billion of investment into US, $350 billion investment from South Korea.
4hr chart, trading under 1 day up trendline.
Was strong sell signal from 1.177 last Thursday.
200ema starting to turn downwards
Still close to upper regression channel that began July 1st, believe it is still in play.
6 hr and 12 hr block still support, strong rejection at 4h bearish block. not expecting much else today since it's Friday. Still targeting 1.121 in August
Originally entered trade at 1.172 area, added 3 times on the way down, originally targeting 1.143 but with the ever evolving trade deal news that I believe to be bullish for the USD I moved target to 1.121.
Goodluck to you all.

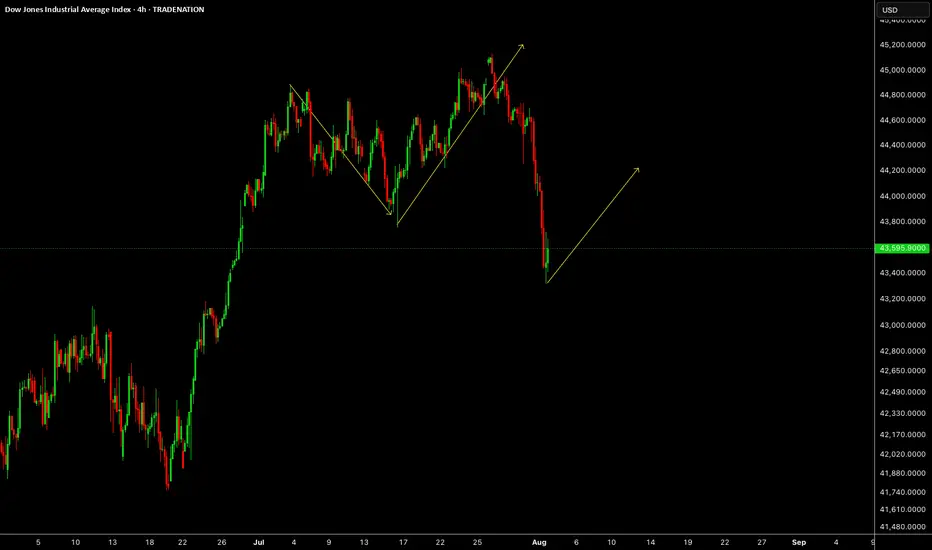
US30US30 was expected to drop last week which is what market has done. This week we need upside correction or impulse.
Disclosure: We are part of Trade Nation's Influencer program and receive a monthly fee for using their TradingView charts in our analysis.
GBPUSD - Short 1.3107GBPUSD is expected to lower levels. The pair may retrace to the levels of 1.3400 before hitting the lower levels.

EURUSDEUR/USD is the most traded currency pair in the world, representing the exchange rate between the euro (EUR) and the US dollar (USD). It reflects how many US dollars are required to purchase one euro. Introduced in 1999 with the launch of the euro, this pair has become a global benchmark due to the economic size and influence of both the Eurozone and the United States. It is highly liquid and closely watched by traders, investors, and policymakers, with its value shaped by monetary policy, interest rate differentials, macroeconomic indicators, and geopolitical developments.
Historically, EUR/USD has seen major swings. In the early 2000s, the pair fell to around 0.82 before rallying to a peak above 1.60 in 2008 during a period of dollar weakness. It then declined sharply during the European debt crisis. In 2022, amid aggressive interest rate hikes by the US Federal Reserve and rising global uncertainty, the pair briefly fell below parity, trading under 1.00 for the first time in nearly two decades. However, as inflation in the US began to ease and expectations of rate cuts grew, the euro gradually strengthened through 2023 and 2024.
As of August 2025, EUR/USD is trading around 1.15800. This reflects a moderate recovery of the euro from its lows, supported by a more stable Eurozone economy and a softer US dollar. The pair remains sensitive to central bank signals, particularly from the European Central Bank and the Federal Reserve, and is likely to continue reacting to shifts in monetary policy, inflation data, and global risk sentiment. EUR/USD remains a cornerstone of the forex market, widely used by traders for both short-term strategies and long-term positioning.

EUR/USD Reversal or Trap? 4H Clean Breakdown InsidePrice just tapped into a high-probability sell zone after a corrective Wave 2 structure. With sellers already active at 1.16342 and 1.17635, this setup is not just textbook—but a potential goldmine for swing traders.
🔻 Is this Wave 3 continuation about to begin?
🔍 Liquidity swept. Zones respected. Structure still bearish.
⚠️ Many traders will miss the bigger picture here—will you?
👇 Drop your thoughts:
Are we about to break 1.13000?
Do you agree with the Elliott Wave count?
What’s your bias on DXY?
💬 I personally reply to every comment—let’s build this chart together.
🔥 If you caught the entry, show your entry point and reasoning—let’s level up as a team.

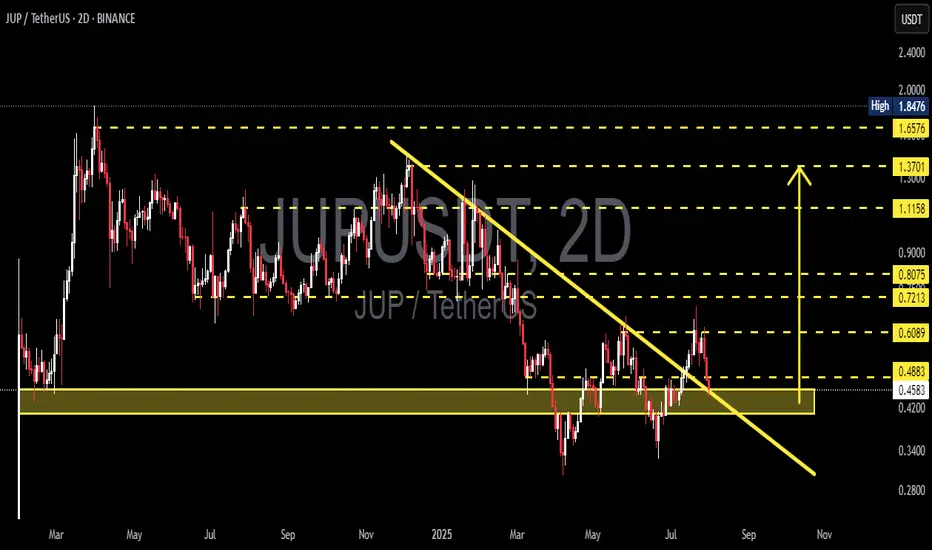
JUP/USDT Retests Key Support! Bounce Incoming or Breakdown Ahead📉 Complete Technical Analysis:
The JUP/USDT pair is currently showing a critical price action after breaking out from a medium-term descending trendline (yellow diagonal line). However, the price is now retesting a major demand zone around $0.4200–$0.4574.
📌 Pattern Identified:
Descending Trendline Breakout: Price successfully broke above a long-standing bearish trendline.
Retest of Breakout Zone: The current move is a classic retest, often seen before a trend reversal continuation.
Strong Demand Zone: The yellow zone ($0.4200–$0.4574) has historically served as a strong accumulation and bounce area.
---
📈 Bullish Scenario:
If the price holds and bounces from the $0.4200–$0.4574 zone, bullish momentum could resume with upside targets:
Short-term target: $0.6089
Next resistances: $0.7213 – $0.8075
A confirmed higher low above support would strengthen the bullish structure.
---
📉 Bearish Scenario:
If the price breaks down below $0.4200, bearish pressure could return, leading to further downside.
Potential decline toward deeper support levels around $0.35–$0.30.
Breakdown with increasing volume would confirm seller dominance.
---
🎯 Key Levels to Watch:
Support Zone: $0.4200 – $0.4574 (Critical Retest Area)
Immediate Resistance: $0.4883, $0.6089
Major Resistance Levels: $0.7213, $0.8075, $1.1158, up to $1.6576
---
🧠 Conclusion:
JUP/USDT is currently at a crucial decision point. The reaction at this support zone will define whether the breakout holds or fails. Traders should watch this level closely for confirmation of the next major move.
#JUPUSDT #CryptoAnalysis #AltcoinUpdate #TechnicalAnalysis #CryptoBreakout #SupportAndResistance #TradingView #Cryptocurrency #ChartPattern #BullishSetup #BearishCase
GBPUSD--LONG--02-08-25--Bouncing up from monthly support around1.31425 (black horizantal line),price at least move higher to the monthly resistance around 1.33822(black horizantal line)
--best entry level is between 1.325 and 1.328

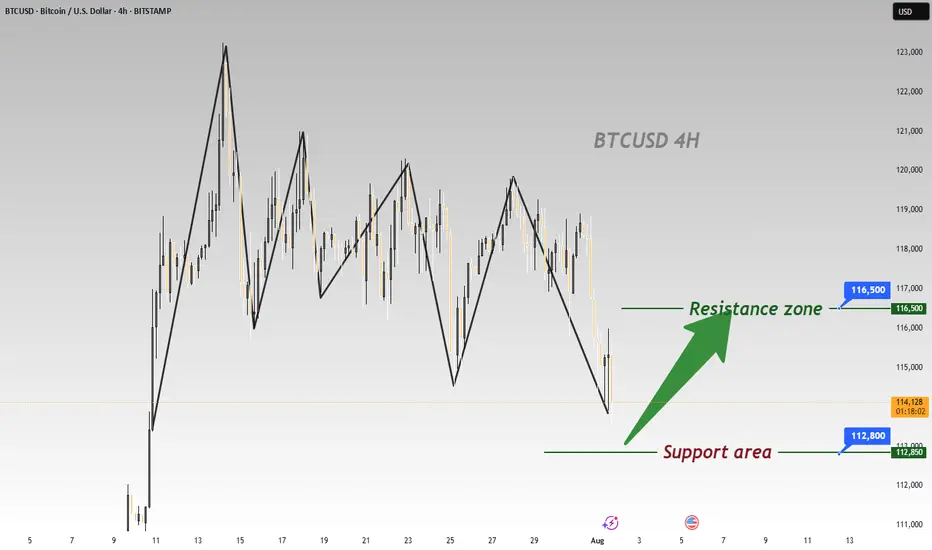
BTC Plummets Post-NFP; Go Long for Rebound to 116500BTC has plummeted significantly under the influence of the non-farm payroll data 📉, and now is an excellent opportunity to go long. Its Support level is around 112800, and according to the current trend, we can wait for a rebound to around 116500.
⚡️⚡️⚡️ BTCUSD ⚡️⚡️⚡️
🚀 Buy@ 113000 - 113800
🚀 TP 114500 - 115500 - 116500
Daily updates bring you precise trading signals 📊 When you hit a snag in trading, these signals stand as your trustworthy compass 🧭 Don’t hesitate to take a look—sincerely hoping they’ll be a huge help to you 🌟 👇
DOGEUSDT Analysis : Trendline Decision & Dual Directional Point📌 Market Context & Current Setup:
DOGEUSDT has been trading within a well-defined descending channel, respecting a strong trendline resistance, which has acted as a bearish ceiling for several sessions. The price action has been heavily influenced by supply zones formed after sharp impulsive drops, creating multiple QFL (Quick Flip Levels) — key to spotting structural bottoms and high-probability reversal zones.
Currently, the price is hovering near a critical decision point, where two key scenarios may play out:
A breakout and bullish reversal toward major resistance
A dip into a deep demand zone for final accumulation before reversal
Your plan reflects MMC (Market-Mind-Confirmation) methodology, preparing for either scenario with clear levels, logic, and psychology in place.
📐 Technical Breakdown:
🔻 1. Trendline Confirmation (Bearish Control):
The price has respected the downtrend line multiple times, confirming strong bearish momentum.
No candle body has closed decisively above it, showing sellers still have control.
However, price is now consolidating near this line, indicating a potential weakening of selling pressure — a classic sign of upcoming trend exhaustion.
🟩 2. Support Zones – Structural Layers:
📍 Minor Zone (S/R Flip – ~$0.215–0.220):
This zone is a previous support turned resistance.
It’s the first checkpoint the price needs to reclaim to confirm a breakout.
A successful flip from resistance back to support would add strong bullish confidence.
🟩 Reversal Zone (~$0.185–0.190):
Marked on your chart as a "Reversal Area" — likely derived from QFL methodology.
Price has historically bounced from this area, indicating buyers are willing to step in aggressively.
This zone aligns with smart money demand accumulation and could serve as a final liquidity sweep zone before a major reversal.
📍 Major Resistance Zone (~$0.250–0.260):
The next major objective once a trendline break is confirmed.
Also aligns with previous highs and volume nodes — a solid target for bullish trades.
🔄 Scenario-Based Strategy:
📈 Scenario 1 – Breakout Toward Major Resistance:
Price breaks above the descending trendline and reclaims the minor S/R zone.
This would confirm a bullish structure shift, validating that sellers are losing strength.
After reclaiming ~$0.215, the path toward $0.240–0.260 opens up.
Retests or flag breakouts within this range can be re-entry points for trend traders.
📉 Scenario 2 – Deeper Retest and Accumulation:
If the price fails to break out and dips further, the reversal demand area (~$0.185) becomes critical.
This is where buying pressure is expected to return, and as labeled in your chart:
👉 “If it goes down, we will double the supply”
This suggests an averaging-down or pyramiding strategy based on strong structural confidence.
This technique is valid only when the area is backed by solid confluence (trend exhaustion, demand, and past bounces).
🧠 MMC Strategy (Market – Mind – Confirmation):
Market: Bearish short-term trend, but price is approaching oversold territory near structural demand.
Mind: You’re prepared for both outcomes – breakout or dip. Emotion is out of the plan.
Confirmation: You wait for signs — break and retest of trendline, bullish engulfing candles, or wick rejections from demand.
This mental clarity helps maintain trading discipline and keeps emotional bias out of decision-making.
⚙️ Execution Plan:
Component Scenario 1 (Breakout) Scenario 2 (Deep Buy Zone)
Entry Signal Break & close above trendline + minor SR reclaim Bullish reversal candle within demand zone
Stop Loss Below trendline + S/R flip (~0.210) Below demand zone (~0.182)
Target 1 $0.235 $0.235
Target 2 $0.255–$0.260 $0.255–$0.260
Risk Level Medium Higher R:R potential
Strategy Notes Aggressive on confirmation only Add to position on wick traps
🧠 Trader Psychology Tips:
Be patient — confirmation beats prediction.
Set alerts at key levels to avoid emotional entries.
Scaling into trades based on zone reactions builds flexibility and control.
"Double the supply" approach must be paired with strict invalidation levels.
✅ Summary:
DOGE is trading within a descending wedge.
Key decision zones are marked clearly (trendline, S/R flip, reversal demand).
Breakout could lead to a quick 15–25% upside.
Reversal zone offers great R:R with accumulation opportunity.
Strategy is well-aligned with disciplined execution and trader psychology.

DOTUSDTThe first higher high after a downtrend indicates a potential trend reversal to the upside. It shows that buyers are starting to regain control, signaling the possibility of a new bullish trend.
Trendline Break: A break above a significant trendline further confirms the shift in sentiment from bearish to bullish. The trendline break signifies that selling pressure has weakened, and the market is poised for further upward movement.

XRP Path to 200XRP is so bullish.
Based on FIBS and Camarillas, this is a realistic path for the next 6 months to a year.
Gl hf.

Blue Boxes of ConsolidationIt seems the last two major moves on the chart (in the blue boxes) there was heavy consolidation for seven to 10 candlesticks, in this chart seven to ten weeks before a breakout. The bears now have a strong bearish candle but it is still in a consolidation pattern. The Bulls still have a trendline that held from April 2024 where price has not closed below it (please see SMA curve in black on the chart). If you turn on the 50 EMA price is still oscillating around it. And price is still in the Fibonacci golden zone. The bears need a bearish close with follow through below 12.40 and the bulls need a bullish close above 13.65 to hopefully kick off their party. The Bulls have a historical trendline and the Bears have a bearish MACD(Chris Moody) and a Braid filter that just flashed red and a recent strong bearish candle.

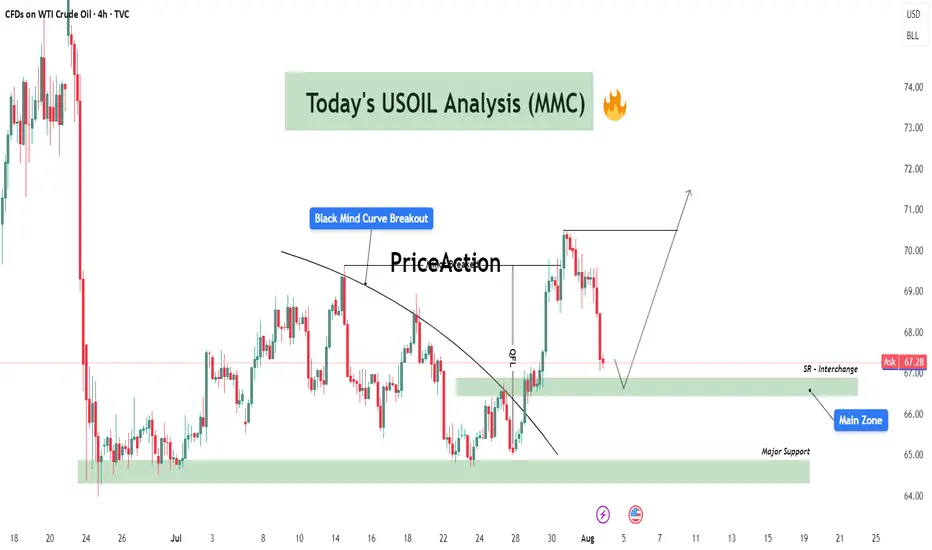
USOIL Technical Analysis – Black Mind Curve Breakout & Reversal🔍 Overall Market Context:
The current USOIL structure is a great example of market shift from compression to expansion, characterized by a breakout of the Black Mind Curve followed by a measured impulse move. This chart is not just reacting technically, but it reflects how institutional smart money manipulates curves, breaks minor structures, and then retests zones to refill orders before continuing directionally.
Let’s break the market psychology and price action phase by phase:
🔄 Phase 1: Black Mind Curve Breakout ✅
The Black Mind Curve represents long-standing supply pressure that had been capping price.
Its breakout marks a shift in market intention, often signaling the end of a distribution phase and beginning of a possible accumulation or re-accumulation.
Price broke above this curve cleanly with strong bullish candles, which also broke minor structure levels, confirming short-term bullish sentiment.
The breakout was also backed by momentum and volume as the market pushed 130+ pips upward—an aggressive impulse that trapped late sellers below.
📉 Phase 2: Retracement to Interchange Zones
Now, we’re in the retracement phase, where price is pulling back toward:
🔹 SR Interchange Zone ($66.80 - $67.30)
This zone was previous resistance, now flipping to support.
In MMC terms, this area is expected to serve as a refill zone where smart money will look to accumulate again after the breakout.
We are watching for confirmation candles or MMC-style reversal patterns here (e.g., inside bar breakouts, demand imbalances).
🔹 Main Zone ($65.80 - $66.50)
If the first zone fails, this is the next key demand base.
It holds historical value from previous accumulation phases (see July 10–25) and aligns with the origin of the last impulse.
Expect a sharper wick or deeper liquidity grab if price moves into this area.
📉 Phase 3: Final Defensive Zone – Major Support ($63.70 - $65.20)
This zone marks the last line of bullish defense.
A move here would mean the bullish structure is being reevaluated or absorbed by sellers.
However, if price hits this level, it could also attract significant institutional demand, setting up for a more powerful long-term leg up.
Reactions here are typically large and volatile, with a risk of fakeouts and fast reversals.
📈 Possible Scenarios (MMC Based Forecasting):
✅ Scenario 1 – Bullish Continuation (Primary Path)
Price finds support inside SR Interchange Zone.
Forms a base (MMC reversal structure) and pushes back to recent highs near $71.
Breakout above $71 opens room for next supply zones between $72.50 - $74.00.
⚠️ Scenario 2 – Deeper Liquidity Grab
Price breaks below SR Interchange and tests Main Zone for a deeper accumulation.
A wick or shakeout may happen before bullish continuation.
This trap zone could give the best R:R entry.
❌ Scenario 3 – Breakdown to Major Support
If both zones fail and bearish pressure sustains, price may revisit Major Support.
That would reset the bullish structure and require fresh MMC assessment.
🧠 MMC Logic at Work:
The curve break symbolizes the shift from supply dominance to a possible demand-led phase.
Minor structure breaks add fuel to trend shift and indicate participation from larger players.
Retracements are not weaknesses—they are refills for those who missed the move.
Smart money uses these zones and flips (SR interchanges) to hide in plain sight.
🎯 Key Takeaway for Traders:
This is a textbook MMC setup that combines:
Curve Breakout + Impulse
Zone Retest + Interchange Logic
Liquidity Engineering before Continuation
Traders should remain patient and observe reactions at each zone. Don’t chase—wait for the market to reveal its hand via MMC entry signals (break-of-structure, bullish engulfings, imbalance fills, etc.)
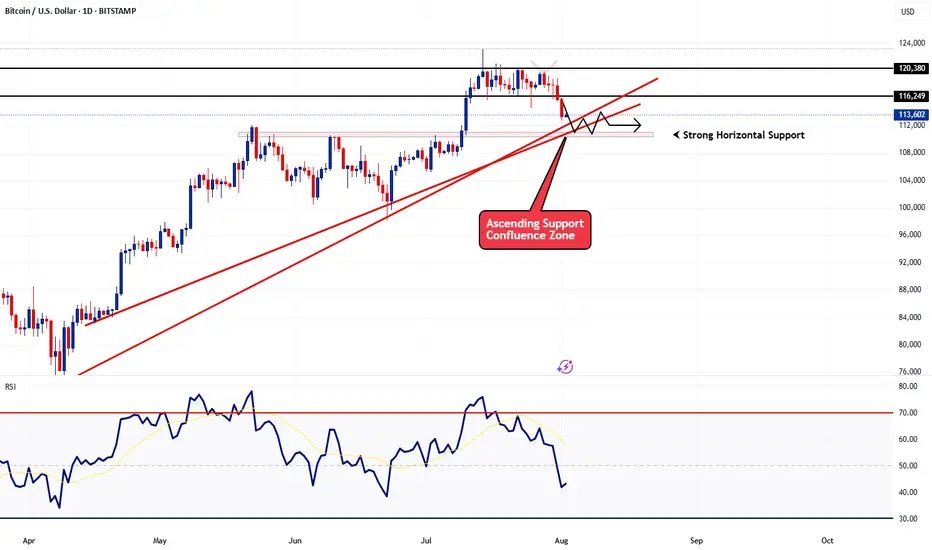
BTCUSD - Follow Up AnalysisTaking a look at the daily chart, price action did come down as previously expected in my last article.
Now we're heading into an area of strong support and I expect to see some sideways action until something significant happens next.
How I'm trading this price action?
I believe price action may continue to bounce around from the current price of 113,600 down to 110,000 for at least the next few days. With that said I'm implementing my range trading strategy. The range trading strategy also known as the Bitcoin Scalper scalps on the 1 and 5min timeframe creating sort of like a grid style approach but it's based on candlestick momentum. Since it trades off momentum, it's able to detect breakouts and know when to switch from the ranging strategy to the breakout strategy.
GBPJPY Will Move Higher! Long!
Take a look at our analysis for GBPJPY.
Time Frame: 1h
Current Trend: Bullish
Sentiment: Oversold (based on 7-period RSI)
Forecast: Bullish
The market is approaching a key horizontal level 195.702.
Considering the today's price action, probabilities will be high to see a movement to 197.050.
P.S
Please, note that an oversold/overbought condition can last for a long time, and therefore being oversold/overbought doesn't mean a price rally will come soon, or at all.
Disclosure: I am part of Trade Nation's Influencer program and receive a monthly fee for using their TradingView charts in my analysis.
Like and subscribe and comment my ideas if you enjoy them!

