Still keeping a close eye on a potential USD pop...Although the EUR/USD and GBP/USD popped higher late last week, I'm still keeping a close eye to stay short on the EUR/USD considering the bearish rising broadening pattern coupled with a yearly pivot point inter-median level and negative divergence on the MACD. This is all based on the daily chart.
Many factors are in play right now with what's going on between Israel and Iran along with FOMC this week and Tariffs still in play.
On a purely technical analysis point of view, I potentially expect a bullish retracement in the USD while remaining long term bearish across the board.
we'll see how this one develops.
Good Luck & Trade Safe.
Chartpatternanalysis

Will the U.S. Dollar Bear go out to lunch and take a break?In this video I go over the case for the U.S. Dollar bear taking a break and price action getting a pullback across the EUR/USD, GBP/USD and USD/JPY.
I took a 42% profit on EUR/USD longs and currently keeping an eye on a short opportunity if weakness starts to creep in on the price action.
Long term, I remain U.S. Dollar bearish across the board however pullbacks are always expected during a macro price move.
If we trade higher, so be it and I will evaluate what the next position will be.
As always, Good Luck & Trade Safe.

AUD/USD Price Action Analysis – Range Trading Opportunity📉 AUD/USD Price Action Analysis – Range Trading Opportunity 🔁
⚙️ Market Structure Overview:
The AUD/USD pair is currently exhibiting a well-defined range-bound market structure between the Support Zone (0.63800 – 0.64000) and the Resistance Zone (0.65200 – 0.65400).
🟩 Support Zone
📍 Identified by multiple price rejections and bullish reversals (marked with ⬆️ arrows).
💡 This area represents strong buying interest, making it a potential long-entry zone on bullish confirmation.
🟥 Resistance Zone
📍 Marked by two sharp rejections (⬇️ arrows) and upper wicks.
💡 This zone has served as a supply area, where sellers overpower buyers, signaling potential short opportunities.
🔄 Current Scenario:
Price is approaching the support zone again after rejecting the resistance area. Based on historical behavior:
📉 Short-term Bearish Momentum is in play until support is tested.
📈 Potential Bullish Reversal is likely if support holds — aligning with previous bounce behavior.
🔮 Trade Ideas:
📈 Bullish Setup:
📍Entry: Near support zone (~0.63850)
🎯Target: Resistance zone (~0.65250)
🛑Stop-loss: Below support (~0.63650)
📉 Bearish Setup (Breakdown Scenario):
📍Entry: On confirmed break below support (~0.63800)
🎯Target: Lower structure zones (TBD based on breakout leg)
🛑Stop-loss: Above broken support
📅 Key Risk Events:
🔔 Multiple high-impact USD and AUD economic events approaching.
🧭 Traders should monitor fundamentals closely for increased volatility and breakout potential.
🧠 Summary:
📌 The AUD/USD pair is currently respecting a range-bound structure.
🧱 Buying from support and selling from resistance remains the most probable high-probability strategy.
📊 Range trading suits this setup until a confirmed breakout or breakdown occurs.
🔔 Like & Follow for more clean, structured trade setups and zone-based price action ideas!

Professional Analysis: XAU/USD – GOLD Price Forecast :
📈 Professional Analysis: XAU/USD – GOLD Price Forecast 🟡
🗓️ Date: May 28–29, 2025 | ⏱ Timeframe: Intraday (Hourly)
🔍 Instrument: Gold vs. USD (XAU/USD)
📊 Technical Chart Summary
🟥 Resistance Zone:
📌 Level: $3,350 – $3,365
🛑 Price has rejected this zone multiple times, marking it as a strong supply area.
📉 Each test of resistance led to a pullback — showing seller strength 💪.
🟩 Support Zone:
📌 Level: $3,280 – $3,295
🛡 Multiple higher low bounces suggest this zone is being defended by buyers.
🔁 Price has formed 3 reaction lows, indicating accumulation 📥.
🔄 Structure & Pattern Recognition
🔺 Descending followed by Ascending Swings
⛳ Market shows a reversal attempt after forming a potential double bottom / triple test at support.
📈 Bullish structure forming with the latest swing creating a higher low.
📉 Past wave = Bearish Correction
📈 Current projection = Potential bullish impulse if the support holds.
📐 Projection & Price Action Forecast
📍 Current Price: $3,297.175
📈 Expected Move: Bounce off support → climb toward $3,330–$3,350 🔼
🧠 Rationale:
Price testing support again
Market respecting horizontal range
No clean breakdown yet
📊 Bullish Scenario (Primary)
🔁 Rebound off support
🎯 Target: Resistance zone ($3,350)
✅ Entry: Above $3,300 with bullish candle close
🛑 SL: Below $3,280
📉 Bearish Breakdown (Alternate)
❌ Break below $3,280
🎯 Target: $3,260 or lower
⚠️ Wait for confirmation candle
🔚 Conclusion
🟡 Gold (XAU/USD) is trading within a well-defined range with buyers stepping in near $3,290 and sellers near $3,355.
📌 Based on current technicals, there’s a higher probability of an upward move, unless support breaks decisively.
🛠️ Pro Tip:
💡 Use RSI + Volume to confirm momentum on breakout. Look for bullish divergence or volume surge near the bounce.

JPYUSD Technical Analysis | (MMC) in Play + Target🟦 1. Structure & Price Action Overview
The chart is of JPY/USD on the 2-hour timeframe, showing a clear picture of price movement over several weeks.
We see three major market phases:
Range/Resistance Phase (Left side of chart)
Uptrend Phase (Middle – rising channel)
Reversal Setup (Right side – potential bearish move forming)
📈 2. Uptrend Channel (Accumulation to Expansion Phase)
From around May 13th, price started forming higher highs and higher lows, respecting a bullish channel (light blue shaded area).
This is a classic ascending channel, often seen during a controlled uptrend where buyers are still in control but momentum is slowing.
The channel took price directly into the resistance zone (marked in purple at the top).
🚫 3. Resistance Zone Rejection (Key Supply Zone)
Once price hit the resistance zone (~0.00705), it failed to break higher.
This level had previously caused sharp drops, so it's a well-established supply zone.
Price was rejected and dropped sharply, breaking out of the ascending channel – a strong bearish signal.
🔄 4. Mirror Market Concept (MMC) – Curve Bending Pattern
After the initial drop, price attempted a bounce, but couldn't even reach previous highs.
The curved arrow labeled "Curve Bending" shows how the market is “bending” its momentum – not pushing upward anymore but turning into a reversal.
This forms the mirror of the previous rise – indicating the market is ready to “mirror” that previous bullish leg, but to the downside.
🔄 5. SR Interchange (Support Flipped Resistance)
The previous demand zone (around 0.006950–0.007000), where buyers pushed price higher during the uptrend, is now acting as resistance.
This is called an SR Flip (Support becomes Resistance) – a very reliable technical sign of trend reversal.
🎯 6. Bearish Target Projection
Based on MMC and symmetry of past movements, the chart is projecting a strong drop toward the 0.006800 support zone.
This zone is also historically significant and acted as a demand area earlier.
The black arrow and target box show this expected move, which aligns with the mirror structure.
🧩 Conclusion & Trade Plan
Bias: Strong Bearish
Confirmation : Channel break + rejection at resistance + curve bending
Trigger: Price fails to reclaim 0.00700 and breaks below 0.006930
Target: 0.006800
Invalidation : Clean break & hold above 0.007050
🛡️ Pro Tips:
Don’t just jump in — wait for bearish confirmation (like a bearish engulfing candle, or a failed retest).
Always set your SL (Stop Loss) above the resistance zone (~0.007050).
Let the setup come to you — don’t force trades.

Bitcoin MMC Analysis – Mirror Market Concepts in Action + Target📌 Overview:
In this idea, I’m using Mirror Market Concepts (MMC) to break down Bitcoin’s current price behavior. MMC is a powerful way to spot repetitive price patterns, psychological zones, and mirrored moves that help us predict where the market might go next.
Let’s break down what this chart is really telling us. 👇
🔁 1. Mirror Market Concept in Play
MMC is all about symmetry. Think of it like looking into a mirror—what price did on the left side, it might repeat (or mirror) on the right side.
Look at the two rounded zones (highlighted in light blue ellipses). Price dipped into the support zone, formed a rounded bottom, and then shot up. A similar pattern is forming again on the right-hand side. This mirroring behavior gives us a clue that price could follow the same path upward again.
📉 2. Trendline Resistance – A Key Level
The chart shows a clear descending trendline that has been respected multiple times. Every time price tries to break above this line, it gets rejected. This tells us that sellers are still in control at that level.
Until this trendline is broken cleanly, bullish momentum remains capped. However, multiple tests of the trendline also indicate it's getting weaker, so a breakout might be coming.
🟪 3. Support Zone – Buyer’s Stronghold
See the purple shaded area near $108,400? That’s the support zone. Price bounced off this area several times, showing that buyers are defending this level.
This zone is important because:
If it holds, we can expect another upward push.
If it breaks, price could drop to the next support level (not shown here, but could be around $107,000–$107,500 based on structure).
🎯 4. Previous Target Hit – New Target Identified
Using MMC, we previously predicted a move up to around $110,800, and that target has been successfully hit (labeled as "Previous Target" in the chart).
Now, a new target zone is forming around $109,600–$109,800, marked on the right side of the chart. If price breaks above the trendline and central zone, this is the next likely destination.
🔵 5. Central Ellipse Zone – Compression Area
The blue ellipse on the right side represents a central zone—an area of price compression and indecision. In MMC, this is where price builds up energy before a move. It acts like a spring: the longer price consolidates here, the bigger the breakout move will be.
Right now, BTC is compressing in this central zone. This is a critical moment. The breakout direction from here could decide the short-term trend.
📊 Trade Plan Ideas:
🔹 Bullish Scenario:
Wait for a clean breakout above the trendline and central zone.
Look for a retest of the breakout area (confirmation).
Target the $109,600–$109,800 zone.
🔹 Bearish Scenario:
If price fails to break the trendline and drops below the support zone at $108,400…
We could expect a deeper pullback toward $107,000–$107,500.
🔹 Key Levels:
Resistance: $109,200 (trendline area), $109,800 (target zone)
Support: $108,400 (zone), $107,500 (next major support if broken)
📘 Final Thoughts:
This chart is a perfect example of how MMC (Mirror Market Concepts) can give us a visual roadmap of what price might do next. It’s not about guessing—it’s about recognizing the psychological patterns that repeat over and over in the markets.
Right now, Bitcoin is sitting at a decision point:
Break above the trendline = possible bullish continuation
Break below support = likely bearish shift
Watch the central zone closely—because the next big move could start from right there. 🔍

XAGUSD Technical Analysis : MMC Breakdown from Resistance ZoneChart Concept: By Using MMC – Mirror Market Concepts
🔎 1. Major Resistance Zone – The Brick Wall
At the top of the chart, around $33.85–$34.00, we see a strong major resistance zone. This area has acted as a ceiling for price multiple times in the past. Think of it like a brick wall where the bulls keep trying to break through but get pushed back. When price touches this level and fails to break above it, that’s a clear rejection.
This rejection gives the first sign that buyers are losing steam and sellers are stepping in.
🧠 2. Mirror Market Concept (MMC) in Action
Using the MMC (Mirror Market Concept), we’re treating the chart like a reflection — what happened on one side of the move is likely to mirror or repeat on the other.
So when price aggressively moved up into resistance, you look for a symmetrical move back down once it's rejected — just like looking in a mirror. This concept helps predict where price might land based on previous movements, levels, and psychological patterns.
🧱 3. SR Interchange Zone (Support ↔ Resistance Flip)
Look around the $33.10–$33.25 area — this is a critical SR interchange zone. Price used this zone as resistance in the past, broke above it, and then used it as support.
Now that price has rejected from the top, it’s coming back down to retest this SR zone. If it breaks below this area, it confirms a shift in market structure—from bullish to bearish.
🌀 4. Black Mind Curve Support – Dynamic Support
That curved black line? That’s not just a drawing — it's called Mind Curve Support in MMC. This curve helps map out dynamic support based on price memory and human psychology.
As long as the price respects that curve, the structure is bullish. But once it breaks below it — like it’s threatening to do now — it often means momentum has shifted and a correction is underway.
⛓️ 5. Bearish Breakdown Structure
Once price touched the major resistance, it formed two swing highs labeled TP1 and TP2. That’s very similar to a double top pattern, which is a strong bearish reversal signal. After the second peak, price dropped sharply — that’s your early confirmation of a potential move lower.
And now, price is forming lower highs and lower lows, another classic sign of bearish momentum taking over.
🎯 6. Target Zone – Why $32.72?
Here’s where MMC really helps:
The projected target zone is $32.72, which is marked in the chart.
Why this exact level?
It’s previous market structure (support zone from earlier)
It aligns with the 50% Fibonacci retracement
It’s the mirror reflection of the bullish move, completing the MMC concept
This is a high-probability area where buyers may step in again.
💼 Trade Setup Summary (Educational Only)
Parameter Level
Entry Below $33.20 after confirmation candle
Stop Loss Above $33.85 (recent high)
Take Profit $32.72 (MMC Mirror Target)
🧠 Final Thoughts – The MMC Edge
This chart isn’t just about lines and levels. It’s about understanding how traders think — where they get excited, scared, greedy, or exhausted. That’s what Mirror Market Concepts (MMC) are built on.
By recognizing structure, psychological curves, and SR flips, you're not just guessing—you’re reading the market’s mind.
⚠️ Risk Disclaimer
This is not financial advice. Always use proper risk management and confirm setups with your own trading plan before entering any trade.

BTCUSD MMC Breakdown – Curve Collapse & H&S Sell-Off Loading🔍 Chart Overview – BTC/USD (1H Timeframe)
This setup uses Mirror Market Concepts (MMC) to forecast Bitcoin’s next potential major move, blending institutional-level curve analysis, pattern recognition, and structure shifts.
We are currently seeing a Head & Shoulders (H&S) pattern develop under a Black Mind Curve Resistance, supported by a sloping neckline and a clear zone of structure breaks and retests. Price is positioned for a significant bearish continuation if confirmation hits.
📐 Breakdown of Key Components:
🧠 1. Mirror Market Concepts (MMC)
MMC focuses on the symmetry and memory of market behavior. When certain price structures mirror past reactions (support, resistance, or rejection points), we gain an edge in anticipating where big moves will happen.
Here, the curve structure and neckline level align to mirror prior bearish reactions.
👤 2. Head & Shoulders Pattern
Left Shoulder: Formed with rising volume and strong bullish momentum.
Head: A sharp move upward forming a new high, but eventually fails to sustain above the curve.
Right Shoulder: A weaker bullish attempt, indicating exhaustion and imbalance.
The neckline is clearly marked — a break below it validates the reversal pattern.
🟠 3. Black Mind Curve Resistance
This is an institutional resistance arc — an MMC dynamic level that mirrors prior selling patterns. Price reacted strongly under this curve, confirming its relevance.
It acted as a ceiling for the head formation, capping bullish continuation and turning price downward.
🔵 4. Black Mind Curve Support
Drawn beneath the price action, this dynamic support is about to be tested again. A clean break below the curve and neckline would likely result in a strong drop.
⚠️ 5. Major CHoCH & BOS Zones
CHoCH (Change of Character): Price failed to form new highs and showed early bearish shift.
BOS (Break of Structure): Confirmed when neckline is broken.
These are vital MMC confirmation points that strengthen the short idea.
🔁 6. Retest & Boom (Bearish Version)
Price could retest the neckline or the broken trendline (shown by the blue arrows), offering a perfect "sell on retest" opportunity before dropping to the target.
This is a classic MMC play — breakdown ➝ retest ➝ continuation.
🎯 7. Target Zone
Projected based on:
Height of the H&S pattern.
Previous key structure zone.
MMC symmetry principles.
Expected target: near $101,700 – $102,000.
🧨 Trade Idea:
✅ Bearish Setup (Preferred Bias)
Wait for a clean neckline break and candle close.
Look for retest of neckline or curve (lower timeframes).
Sell with target near $101,700, SL above right shoulder.
🚫 Invalidation:
Price closes back above right shoulder and curve.
Invalidates the bearish structure.

Silver Double Top at Major Resistance – Bearish Breakdown📌 Overview:
This chart shows a classic Double Top Pattern forming on the weekly timeframe for Silver (XAG/USD). Price has reached a multi-year resistance zone and failed to break above it twice, signaling potential exhaustion of bullish momentum and the possibility of a larger trend reversal.
🧩 Detailed Pattern Breakdown:
🔹 1. Double Top Pattern
The double top is one of the most reliable bearish reversal patterns, formed when the market tests a resistance level twice and fails to break it, creating two rounded or sharp peaks. In this case:
Top 1 and Top 2 occurred near the $35–36 zone, clearly marked as a major resistance level.
This indicates strong selling pressure from that zone.
🔹 2. Major Resistance Zone
The $35–36 price range has historically acted as a ceiling for Silver prices. It rejected price several times between 2021 and 2025. When this kind of level holds, it often precedes sharp corrections, especially when volume begins to drop and momentum weakens.
🔹 3. Rising Trendline Break
After forming the double top, price broke down through a key ascending trendline, a sign that the bulls are losing control. The breakdown is further confirmed by a strong bearish candle, closing below both the trendline and a critical SR (Support-Resistance) Interchange zone.
🔹 4. Retesting in Progress
Post-breakdown, the price action is now retesting the broken trendline and horizontal zone (~$28). This is a crucial moment:
If Silver gets rejected here, it confirms the bearish breakout and signals entry for sellers.
If it reclaims this level, the bearish setup could fail, and price might consolidate or resume uptrend.
🔹 5. SR - Interchange Zone
This zone is marked because it acted as resistance during the 2022-2023 period, and then flipped into support in 2024. Currently, it’s being tested from below, making it an SR flip retest. These zones often become inflection points.
🔹 6. Black Mind Curve Support
An important and unique addition is the “Black Mind Curve Support” – a curved dynamic trendline that has historically aligned with price retracements. The projected path shows that the curve and horizontal support (~$22.68) intersect, strengthening the significance of that level.
🔹 7. Measured Move & Target
Based on the height of the Double Top pattern (approx. $10 range from top to neckline), the measured move places the target near $22.68, which matches both:
Historical demand zone
Curve support
This alignment makes $22.68 a realistic and strong downside target.
🧭 Strategic Summary:
Pattern Type: Double Top (Bearish Reversal)
Key Resistance: $35–36 (Multi-year rejection level)
Trendline: Broken (Bearish confirmation)
Retesting Area: $28–29 zone (Watch for rejection)
Downside Target: $22.68 (Confluence of support zones)
Invalidation: Clean weekly close above $35
🔍 What Traders Should Watch:
✅ Bearish Candlestick Confirmation at the retest zone (e.g. bearish engulfing, shooting star).
✅ Increased volume on drop, confirming participation by larger players.
🚫 Invalidation signal would be a sustained move and close back above the resistance zone.
⚖️ Risk Management Tip:
This pattern offers a high risk-to-reward ratio trade setup. Short entries on the retest with stop loss above $36 can provide substantial downside potential toward $22–23, especially in a commodity market prone to sharp retracements.
📌 Final Thoughts:
Silver appears to be forming a clean double top reversal at a long-term resistance. If the current retest fails, a significant correction may follow, targeting the $22.68 level. This pattern, combined with key support-resistance dynamics and psychological zones, makes this setup worth monitoring for medium- to long-term traders.

JPY/USD Rising Wedge Pattern Formed | Retest & Move To Target🧠 Overview:
The JPY/USD pair has recently exhibited a Rising Wedge Pattern, a classic technical formation known for its bearish implications. This pattern has developed over several days of bullish price action, showing diminishing bullish momentum as price action narrows.
The wedge is forming right beneath a minor resistance zone, increasing the likelihood of a potential rejection and breakdown. This setup is particularly noteworthy due to the multiple layers of confluence supporting the bearish bias.
🔍 Technical Breakdown:
📌 1. Rising Wedge Formation
A rising wedge is often considered a bearish reversal pattern, especially after a strong uptrend.
As seen on the chart, price is respecting both the upper and lower bounds of the wedge, but with a loss of bullish momentum, indicated by shallower highs.
This tightening price action hints at indecision and likely exhaustion from buyers.
📌 2. Minor Resistance Zone
Price has approached a previous structure high where strong selling interest was seen before.
This zone has already rejected price once, acting as a supply area.
The repeated failure to break above reinforces the strength of this resistance.
📌 3. SR Interchange (Support Turned Resistance)
Below the current price action, there's a well-defined Support-Resistance Flip Zone (SR Interchange).
Previously a strong demand area, this zone may now act as a new resistance if price breaks below and retests it.
This is a key area where sellers are likely to step in again.
📌 4. Break & Retest Structure
As price begins to break the lower wedge boundary, the next move we anticipate is a retest of the broken wedge trendline.
This retest, if confirmed by rejection candles (such as bearish engulfing or pin bars), would present an ideal entry opportunity for short positions.
🎯 Trade Plan & Price Levels:
💼 Bearish Scenario
Entry Point: Wait for a successful retest of the broken wedge line (confirmation via price action: bearish engulfing or pin bar).
Stop Loss: Above the recent swing high or above the wedge resistance (~0.006920).
Take Profit 1 (TP1): 0.006845 – First key support zone.
Take Profit 2 (TP2): 0.006807 – Next major support / liquidity zone.
🧩 Why This Setup Makes Sense:
✅ Multiple Confluences:
Bearish wedge structure = reversal pattern.
Resistance zone = psychological and technical rejection.
SR Interchange = confirms institutional selling interest.
Retest confirmation = high-probability entry.
Target zones = based on recent support levels and market structure.
🛑 Risk Management:
Risk-to-reward ratio favors short positions if executed after retest.
Avoid jumping in early — wait for confirmation.
Proper stop loss is key to avoiding false breakouts or premature entries.
📊 Summary:
This is a textbook bearish setup with strong technical backing. The rising wedge pattern, when combined with resistance and retest zones, offers a great shorting opportunity — assuming price respects the pattern. Patience will be crucial here; wait for the break, the retest, and the confirmation before entering.
🔔 What to Watch:
Price behavior near the lower wedge boundary.
Reaction on retest — do bulls defend or do bears take over?
Confirmation from volume or price action (engulfing candles, rejection wicks).
Any fundamental catalysts or USD-related news.
✍️ Final Thoughts:
This is a well-structured short setup on the JPY/USD 1H chart. Wedges often deceive with temporary breakouts before reversing hard — so discipline, timing, and confirmation will be key. If the market respects this technical structure, we could see a clean drop toward our projected targets.

XAGUSD Triangle Pattern Forming – Breakdown on the Horizon?🧠 Technical Analysis – XAG/USD
Silver (XAG/USD) has entered a compression phase, forming a classic Symmetrical Triangle Pattern within a broader Black Mind Curve structure, which adds additional psychological and visual significance. These patterns, when paired together, often signal a build-up of volatility ahead of a powerful breakout.
🔍 Pattern Explanation: Triangle + Black Mind Curve
Symmetrical Triangle Pattern: This pattern is marked by converging trendlines of higher lows and lower highs. It reflects indecision between bulls and bears — a tug-of-war where volatility decreases as price coils into the apex.
Black Mind Curve Structure: The curved support and resistance arcs highlight a rounded structure often seen before large breakout moves. These curves create an intuitive framework for understanding how the market is behaving on a broader scale — the "mind of the market" if you will.
🔺 Curve Resistance: Acting as a ceiling suppressing bullish attempts.
🔻 Curve Support: The dynamic floor that has held price within bounds until now.
📉 Breakout & Retest Phase in Play
The triangle has now been breached to the downside, and price is currently in the retest phase — a textbook behavior before continuation. The market is now revisiting the lower boundary of the triangle (~$32.30–$32.40), which is potentially flipping into resistance.
This retest is critical: if price fails to reclaim the triangle and gets rejected, it strengthens the case for further downside.
We’ve also seen a slight uptick in bearish momentum and volume on the initial breakdown.
🎯 Projected Price Targets
We apply the measured move technique, which calculates the triangle’s height and projects it downward from the breakout point:
TP1: $31.68 – A short-term support level and the first technical target.
TP2: $31.12 – Measured move target and key demand zone from the past week.
These levels are not arbitrary — they align with both psychological round numbers and historical structure zones, which often act as magnets for price.
📌 Why This Setup Matters
This isn’t just a triangle breakout. The confluence of the triangle pattern and the Black Mind Curve framework suggests a psychologically significant shift is underway.
Price has respected the curved structure for nearly two weeks.
The triangle represents compression — the final phase before directional expansion.
The false breakout risk is real, but the context (bearish trend leading in, lower highs, failed rallies) favors a downward continuation.
💡 Trade Setup Idea (Example Only)
Parameter Value
🧩 Pattern Symmetrical Triangle
⏳ Phase Retesting after breakdown
🎯 Entry On bearish confirmation at ~$32.30
❌ Stop Loss Above triangle upper bound (~$32.65)
✅ TP1 $31.68
✅ TP2 $31.12
⚖️ Risk/Reward 1:2 or better
Note: Wait for clear rejection candlesticks (e.g., bearish engulfing, shooting star) to confirm bearish intent.
⚠️ Risk Management & Considerations
Avoid premature entries — wait for candle confirmation on the retest zone.
Adjust lot size and leverage according to personal risk tolerance.
Remember: triangle patterns can break either way — monitor invalidation levels carefully (e.g., a breakout back into triangle with strong volume).
💬 Mindset & Market Psychology
This triangle and curve setup mirrors a battle between consolidation and trend continuation. The curves represent the market’s subconscious behavior — as price rounds out and tests boundaries, the final breakout reveals collective trader sentiment.
“Patterns are footprints of psychology. Trade the behavior, not the prediction.”
Be the trader who waits for the story to unfold. Let structure speak before you act.
✅ In Summary
📌 Pattern: Triangle inside Black Mind Curve
🔍 Key Levels: $32.30 (retest), $31.68 (TP1), $31.12 (TP2)
📉 Bias: Bearish, with potential continuation after retest rejection
⏱️ Timeframe: 1H – Suitable for intraday to short-term swing trades
💬 What do you think – is Silver ready to break down, or will bulls reclaim control? Drop your analysis below! Like & follow for more smart technical setups every week.

BTC/USD Bearish Setup – Trendline Retest Before the Fall?🔍 Technical Breakdown – BTC/USD 3H Timeframe
Bitcoin is displaying a textbook Double Top pattern formation on the 3-hour chart, signaling a potential bearish reversal after a strong bullish run. This classic pattern suggests buyer exhaustion and sets the stage for a downward move. Let's break down the analysis:
🧠 Pattern Insight: Double Top Reversal
A Double Top is one of the most reliable trend reversal patterns, especially when it forms after a sustained uptrend — just like we're seeing here.
Top 1 and Top 2 both formed inside a strong Resistance Zone between $106,500 and $107,000, showing repeated rejection from buyers to push price higher.
The formation of lower highs and long wicks near Top 2 further reinforce the weakening bullish momentum.
💥 Neckline Breakdown & Bearish Trigger
The Neckline, aligned with a horizontal Support Zone (~$103,300–$103,800), was decisively broken, confirming the pattern.
This breakdown acts as the trigger for bearish entries, and we are now in the "Retest Phase", where price often pulls back to the neckline or a nearby trendline before continuing lower.
📐 Trendline Confluence – Retest Opportunity
A short-term descending trendline drawn from Top 2 intersects near the neckline zone.
Price is now approaching this confluence area, offering a potential high-probability short entry if bearish price action confirms (e.g., a rejection candle like a bearish engulfing or pin bar).
🎯 Price Targets & Trade Setup
Parameter Value
📍 Entry On bearish confirmation near neckline/trendline retest (~$105,300)
❌ Stop Loss (SL) Above recent swing high / Top 2 (~$107,100)
🎯 Target ~$97,126 (based on measured move from top to neckline projection)
⚖️ Risk:Reward Approx. 1:3 or better (depending on entry timing)
Measured Target Calculation:
Height from neckline to peak (~$107,000 - $103,500 = $3,500)
Target = Neckline break - height = ~$103,500 - $3,500 = $97,000–$97,100
🔥 Market Context & Psychological Edge
This chart structure reflects a shift in market sentiment. What was once strong bullish momentum is now hesitating — with buyers failing to make higher highs and sellers stepping in aggressively. The double top is not just a pattern, it's a narrative of exhaustion and reversal.
“Let price confirm your bias. Don't just predict; react to structure and behavior.”
Being patient and letting the retest play out is crucial. Don’t rush in early — let the market give you a clean signal. This is where technical discipline pays off.
⚠️ Risk Management Notes
Crypto markets are highly volatile — avoid oversized positions.
A failed double top can lead to a bullish continuation, so SL discipline is key.
Wait for confirmation — candlestick patterns, momentum shifts, or bearish volume spikes can add confidence.
📌 Summary
✅ Pattern: Double Top
✅ Confirmation: Neckline Break
🔄 Current Phase: Retesting Neckline/Trendline
📉 Bias: Bearish
🎯 Target: ~$97,100
❗ SL: Above Top 2
💬 What do you think? Are we headed to GETTEX:97K or is this just a fakeout? Drop your thoughts below and don’t forget to like and follow for more trade setups!

XAUUSD Double Top Breakdown & Target – Bearish Reversal in Play?In today’s analysis, we focus on Silver (XAG/USD) on the daily timeframe, which is currently presenting a high-probability bearish reversal setup. The price action has completed a Double Top pattern — a classic reversal formation — and has broken down below its neckline support, signaling a potential shift in momentum from bullish to bearish.
This chart setup is particularly valuable for swing traders, pattern traders, and anyone seeking to anticipate mid-term directional moves in the commodities market.
📐 Technical Breakdown:
🔷 1. Double Top Formation:
The Double Top pattern forms after a sustained uptrend and is identified by two peaks at nearly the same level.
In this case:
Top 1 formed near $35.5.
Top 2 retested the same zone but failed to break above.
The neckline support — drawn across the $28 zone — was eventually broken.
This price action confirms the classic M-shaped structure, signaling distribution and potential bearish continuation.
🔷 2. Neckline and Breakdown:
After failing at Top 2, price dropped below the neckline, breaking critical horizontal support.
This move completed the pattern, triggering many technical sell signals.
Price is now retesting the neckline zone, a common phenomenon where broken support becomes resistance (known as a "retest").
This retest offers a textbook short opportunity if bearish confirmation follows.
🔷 3. Curve Resistance:
The upper curved blue line represents dynamic resistance.
It has successfully capped price action across multiple attempts and aligns with the pattern's second top — enhancing the strength of this rejection area.
🧱 Support & Resistance Zones:
Resistance Zone: $34.50–$35.50
Strong resistance from both peaks (Top 1 & Top 2) and historical sellers.
Neckline / Retest Zone: ~$28.00
Now acting as resistance — this is the critical level to watch for rejection or breakout.
Support Zones / Take-Profit Levels:
TP1: ~$26.40 — aligns with recent horizontal structure and minor support.
TP2: ~$22.58 — matches major historical support and measured move projection from the Double Top pattern.
📉 Measured Move Target (Pattern Projection):
To calculate the target from a Double Top:
Measure the height from top to neckline.
Project that downward from the neckline’s breakout point.
In this case:
Height: ~$35.5 – $28 = $7.5
Breakdown point: $28 – $7.5 = Target near $20.5–22.5
The TP2 at $22.58 matches this logic — further validating the downside potential.
🔄 Market Psychology & Sentiment:
This pattern reflects a shift in sentiment:
Bulls tried and failed twice to push through resistance.
The eventual breakdown shows bearish conviction, and the ongoing retest represents a decision point.
If sellers hold this level, we could see a cascade of downside pressure as stops are triggered and momentum builds.
🛠️ Trade Setup & Scenarios:
📌 Scenario 1 – Bearish Continuation (High Probability):
If price fails to reclaim the neckline (now resistance) and forms bearish confirmation (e.g., engulfing candle, rejection wick, breakdown below $31), this confirms a likely move toward TP1 and TP2.
Entry Idea: Short on rejection from the $28–$29 zone
Stop-Loss: Above $30
TP1: $26.40
TP2: $22.58
📌 Scenario 2 – Invalidated Pattern:
If bulls push price back above the neckline ($29–$30 zone) with strong volume and daily close, this invalidates the setup and may lead to:
Bullish continuation toward $32–$34
Possible trend resumption if curve resistance breaks
🧠 Educational Notes:
Double Tops are most reliable when:
Formed at the top of strong uptrends.
Followed by a neckline break with volume.
Retested with rejection.
The retest phase is often the best risk/reward entry because:
It confirms resistance.
Offers clear invalidation levels.
Keeps your stop tight while targeting deeper moves.
📢 Final Thoughts:
Silver is currently at a critical technical juncture. The Double Top breakdown has played out, and now all eyes are on the retest. If bears defend the neckline, this setup provides a strong case for continued downside, offering a clean structure with well-defined targets.
⚠️ Risk Management is crucial — always manage your position size and respect invalidation zones.

XAUUSD Bearish Pennant Breakdown | Retest in Play – 3090 TargetGold (XAUUSD) has been in a corrective phase after reaching the resistance zone around 3370–3420 USD, where the price was previously rejected with strong selling pressure. Over the past sessions, price action has developed into a Bearish Pennant pattern, typically seen as a continuation pattern in a downtrend.
Following a sharp drop from the highs, the price consolidated between converging trendlines, creating lower highs and higher lows. This structure resembles a pennant or triangle formation, which traders often interpret as a pause before the next leg down.
🔍 Key Technical Features:
1. Resistance Zone (3370–3420 USD):
Strong institutional selling observed here.
Multiple rejections confirm this zone as a significant supply area.
This area also serves as a risk management reference point for stop-loss placement.
2. Support Zone (3210–3230 USD):
The price bounced multiple times from this level, making it a key demand area.
A clean break below this zone would confirm bearish continuation.
3. Trendline Resistance:
A descending trendline has been respected consistently since May 8.
Price recently retested this trendline after a minor pullback, aligning with the bearish pennant structure.
4. Bearish Pennant Pattern:
Forms after a strong downward impulse.
The consolidation is narrowing within converging trendlines.
A breakdown with high volume typically leads to a continuation of the prior trend.
5. Breakout & Retest:
Price has already broken below the pennant's lower boundary.
The current move is a retest of the broken trendline—a classic setup for entering a short position upon rejection.
🎯 Bearish Target Projection:
The measured move from the pole of the pennant suggests a target around 3090 USD.
This level is derived by taking the height of the initial drop before the pennant and projecting it downward from the breakout point.
🛑 Stop Loss Strategy:
A conservative stop loss can be placed just above the 3370 USD resistance zone.
Alternatively, a tighter stop could be placed slightly above the trendline (~3240–3250) for aggressive entries, though this increases the risk of a false breakout.
✅ Trading Plan Summary:
Aspect Level / Detail
Entry Zone After retest & rejection (near 3230–3240 USD)
Target 3090 USD
Stop Loss Above 3370 USD
Risk-Reward Approx. 1:3 or higher
Pattern Type Bearish Pennant
🧠 Final Thoughts:
This is a textbook bearish continuation setup with strong confluences:
Trendline resistance
Bearish pennant formation
Breakdown with retest
Clear resistance and support zones for managing risk
If momentum sustains to the downside after the retest, we could see a swift drop toward 3090 USD, offering a favorable shorting opportunity for swing and intraday traders alike.
Always confirm with volume and candlestick confirmation before execution. Stay updated with fundamental drivers such as CPI, PPI, or FOMC comments, which can inject volatility.

Will the EUR/USD find support and rally or give up it's run?In this video I go over EUR/USD, GBP/USD, USD/JPY, NVDA & SPX.
With an overall bearish outlook on the U.S. Dollar, I'm watching for support to hold above 1.1200 on the EUR/USD in order to continue the rally.
Although a pullback was expected after an aggressive up move over the span of 3 weeks, this will be interesting with a good amount of economic data set to release beginning on Tuesday.
We'll see if Bulls hold up or if Bears decide to show some strength.
As always, Good Luck & Trade Safe.

The Euro Bull sharpening it's horns against the USD?After further analysis on the weekly and monthly chart, I have identified what looks like a much larger broadening bottom pattern which signals the possibility of much further U.S. Dollar weakness.
Based on my previous video analysis, my original target for the EUR/USD was 1.2000 however 1.2500 – 1.3000 is not out of the question now. We haven’t traded in that price range since 2014.
In the immediate term, we could see a bullish acceleration if we begin trading cleanly above 1.1500.
I will expand on this analysis in my next upcoming weekly video.
Good Luck & Trade Safe.

Expecting more USD selling overall: Weekly Market PreviewIn this video I go over last week's epic volatility and what I am looking for going forward.
Long positions on EUR/USD at 1.0980 will remain in tact and still eyeing a target of 1.2000 out of the falling wedge displayed on both the monthly and quarterly charts.
I do expect some pullback after a massive move to the upside to end the week however, the bull can become relentless and continue it's strength due to the U.S. Dollar weakness across the board.
USD/JPY is another one I am watching and initiated a short position at 143.31 with a target at 133. If the large weekly broadening pattern runs it's course, I expect for that target to get hit.
Tech may get relief after Trump announced over the weekend that there will be exemptions but the market can remain irrational and continue overall weakness especially since the U.S. economy as a whole is not well.
Hope you enjoy the video and we'll see what we get this upcoming week, especially with Federal Reserve Powell set to speak on Wednesday.
As always, Good Luck & Trade Safe.

BTC/USD Forming Bullish Falling Wedge – Potential Target📐 2. Technical Pattern – Falling Wedge
A falling wedge forms when the price consolidates between two converging downward-sloping trendlines. It suggests diminishing selling pressure and a likely reversal.
Key Characteristics in This Chart:
Upper Resistance Trendline: Formed by connecting the series of lower highs.
Lower Support Trendline: Formed by connecting the lower lows.
The price respects both boundaries, confirming wedge structure.
Volume generally decreases during the wedge (implied but not shown).
✅ Bullish Implication: Once price breaks above the upper resistance, it often triggers a sharp upward move due to the squeeze of supply and the build-up of demand.
🧱 3. Support and Resistance Zones
🔻 Resistance Zone:
Area: ~100,000 to ~108,000 USD
Marked as a wide horizontal band (beige-shaded area).
Previous price peaks and consolidations suggest this zone is strong supply.
Breakout above this zone could trigger momentum towards the higher target.
🔹 Support Zone:
Area: ~72,000 to ~75,000 USD
Historical reaction level where buyers previously stepped in.
Coincides with the lower wedge boundary and recent bounce points.
Repeated tests strengthen this as a reliable accumulation zone.
🎯 4. Trade Setup Strategy
💼 Entry Strategy:
Trigger: A confirmed breakout above the wedge’s upper trendline (black diagonal line).
Confirmation: A strong bullish daily close above the trendline, ideally with volume spike.
The current price (~77,130) is near the lower boundary—offering a potential early entry or low-risk setup with a tight stop.
📌 Stop-Loss Placement:
Level: 70,916 USD
Below the wedge’s lower support and beneath the broader support zone.
Ensures exit if the pattern fails or bears regain control.
🧭 Target Projection:
Target Price: 114,562 USD
Based on the height of the wedge projected from the breakout point, a standard wedge breakout measurement.
Aligns with historical highs and psychological resistance.
🧮 Risk-Reward Ratio: Assuming entry around 77,130:
Risk (Stop-Loss): ~6,200 points
Reward (Target): ~37,432 points
R:R Ratio ≈ 1:6 – Highly favorable
⚙️ 5. Market Psychology & Price Action Insight
The falling wedge pattern suggests exhaustion of sellers.
Buyers are defending the support zone aggressively—creating higher lows within the wedge.
Each bounce is slightly more aggressive, indicating growing bullish sentiment.
A breakout from the wedge could act as a catalyst for rapid price acceleration as sidelined bulls enter and shorts cover.
📊 6. Summary of the Setup
Component Detail
Pattern Falling Wedge (Bullish)
Timeframe 1-Day Chart
Entry Point Breakout above upper trendline
Stop Loss 70,916 USD
Target 114,562 USD
Support Zone 72,000–75,000 USD
Resistance Zone 100,000–108,000 USD
Risk/Reward Approx. 1:6
Bias Bullish
📌 Final Thoughts
This setup provides a technically sound opportunity with clear invalidation (stop loss) and a well-defined profit target. The risk-to-reward ratio is attractive, and the price structure suggests a bullish reversal is likely, pending a confirmed breakout.

Cup & Handle Pattern on EUR/USD – Bullish Breakout Setup🏗️ 1. Pattern Structure Breakdown
🔵 Cup Formation:
The left side of the chart illustrates a steep decline beginning around mid-October 2024, forming the left lip of the cup.
The bottom of the cup was established between late December 2024 and early February 2025, where the market found a strong support level near 1.0220.
A rounded bottom formed, which indicates accumulation and decreasing bearish momentum.
The right side of the cup shows a strong bullish reversal from the support zone, gradually returning to the previous highs around 1.1050–1.1100, completing the cup shape.
⚫ Handle Formation:
A slight pullback or consolidation occurred after reaching the resistance zone, forming the handle between late March and early April 2025.
This handle appears as a small descending channel or flag, which is typical for this pattern.
Price remained above the support trendline, showing strength in the handle without breaking the overall bullish structure.
🔍 2. Key Technical Zones
📌 Resistance Level (Breakout Zone): 1.1050 – 1.1100
Marked by prior price rejection and the top of the cup.
The successful breakout above this zone confirms the cup and handle breakout.
📌 Support Level: 1.0220 – 1.0300
This zone provided a base during the cup’s rounding bottom and serves as a critical demand area.
📌 Stop Loss: 1.07380
Positioned below the recent swing low (handle low), providing a safe buffer.
This placement respects both market structure and risk management.
🎯 3. Target Projection
✅ Price Target: 1.14780
Based on the measured move technique:
Measure the depth of the cup (approx. 1.1100 - 1.0220 = 880 pips).
Project that distance above the breakout point (around 1.1050).
Target = 1.1050 + 0.0880 = 1.1930 (but a conservative target of 1.14780 is used here).
This target aligns with a previous resistance level from mid-2023, adding confluence.
📈 4. Trade Setup Summary
Component Description
Pattern Cup and Handle (Bullish Continuation)
Entry Point Breakout above 1.1050 resistance
Stop Loss Below 1.0738 (recent low)
Target 1.1478 (based on measured move)
Risk/Reward Ratio Approx. 1:2.5 or better
💡 5. Technical Insights and Confluence
Volume Consideration (if available): Typically, volume decreases during the cup and increases during the breakout. Although volume is not shown here, this pattern suggests accumulation.
Handle Behavior: The handle did not breach the mid-point of the cup, maintaining a strong bullish structure.
Market Sentiment: Given the steady incline and the bullish breakout, it suggests buyers are in control.
🏁 Conclusion
This is a textbook Cup and Handle breakout setup on the EUR/USD daily chart. The structure shows a clear transition from bearish to bullish sentiment, accumulation at support, and a confirmed breakout with strong potential upside.
It offers an excellent long opportunity with favorable risk-reward, clear invalidation, and a historically reliable price pattern.

Detailed Analysis of Silver (XAG/USD) – Double Top BreakoutThe chart represents a technical analysis of Silver (XAG/USD) on the daily timeframe (1D). A Double Top pattern, one of the most reliable bearish reversal formations, is developing. This signals a potential downtrend, with key price levels and trendlines confirming weakness in bullish momentum. Below is a full breakdown of the pattern, price action, and trading setup.
1️⃣ Pattern Formation: Double Top – Bearish Reversal
A Double Top pattern occurs when the price reaches a resistance level twice, failing to break higher. It indicates a shift from a bullish trend to a bearish one.
🔹 Characteristics of the Double Top in This Chart:
First Peak (Top 1 - Resistance at ~$34.57):
The price made a strong move upward, reaching a high near $34.57.
Selling pressure at this level pushed the price downward, forming a support level near $30 (Neckline).
Pullback & Temporary Support (~$30 Neckline):
Buyers stepped in at the support zone, causing a bounce back towards resistance.
This level acted as strong demand, preventing further decline temporarily.
Second Peak (Top 2 - Rejection at Resistance Again):
Price attempted to break above the previous peak but failed.
This failure to form a higher high confirms the presence of strong sellers.
The second rejection strengthens the resistance level at $34.57, signaling exhaustion in buying momentum.
Break of the Trendline Support (Bearish Shift):
A previously ascending trendline (black dashed line) was providing support for the uptrend.
Price broke below this trendline, indicating a possible trend reversal from bullish to bearish.
2️⃣ Key Technical Levels & Trading Setup
🔸 Resistance Zone (~$34.57 - Stop Loss Area)
This is the major resistance level, tested twice and confirmed as a supply zone.
A move above $34.57 would invalidate the bearish pattern, making this an ideal stop-loss level.
🔹 Support Level / Neckline (~$30 - Breakdown Confirmation)
The neckline acts as a critical level. If the price breaks below $30, the Double Top formation is confirmed.
If the price retests this level from below and rejects (fails to reclaim it as support), it becomes a strong short entry signal.
🔻 Target Price (Projected Move - $23.01)
The target is based on the measured move rule of a Double Top:
Distance from resistance ($34.57) to neckline ($30) ≈ $4.57.
Projecting this same distance downward gives a target of ~$23.01.
This aligns with historical demand zones, increasing the probability of price reaching this level.
3️⃣ Trading Plan: Short Setup Execution
🔽 Short Entry (Breakdown Confirmation Below $30)
Ideal entry point is after the neckline breaks and confirms resistance upon a retest.
A breakdown with strong volume enhances the validity of the setup.
🚨 Stop Loss Placement (Above $34.57 Resistance Level)
Placing a stop above the second peak ($34.57) ensures protection against invalidation.
If price moves back above this level, the pattern fails, indicating a potential return to bullish momentum.
🎯 Target Price ($23.01) – Measured Move Projection
The price target aligns with the pattern structure and historical support levels.
Traders can take partial profits at intermediary levels ($27–$26) before full target realization.
4️⃣ Additional Confirmation Factors – Confluence for Bearish Bias
1️⃣ Momentum Indicators: RSI & MACD Bearish Signals
If RSI (Relative Strength Index) drops below 50, it confirms weakening bullish momentum.
A MACD bearish crossover (signal line crossing below the MACD line) would further validate the downtrend.
2️⃣ Volume Analysis – Breakout Confirmation
A high volume breakout below $30 confirms selling pressure.
Low-volume breakdowns can lead to false breakouts, making volume a crucial factor to watch.
3️⃣ Fundamental Factors – Macro Outlook on Silver (XAG/USD)
Silver prices are influenced by interest rates, inflation, and USD strength.
If USD strengthens, silver could face more selling pressure, aligning with this bearish technical setup.
Any hawkish monetary policy statements could accelerate the downside movement.
5️⃣ Risk Management & Alternative Scenarios
✔️ Ideal Risk-Reward Ratio
Risk: Stop loss at $34.57 (~4.5% above entry)
Reward: Target at $23.01 (~23% move)
Risk-Reward Ratio: ~1:5 (highly favorable for short trades)
⚠️ Bullish Invalidations – When to Avoid the Trade?
If Silver reclaims $34.57 and holds above, the pattern fails.
A false breakout scenario could occur if price breaks below $30 but quickly moves back above.
Watching for bullish divergence on indicators like RSI before entering a short position is recommended.
Final Conclusion: Bearish Bias with Strong Downside Potential
📉 Summary of the Bearish Case:
✔️ Double Top pattern confirms a bearish reversal if the neckline breaks.
✔️ Break of ascending trendline signals increasing seller control.
✔️ Key levels: Stop-loss above $34.57 | Entry below $30 | Target $23.01.
✔️ Additional confluence: RSI, MACD, and volume confirmation strengthen the trade setup.
🚀 If price action aligns with this analysis, this setup presents a high-probability short opportunity.
Would you like any refinements or additional insights? 🔥

Bitcoin’s Next Move: Falling to $79K?This detailed technical analysis of Bitcoin (BTC/USD) on the 1-hour timeframe highlights a Rising Wedge pattern, key support and resistance levels, a trade setup, and projected price movements. The chart suggests a bearish breakdown, and traders can use this analysis to make informed decisions.
1. Understanding the Chart Pattern – Rising Wedge Formation
A Rising Wedge is a bearish reversal pattern that occurs when the price moves upwards within two converging trendlines. The slope of the lower trendline is steeper than the upper trendline, indicating weaker bullish momentum and an increasing probability of a downside breakdown.
📌 Key Observations:
The black solid trendlines outline the wedge pattern.
The price action remained inside this wedge from March 11 to March 26, 2025.
A breakdown has now occurred, confirming bearish momentum.
🔺 Why is this Bearish?
Rising Wedges are considered distribution patterns, meaning buyers are losing strength, and sellers are gradually taking control.
The price fails to make aggressive new highs and instead grinds upward weakly.
Once support is broken, a strong sell-off usually follows.
2. Key Chart Levels – Support & Resistance Zones
🔵 Resistance Level (Upper Bound of Wedge & Supply Zone)
The red arrow marks a strong rejection at $88,500 - $89,000, which acted as a major resistance level.
This zone has seen multiple failed breakout attempts, signaling that sellers dominate this area.
Stop-losses for short trades should be placed above this resistance zone.
🟢 Support Level (Lower Bound of Wedge & Demand Zone)
The wedge's lower boundary previously acted as strong support until it was breached.
The blue highlighted box represents a demand zone around $81,000, where buyers previously stepped in.
Losing this level could trigger a much stronger bearish move.
3. Breakdown Confirmation & Trading Setup
With the wedge broken to the downside, we now look for a confirmed bearish setup to enter a trade.
📉 Bearish Confirmation:
✅ The price broke below the wedge’s lower boundary, signaling a reversal.
✅ A retest of the broken wedge trendline confirms the breakdown.
✅ The price is now showing lower highs and lower lows, indicating a new bearish trend.
🎯 Trade Setup – How to Play This Move?
🔴 Entry for Short Position:
Enter short between $86,900 - $87,200 after confirming a rejection at the broken trendline.
🔵 Stop Loss:
Place a stop-loss above $89,282 to protect against a fakeout.
If BTC closes back inside the wedge, the short setup is invalidated.
🟢 Target 1: $81,000 – This is a key demand zone, and price might temporarily bounce here.
🟢 Target 2: $79,031 – This is the next strong support level, making it a final bearish target.
⚠ Risk Management Note:
Adjust position size based on risk tolerance.
Be mindful of short squeezes (where price temporarily spikes before continuing lower).
4. Expected Price Movement – Bearish Projection
🔮 The dashed black lines on the chart indicate a likely price pathway:
1️⃣ A breakdown below the wedge, followed by a minor retest of the broken trendline.
2️⃣ A continuation toward $81,000 (support level).
3️⃣ A small bounce before further decline.
4️⃣ The price reaching the final target of $79,031, where buyers may start accumulating again.
📌 If Bitcoin breaks below $81,000 with high volume, the bearish trend will likely accelerate.
5. Market Psychology & Trading Strategy
📌 Why This Setup Makes Sense?
The market exhibited exhaustion at the top of the wedge.
The break-and-retest confirms seller dominance.
The lower highs & lower lows show bearish momentum.
🚀 Alternative Bullish Scenario?
If BTC reclaims the wedge and breaks above $89,000, then the bearish setup is invalid.
A close above $89,500 would signal strong buying pressure and potential bullish continuation.
6. Conclusion – What to Watch Next?
🔎 Key Points to Monitor:
✔ Retest & rejection at $87,000 – $88,000 (confirming bearish momentum).
✔ Break of $81,000 to signal continuation toward the target.
✔ Stop-loss protection above $89,000 to manage risk.
📊 Final Thoughts:
The Rising Wedge breakdown suggests a shift from bullish to bearish sentiment.
This is a high-probability short trade with well-defined entry, stop-loss, and targets.
Traders should wait for price action confirmation before entering trades.
Would you like any refinements, or do you need further trade ideas? 🚀📉

GBP/USD Potential Bear Momentum...I couldn't resist the GBP/USD bear opportunity here displaying a broadening pattern.
I'm already in established shorts on the EUR/USD at 1.0891 but decided to jump in on GBP/USD at 1.2916 considering the price movements can be more pronounced.
Right now, my cap on whether this trade works or not is 1.3000. if we, for whatever reason, pop back up to 1.3000, I'd close this trade but for now, I think this trade looks good and will target 1.2750 however, using chart pattern percentages, I wouldn't be surprised to see 1.2600.
We'll see how this one looks going forward, especially with trump announcing more tariffs later today.
As always, Good Luck & Trade Safe.

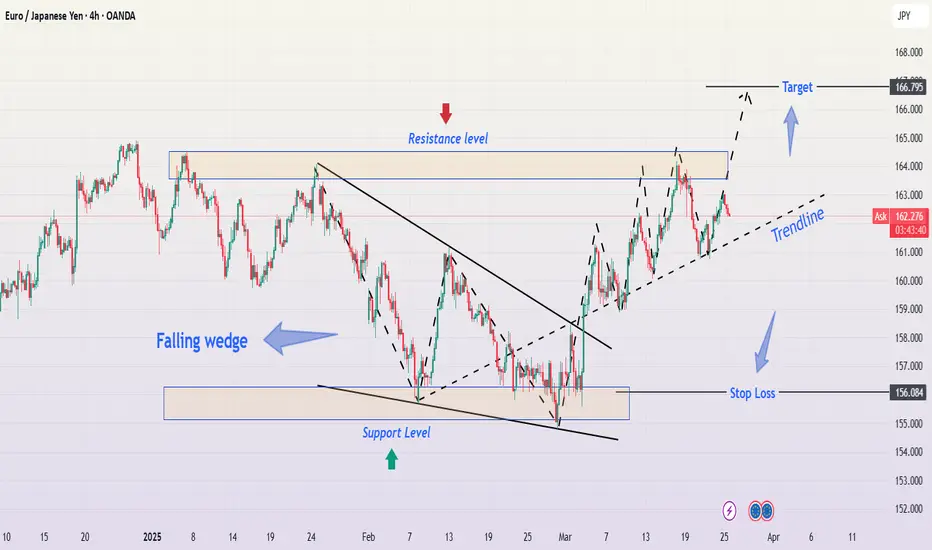
EUR/JPY Breakdown: Falling Wedge Breakout & Bullish SetupThe EUR/JPY 4-hour chart is presenting a well-structured price action setup, featuring a falling wedge breakout, a strong bullish trendline, and key resistance and support levels. This detailed analysis will walk through each aspect of the chart to provide a professional trading perspective.
1. Market Context & Price Action Overview
At the beginning of the chart, EUR/JPY was experiencing a downtrend, characterized by a series of lower highs and lower lows, forming a falling wedge pattern. This pattern is typically a bullish reversal signal, indicating that sellers are losing strength and buyers may take control.
Once the price reached a key support zone near 156.08, it bounced, leading to a breakout of the falling wedge. Since the breakout, the price has been moving in a bullish trend, forming higher highs and higher lows, respecting an ascending trendline.
2. Technical Patterns & Key Levels
🔹 Falling Wedge Pattern – Bullish Breakout
The falling wedge is identified by two converging trendlines sloping downward.
It indicates that bearish momentum is weakening as price compresses.
A breakout above the upper wedge line confirmed the shift in trend direction.
The breakout candle had strong bullish momentum, suggesting increased buyer interest.
🔹 Support and Resistance Levels
📉 Major Support Level (~156.08):
This level acted as a demand zone, where buyers aggressively stepped in.
The price formed multiple rejections at this level before breaking upwards.
A stop-loss placement below this level is ideal for bullish trades.
📈 Resistance Level (~163.50 - 164.00):
This zone has been tested multiple times as price approaches from below.
A break and retest of this resistance would confirm further bullish momentum.
If price faces strong rejection, a short-term pullback to the trendline may occur.
🎯 Final Target (~166.79):
This is the next major resistance level, aligning with previous swing highs.
It serves as a strong take-profit (TP) level for long positions.
If price reaches this level, we may see a consolidation phase or possible reversal.
3. Trend Analysis & Market Structure
📈 Bullish Trendline:
The price has been respecting an ascending trendline, acting as dynamic support.
This trendline connects higher lows, confirming a strong bullish trend.
As long as price stays above this line, buyers remain in control.
📊 Market Structure:
Since breaking out from the falling wedge, the price is forming a classic bullish structure of higher highs and higher lows.
This indicates sustained buyer pressure and a potential continuation toward resistance levels.
4. Trading Setup & Risk Management
📌 Entry Strategy:
Aggressive Entry: After the wedge breakout with a tight stop-loss.
Conservative Entry: Wait for a pullback to the trendline support or a break and retest of resistance at 163.50 - 164.00.
🔻 Stop Loss Placement:
Below 156.08 (previous support zone) to protect against trend invalidation.
Alternatively, below the rising trendline for a dynamic SL approach.
🎯 Take Profit Targets:
TP1: 163.50 - 164.00 resistance zone (Partial profits).
TP2: 166.79 final target, aligning with historical resistance.
5. Market Outlook & Potential Scenarios
✅ Bullish Scenario (High Probability)
If price holds above the trendline and breaks 163.50 - 164.00, we expect a continuation towards 166.79.
The structure remains intact as long as higher highs and higher lows persist.
❌ Bearish Scenario (Low Probability, but Possible)
If price fails at resistance and breaks below the trendline, it could signal a deeper retracement.
A break below 156.08 would completely invalidate the bullish setup, leading to a potential downtrend.
6. Summary & Key Takeaways
Trend Bias: Bullish, supported by a falling wedge breakout and higher highs.
Key Levels: Support at 156.08, resistance at 163.50 - 164.00, final target at 166.79.
Trading Strategy: Buy on retests of trendline or resistance breakouts.
Risk Management: Use dynamic stop-loss levels to minimize downside exposure.
🔹 Final Verdict:
If price remains above support and successfully breaks 163.50 - 164.00, a strong move toward 166.79 is expected. However, traders should remain cautious of trendline breakdowns and manage risk accordingly.
📊 Stay disciplined, follow your trading plan, and always use stop-loss protection! 🚀 #EURJPY #Forex #TradingStrategy #PriceAction