EURUSD wait for a bearish breakdown...EURUSD
The price made a bearish breakout of the contracting structure, the price is currently at the support area, if price manages to break below the support area If price stays below support/resistance structure I expect the price to move lower..
Trade Wisely
*The content on this analysis is subject to change at any time without notice, and is provided for the sole purpose of assisting traders to make independent investment decisions.
Chartpatternanalysis

Decoding Market Patterns:10 Essential Price Patterns Every TradeIn the intricate world of trading, price patterns are the footprints left by market sentiment. Understanding these patterns is like deciphering a complex code, revealing insights into potential market movements. Today we will explore 10 essential price patterns every trader should recognize. Each pattern is a chapter in the dynamic story of market behavior, offering opportunities to identify trends, reversals, and strategic entry or exit points.
1. Bull Flag: The Flagbearer of Continuation
A Bull Flag is a continuation pattern, often seen in strong uptrends. It resembles a flagpole (the initial price spike) followed by a rectangular flag (consolidation phase). When the price breaks above the upper boundary of the flag, it signals a potential continuation of the uptrend.
2. Bear Flag: The Bearish Counterpart
The Bear Flag is the opposite of the Bull Flag. It appears in downtrends, with a flagpole representing the initial price drop followed by a consolidation period. When the price breaches the lower boundary of the flag, it indicates a potential continuation of the downtrend.
3. Head and Shoulders: The Classic Trend Reversal
The Head and Shoulders pattern is a powerful reversal indicator. It consists of three peaks – the central peak (head) is higher than the surrounding peaks (shoulders). When the price drops below the neckline (a line drawn through the lowest points of the shoulders), it suggests a potential trend reversal from bullish to bearish.
4. Inverse Head and Shoulders: The Bullish Resurgence
The Inverse Head and Shoulders pattern is the bullish counterpart of the Head and Shoulders. It occurs after a downtrend and indicates a potential reversal to an uptrend. The pattern consists of three troughs – the central trough (head) is lower than the surrounding troughs (shoulders). When the price rises above the neckline, it signals a potential shift from bearish to bullish.
The cool thing about chat patterns is that they are everywhere. You often see many different chart patterns on a singular chart, or smaller patterns that are a part of a larger pattern. The tricky part is finding them and appropriately identifying them.
5. Double Top: The Bearish Reversal Duo
A Double Top pattern occurs after an uptrend and signals a potential reversal. It consists of two peaks at nearly the same price level, indicating a struggle to push the price higher. When the price falls below the trough between the peaks, it suggests a possible shift from bullish to bearish.
6. Double Bottom: The Bullish Reversal Duo
The Double Bottom is the bullish counterpart of the Double Top. It occurs after a downtrend and signals a potential reversal to an uptrend. It consists of two troughs at nearly the same price level, indicating a struggle to push the price lower. When the price rises above the peak between the troughs, it suggests a potential shift from bearish to bullish.
7. Rising Wedge: The Rising Price Constrictor
A Rising Wedge is a bearish continuation or reversal pattern. It can form during a downtrend or in an uptrend where buying pressure becomes exhausted. The wedge is characterized by converging trend lines that slope upward. While the price may make higher highs and higher lows, the pattern tightens, indicating weakening momentum. When the price breaks below the lower trendline, it suggests a potential continuation of the downtrend or reversal of an uptrend.
Rising Wedge Reversal Example:
Rising Wedge Continuation Example:
8. Falling Wedge: The Falling Price Constrictor
The Falling Wedge is the bullish counterpart of the Rising Wedge. It forms during an uptrend or a downtrend, characterized by converging trend lines that slope downward. While the price may make lower highs and lower lows, the pattern tightens, indicating weakening selling pressure. When the price breaks above the upper trendline, it suggests a potential continuation of the uptrend.
Falling Wedge Continuation Example:
Falling Wedge Reversal Example:
9. Symmetrical Triangle: The Balance of Bulls and Bears
A Symmetrical Triangle is a neutral pattern that forms during a trend, indicating a period of consolidation. It is characterized by converging trend lines that slope in opposite directions. When the price breaks above the upper trendline, it signals a potential bullish move, and when it breaks below the lower trendline, it signals a potential bearish move.
10. Pennant: The Brief Consolidation Pause
A Pennant is a continuation pattern that forms after a strong price movement. It resembles a small symmetrical triangle, indicating a brief consolidation before the previous trend resumes. When the price breaks above the upper boundary, it suggests a potential bullish continuation, and when it breaks below the lower boundary, it suggests a potential bearish continuation.
Important Thing To Consider:
Price patterns are a tool that if practiced and executed properly can be a great asset for any trader. There are a few things that all traders should keep in mind when using price patterns to make trading decisions.
Context is critical: Price patterns don't exist in isolation; they occur within the context of larger market trends. It's essential to consider the prevailing market conditions, including the overall trend (bullish, bearish, or sideways), volume trends, and recent price action.
Confirmation is Key: While recognizing a price pattern is an important skill, relying solely on its formation might lead to premature or false trades. Traders should always wait for confirmation signals before taking action. Confirmation can come in the form of a price breakout above a pattern's resistance level, a significant increase in trading volume confirming the pattern's direction, or additional technical indicators aligning with the pattern's signal. Waiting for confirmation helps traders filter out false signals, reducing the risk of entering trades based solely on pattern
Risk management is paramount: No pattern, regardless of its historical accuracy, guarantees a profitable trade. Traders must always implement proper risk management strategies, including setting stop-loss orders and defining acceptable levels of risk per trade as a percentage of their trading capital. Risk management ensures that even if a trade based on a price pattern fails to materialize as expected, the impact on the trader's overall portfolio remains manageable.
Practice, practice, practice: Identifying price patterns is a skill that improves with practice and experience. Traders should dedicate time to studying historical charts, both in live markets and during backtesting. Regularly practicing pattern charting enhances the ability to spot patterns quickly and accurately. TradingView offers a great set of tools to help anyone get started by offering a full line of automated pattern recognition indicators for educational and research use. Utilizing these automated pattern recognition indicators is a great way to visualize patterns in the real world as patterns are often less clean than textbook examples.
Recognizing these price patterns equips traders with a valuable skill set for navigating a dynamic market. However, it's vital to remember that patterns, like pieces of a puzzle, offer meaningful insights when combined with other indicators and thorough analysis. No single pattern guarantees profits, and each should be evaluated within the context of the broader market conditions. By integrating pattern recognition into a holistic trading strategy, traders can unlock the door to more informed, confident, and strategic trading decisions. Happy trading!
Ben with LeafAlgo

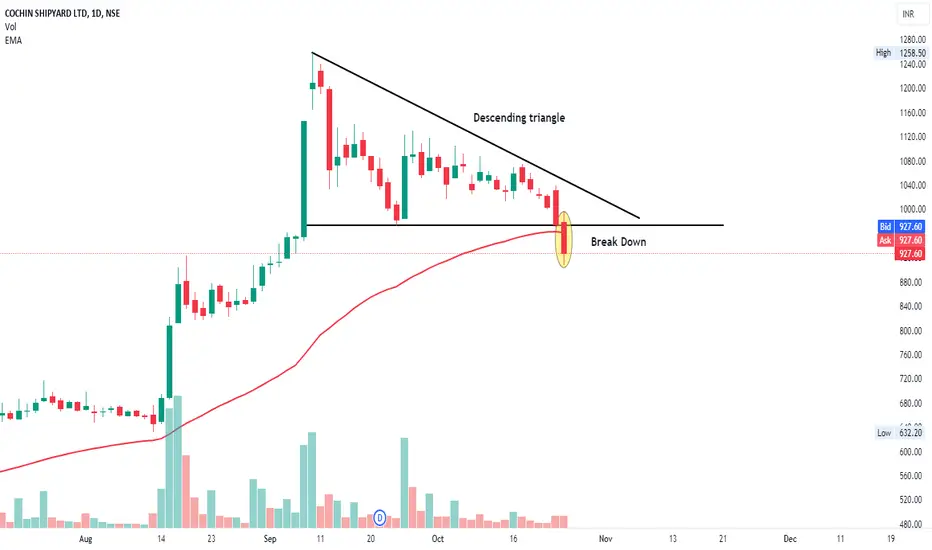
COCHINSHIP BREAK DOWNCOCHINSHIP BREAK DOWN
1. Descending triangle
2. Support Breakout
3.Below The 50EMA
Rising Wedge breakdown in ESCORTSESCORTS KUBOTA LTD
Key highlights: 💡⚡
✅On 1Day Time Frame Stock Showing Breakdown of Rising Wedge Pattern .
✅ Strong bearish Candlestick Form on this timeframe.
✅It can give movement up to the Breakdown target of 2555-.
✅Can Go short in this stock by placing a stop loss above 3468+.

Bullish Flag Pattern Reversal in ZEELZEE ENTERTAINMENT ENTERPRISES LTD
Key highlights: 💡⚡
📊On 1Day Time Frame Stock Showing Reversal of Bullish Flag Pattern.
📊 It can give movement upto the Reversal target of Above 275+.
📊There have chances of Breakout of Resistance level too.
📊 After Breakout of Resistance level this stock can gives strong upside rally upto above 390+.
📊 Can Go Short in this stock by placing stop loss below 240- or last swing Low.

[INTRADAY] #BANKNIFTY PE & CE Levels(06/10/2023) Today will be gap up opening in BANKNIFTY . After opening if banknifty sustain above 44050 level then possible upside rally of 400-500 points upto 44450 Level. And this rally can extend for another 400 points if it gives breakout of 44550 level. Any Major downside only expected in case banknifty starts trading below 43950 level.also possible Reversal Downside 44450 level.

Descending Triangle breakdown in JINDALSTELJINDAL STEEL & PWR
Key highlights: 💡⚡
✅On 1Hour Time Frame Stock Showing Breakdown of Descending Triangle Pattern .
✅ Strong bearish Candlestick Form on this timeframe.
✅It can give movement up to the Breakdown target of 645-.
✅Can Go short in this stock by placing a stop loss above 690+.

Falling Wedge Pattern Reversal in AMBUJACEMAMBUJA CEMENT LTD
Key highlights: 💡⚡
📊On 1Day Time Frame Stock Showing Reversal of Falling Wedge Pattern.
📊 It can give movement upto the Reversal target of Above 440+.
📊There have chances of Breakout of Resistance level too.
📊 After Breakout of Resistance level this stock can gives strong upside rally upto above 485+.
📊 Can Go Long in this stock by placing stop loss below 400- or last swing Low.

Ascending Triangle breakdown in CANFINHOMECANFIN HOMES LTD
Key highlights: 💡⚡
✅On 1Hour Time Frame Stock Showing Breakdown of Ascending Triangle Pattern .
✅ Strong bearish Candlestick Form on this timeframe.
✅It can give movement up to the Breakdown target of 736-.
✅Can Go short in this stock by placing a stop loss above 770+.

GOLD: If it fails, the bearish trend will return.We already shared our view on daily chart last week (see analysis below), so today we will look for some potential Patterns on intraday chart. Having said that, if we look at the 1H chart, we cannot exclude the formation of Inverted Head and Shoulders, if this fails, the Price Action should trigger a new Low and a return to the bearish trend also on daily chart. Today, we will only think about managing our long position taken last week and we will think about adding position only after some confirmations which we are currently missing.
With this in mind, the signal will be confirmed with neckline breakout.
DAILY ANALYSIS
(Click on Chart below)
Trade with care
Like | Share | Comment

[INTRADAY] #BANKNIFTY PE & CE Levels(07/09/2023) Today will be gap up opening in BANKNIFTY . After opening if banknifty sustain above 44550 level then possible upside rally of 400-500 points upto 44950 Level. And this rally can extend for another 400 points if it gives breakout of 45050 level. Any Major downside only expected in case banknifty starts trading below 44450 level.

50 give 80chart, attempting to overcome opposition.
50 served as a resistance level for this stock in 2016–2017, and it also served as a barrier in 2018 and 2021, when attempts to break through were unsuccessful.
completed the 2022 breakout but not maintained at level.
Currently, the level of 50 to 55 is where the stock is trying to breakthrough.
Stock has good news; therefore, buy it above the level of 55 and shoot towards 80.
As support for this stock, 40 to 45

EURJPYPrice for the first time reached a very old volume imbalance since the market crash of 2008.
Inside the V.E we have a 4H rsi divergence and two 4H balanced price points where i want to see price respect them if my short bias is correct.
Price forms a typical OHLC week with a creation of a bearish flag.
All these confluences lead to a short bias.

Falling wedge pattern breakout in GODREJPROPGODREJ PROPERTIES LTD
Key highlights: 💡⚡
✅On 1Hour Time Frame Stock Showing Breakout of Falling wedge Pattern.
✅ Strong Bullish Candlestick Form on this timeframe.
✅It can give movement up to the Breakout target of 1595+.
✅Can Go Long in this stock by placing a stop loss below 1515-.

Analysis for AUD/USD Read BelowBased on TA findings I am neutral on both bears and bulls as of now. With the EUR/USD major pumping up the ladder half of this week. Bringing major thoughts of question on whether the dollar is a stable as the FED claims. From all cross-references I am only finding bearish sentiment as of now on the daily and hourly chart timeframes. With a decent sized bearish engulfing candle formed on the daily side. I'm genuinely interested to see how things work out in the coming weeks. Will the bearish engulfing candle hang in there, or will the dollar become increasingly unstable and lead to a reversal in the near future? That is what I'm looking at as of now.
This is very minimal analysis as of now, when I get me EMA's setup again ill do a follow up post when I started to see what price action does and if price movement can shift.

Double Top pattern reversal in TVSMOTORS.TVS MOTORS CO
Key highlights: 💡
✅On 1 Hour Time Frame Stock Showing Reversal of Double Top Pattern.
✅ It can give movement upto the Reversal final target of below 1345-.
✅There have chances of breakdown of Support level too.
✅ After breakdown of Support level this stock can gives strong downside rally upto below 1290-.

COINBASE Victory lapCoinbase wins decision over SEC lawsuit pushing the stock here this is a big accomplishment and win for the company. With blackrock wanting to create a bitcoin ETF and coinbase being a potential part of that and Earnings coming up this can ROCKET!
Short term watching for a break out of the wedge and a 59% gain up to $100.
This stock was once at a high at $430

📊 The Adam & Eve Chart pattern📍 What is the Adam and Eve Chart Pattern?
In essence, Adam and Eve is a variation of double top and double bottom patterns and is only slightly different from the traditional double bottoms/tops. The pattern is marked by the first bottom or top, the Adam, then the price moves up or down and creates another U-shaped where we can see Eve.
📍 Adam and Eve Double Bottom
Adam and Eve double bottoms are formed in a downtrend and create two bottoms before the price moves upward – the first bottom is a shape of a V (Adam) a peak at the support line while the second bottom is in a shape of a U (Eve). Simply put, the Adam and Eve chart patterns indicate a strong price level that is unlikely to be broken, and hence, a shift in market sentiment.
Trading with the Adam and Eve pattern is super simple. All you have to do is to identify the pattern correctly and know the proper levels of when and where to enter and exit a trade.
📍 Key Takeaways
The Adam and Eve pattern is a variation of the double top and bottom chart pattern that signals the start of a new trend.
The bullish version of the pattern features a V-shaped first bottom called Adam, followed by a U-shaped consolidation phase forming Eve. The same applies to the bearish version.
The breakout trading strategy is recommended for trading with the pattern. Enter a trade when the price breaks above the resistance line or below the support line, with a stop loss at the neckline level.
Volume plays a crucial role in the Adam and Eve pattern as it confirms buying or selling pressure, providing a strong signal for a trend reversal.
👤 @QuantVue
📅 Daily Ideas about market update, psychology & indicators
❤️ If you appreciate our work, please like, comment and follow ❤️

Necklace Pattern-Electcast SteelAny Idea about this Stock? Guess What -
Huge Volume whooping 50M+ Accumulated by institutional buyers over last 3-6 months.
Strong resistance near 200 MA
200 MA Break out.
Silent for some weeks, eliminating weak hands!
Necklace completion at 101 level, CMP around 59
Guess the Move ahead!

BluetonaFX - GBPUSD Double Bottom Opportunity Hi Traders!
There is a potential double bottom pattern forming here on the GBPUSD 1H chart.
GBPUSD has had bearish momentum over the past 24 hours, and that momentum looks to have slowed down. A possible reason for this is that the market is near the 1.26909 support level, which we have highlighted on the chart. For the double bottom to form, this level must hold.
There was a big price rejection yesterday at 1.28436, which we have highlighted on the chart. From looking at the price action, there was a lot of volatility during that moment, so the traders may want to test that area again.
If the 1.26909 support level does not hold and there is a break below the level, the double bottom will fail, and we will look for further opportunities on the downside.
This is a good risk-reward trade, as there is a lot of upside potential if entry is near the 1.26909 area.
Please do not forget to like, comment and follow.
Thank you for your support.
BluetonaFX

BluetonaFX - GBPUSD Triangle OpportunityHi Traders!
There is a descending triangle setup here on the GBPUSD 1H chart.
This is a bearish setup, with the recent price action showing lower highs and lower lows. The support of the triangle is at 1.28038, and we are looking for a break and a close below 1.28038.
If we get this, then we are looking for a target at 1.27814, and below this, there is another target at 1.27678.
If we fail to break to the downside, then there are also opportunities to the upside. There was a previous price rejection at 1.28486, so the market might possibly target this level as a resistance test.
Please like, comment, and follow to support us, we greatly appreciate it.
Thank you for your support.
BluetonaFX

MRF - 240 MINS CHART TIMEFRAMEThe Structure looks good to us, waiting for this instrument to correct and then give us these opportunities as shown on this instrument (Price Chart).
Note: Its my view only and its for educational purpose only. Only who has got knowledge about this strategy, will understand what to be done on this setup. its purely based on my technical analysis only (strategies). we don't focus on the short term moves, we look for only for Bullish or Bearish Impulsive moves on the setups after a good price action is formed as per the strategy. we never get into corrective moves. because it will test our patience and also it will be a bullish or a bearish trap. and try trade the big moves.
we do not get into bullish or bearish traps. We anticipate and get into only big bullish or bearish moves (Impulsive Moves). Just ride the Bullish or Bearish Impulsive Move. Learn & Know the Complete Market Cycle.
Buy Low and Sell High Concept. Buy at Cheaper Price and Sell at Expensive Price.
Keep it simple, keep it Unique.
please keep your comments useful & respectful.
Thanks for your support....
Tradelikemee Academy

📈How to Trade: Rising Wedge Pattern📌 What is the Rising Wedge Pattern?
The rising wedge is a bearish chart pattern found at the end of an upward trend in financial markets. It suggests a potential reversal in the trend. It is the opposite of the bullish falling wedge pattern that occurs at the end of a downtrend. Traders recognize the rising wedge as a consolidation phase after a medium to long-term trend, indicating a decrease in momentum. Traders often use this pattern as a signal to take a short-selling position or exit their current position.
📊 How to Identify and Use the Rising Wedge
🔹 Identify an existing trend in a currency pair.
🔹 Draw support and resistance trend lines along with the highs and lows of the trend.
🔹 Wait for price consolidation and the contraction of the support and resistance lines, forming a rising wedge pattern.
🔹 Observe the upper trend line acting as resistance and the lower trend line acting as support, converging towards each other.
🔹 Place a sell order once the price breaks below the support line of the rising wedge pattern.
🔹 Set a stop-loss order at the same level as the support trend line to manage risk in case the price reverses.
🔹 Consider setting a profit target based on the distance between the highest and lowest points of the wedge pattern or by using a technical indicator or a previous support level as a reference.
💥 Key Takeaways:
🔸 The rising wedge is a technical chart pattern used to identify possible trend reversals.
🔸 The pattern appears as an upward-sloping price chart featuring two converging trendlines.
🔸 It is usually accompanied by decreasing trading volume.
🔸 A rising wedge is often considered a bearish chart pattern that indicates a potential breakout to the downside.
🔸 Wedges can either form in the rising or falling direction.
👤 @QuantVue
📅 Daily Ideas about market update, psychology & indicators
❤️ If you appreciate our work, please like, comment and follow ❤️
