AUDUSD Head & Shoulders PatternHi Traders!
A head-and-shoulders pattern is forming on the AUDUSD 1D chart.
Here are the details:
The market has found strong support at the 0.65255 level, which is the neckline. The right shoulder is currently forming, and we expect some consolidation around this level before a possible break and close below the neckline.
The plan here is to monitor both the neckline and right shoulder and wait for a confirmation signal before entry.
Preferred Direction: Sell
Technical Indicators: 20 EMA
Resistance: 0.66048
Support: 0.65255
Please make sure to click on the like/boost button 🚀 as your support greatly helps.
Trade safely and responsibly.
BluetonaFX
Chartpatterntrading

🪓⤵️⤵️( EURUSD short analysis) signals)Technical analysis
Hello trader's are you looking for a bearish analysis eurusd moving Up trand 1.65489
Fullback down trandline this week eurusd bearish moving
DXY INDEX ☝️💪 104.000
Entry 1.65489
Tp. 1.63150
Tp. 1.61268
TVC:DXY FX:EURAUD
Safe trade ❤️😊 plaes like ❣️ and comments 👍

MINDTECK IND - A reversal Trade with a swing opportunity 10-15%The stock is strong in all higher timeframes, strong consolidation in uptrend is happening for the last 10 weeks close to all time high levels.
It is now reversing from the base level of 226. Daily and weekly candles shows a price action of reversal.
RSI supportive.
ENtry - 235 - 240
Target - 270, 280,300.

GBPUSD Outlook 05 Feb 2024 Asia Session PEPPERSTONE:GBPUSD
GU price is massive down due to DXY Bullish new last Friday. Now GU is consolidation 1.26112 to 1.26450 Level. That is very good sign to again gain momentum in next week.
Based on my Analysis
BS: 1.26451 Level After Retest
SL: 1.26113
TP: 1.26728
TP2:1.27019
Disclaimer: Please be aware that this information is not provided as financial advice. It is crucial to conduct your research and due diligence before making any trading decisions. Financial markets can be highly volatile and involve risks, and the information provided here is for informational purposes only.

Symmetrical Triangle pattern breakout in POLYCABPOLYCAB INDIA LTD
Key highlights: 💡⚡
✅On 1Hour Time Frame Stock Showing Breakout of Symmetrical Triangle Pattern.
✅Strong Bullish Candlestick Form on this timeframe.
✅It can give movement up to the Breakout target of 4891+.
✅Can Go Long in this stock by placing a stop loss below 4200-.

#NIFTY Intraday Support and Resistance Levels -02/02/2024Nifty will be gap up opening in today's session. After opening nifty sustain above 21700 level and then possible upside rally up to 21810 level & this rally can extend another 100-120 points if market gives breakout 21830 level in today's session. in case nifty trades below 21670 level then the downside target can go up to the 21550 level.

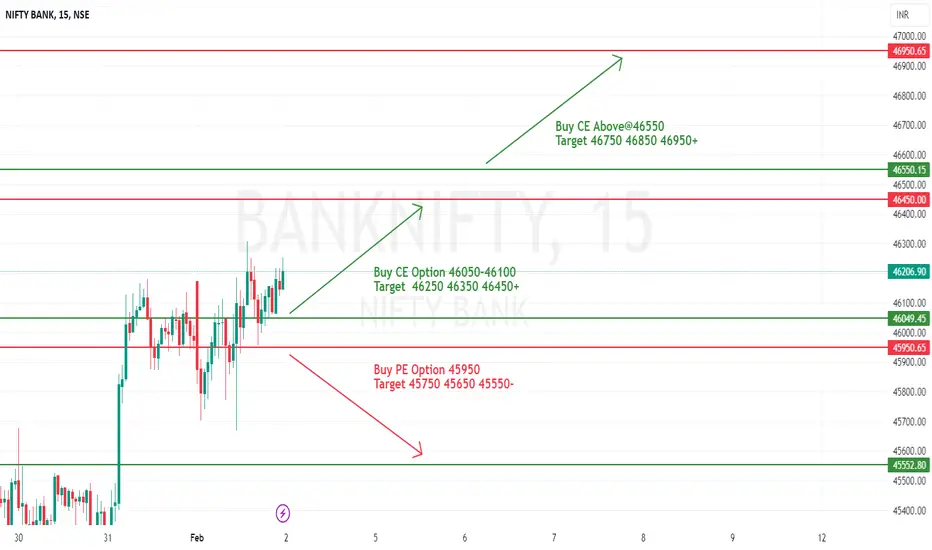
[INTRADAY] #BANKNIFTY PE & CE Levels(02/02/2024) Today will be gap up opening in BANKNIFTY. After opening if banknifty sustain above 46050 level then possible upside rally of 400-500 points upto 46450 level & this rally can extend another 400 points if market give breakout 46550 level.Any Major downside only expected in case banknifty starts trading below 45950 level.
GBPUSD Pressure Mounting On the Pound
Hi Traders!
A symmetrical triangle has formed on the GBPUSD 1D chart, and we could have a breakout soon as pressure is quickly mounting on the pound.
Here are the details:
The market has found support and resistance at both the trendline support and trendline resistance of the triangle, as the market is looking for a direction. Looking at the price action, it looks bearish due to the market swings; the lows and highs are starting to get lower, and additionally, the market has broken and closed above the 20 EMA.
The fundamental news also supports our bearish view. Earlier today, the MPC Official Bank Rate Votes came out at 2-1-6 which was surprising and worse than expected. Traders will read this as uncertainty for the pound while the dollar continues to strengthen.
As long as the market is still below the 20 EMA, our view will remain bearish. We expect some more consolidation before a possible third attempt at the trendline resistance.
Preferred Direction: Sell
Technical Indicators: 20 EMA
Resistance: 1.27508
Support: 1.25965
Please make sure to click on the like/boost button 🚀 as your support greatly helps.
Trade safely and responsibly.
BluetonaFX

PAISALO - Poised to break all time high, for a swing of 25%The stock is in strong uptrend in all time frames - higher to daily and above.
The stock is in strong momentum based on RSI in D, W, M. All above 60.
Daily is reversing from a Higher low formation with double bottom and Morning star formation.
One may consider an entry based on today's close candle, or even at cmp if aggressive.
Entry - 104/105
Target - 112 , 126, 136.
Trail profits after each target.

NZDUSD Ascending Triangle Possible BreakHi Traders!
An ascending triangle is forming on the NZDUSD 4H chart, and we could have a breakout soon.
Here are the details:
The market has found support and resistance at both the trendline support and trendline resistance of the triangle, as the market is looking for a direction. Looking at the price action, it looks bullish due to the market swings; the lows and highs are starting to get higher, and additionally, the market has broken and closed above the 20 EMA.
As long as the market is still above the 20 EMA, our view will remain bullish. We expect some more consolidation before a possible third attempt at the trendline resistance.
Preferred Direction: Buy
Technical Indicators: 20 EMA
Resistance: 0.61489
Support: 0.61186
Please make sure to click on the like/boost button 🚀 as your support greatly helps.
Trade safely and responsibly.
BluetonaFX

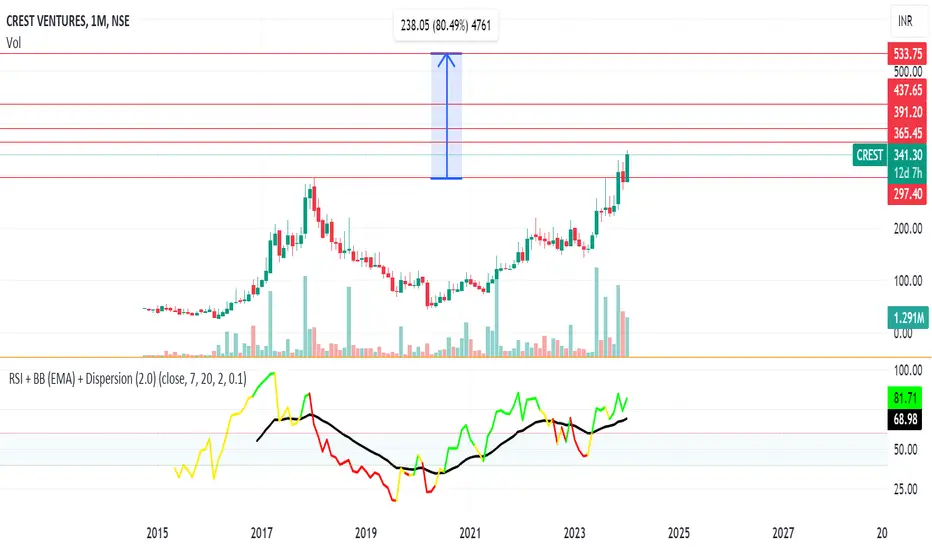
CREST VENTURES - Upto 50% ROI in the Mid to Long TermThe stock is about to break it's All time high, 5 year old BO in Monthly. --> Cup and handle - Rounding bottom.
It has been consolidating for the last 8 weeks, Monthly shows inside candle.
Daily shows good volume BO.
One can look for swing opportunity till 365. 7% ROI.
If there is a strong weekly close , one may enter on dips for ,
Target 1 - 365
Target 2 - 391
Target 3 - 437
Target 4 - 533
Reversal Broadening Wedge pattern in BATABATA INDIA LTD
Key highlights: 💡⚡
📈 On 1Day Time Frame Stock Showing Reversal of Broadening Wedge Pattern.
📈 It can give movement upto the Reversal Final target of Above 1645+.
📈 There have chances of breakout of Resistance level too.
📈 After breakout of Resistance level this stock can gives strong upside rally upto Above 1830+.
📈 Can Go Long in this stock by placing a stop loss Below 1378-.

EURUSD Possible Falling Wedge BreakHi Traders!
A falling wedge is forming on the EURUSD 4H chart, and we could have a breakout soon.
Here are the details:
The market has found support and resistance at both the trendline support and trendline resistance of the wedge, as the market is looking for a direction.
Looking at the price action, it looks bullish; we have had multiple tests at the trendline support and have broken above the 20 EMA. The market is currently on the trendline resistance, and we are looking for a break and a close above the trendline.
As long as the market stays above the 20 EMA, our view will remain bullish. We expect some more consolidation before a possible attempt at the trendline break.
Preferred Direction: Buy
Technical Indicators: 20 EMA
Resistance: 1.08501
Support: 1.07960
Please make sure to click on the like/boost button 🚀 as your support greatly helps.
Trade safely and responsibly.
BluetonaFX

Nifty: Supply and DemandOn 17th January, supply exceeded demand. So, the support line has been broken.
The time will prove, whether:
1) Nifty will retest this level and fall further.
or
2) Nifty will breakout this level and trade in the upward channel again.

TSLA: Last CHANCE to REACT! - D&W chartsTSLA shares are trying to react today, and this is something that could signal a recovery, which is understandable, given how much the price has fallen in recent weeks and how oversold the stock is at the moment.
Since the last top in December, the stock has plummeted almost 30%, breaking all its medium-term supports, materializing a downtrend. I say the price is oversold because the RSI is at an extremely low level, and the last time we saw an RSI below 20, in December 2022, the stock actually recovered after confirming a bottom in the price.
TSLA’s RSI analysis and comparison to December 2022:
However, the trend is still downwards, and although there is the possibility of a recovery, it won't be easy to reverse the trend. Remember that pullbacks are different from reversals.
For the price to reverse the downtrend, we would need to see HH/Hls again, as well as a break of the 21 EMA, which is clearly pointing downwards.
What's more, TSLA's price is on the verge of triggering a Death Cross when the 50MA crosses the 200MA downwards, one of the most famous bear market signals.
A continuation of the downtrend can be avoided if there is a strong and clear reaction as soon as possible, and now would be a good time, as the price has approached a support region on the weekly chart:
We are close to the support line of a bearish channel. Last week's candle could be a possible Exhaustion Bar, but the price needs to react and reject the last bearish candle by breaking through its high at $217.80. Only then will we see a good reaction that could halt the long-term downtrend, or even reverse it. For now, until such a scenario materializes, any recovery could be just another Dead Cat Bounce.
Remember that I’ll keep you updated on this, so consider supporting this idea if you liked it, and follow me for more analyses like this.
All the best,
Nathan.

Symmetrical Triangle on WTI @ D1This daily chart of the WTI crude oil (spot) demonstrates a symmetrical triangle pattern. I will use it for a trend continuation breakout setup. My potential entry is marked with the cyan line, which is located at 10% of the triangle's base width below the lower border. My take-profit will be at the green line, which is located at 100% of the triangle's base width below the lower border. I will set my stop-loss to the triangle's upper point (79.771). I will ignore bullish breakouts from this chart formation.

USDJPY (D) appears a bearish candlestick reversal signal.USDJPY (D) Continue to give a sell signal on frame H1
after frame D appears with a set of bearish candlesticks.
Sell now at: 147.617
Stop loss at: 147.947
Take profit 1 at: 146.811
Take profit 1 at: 145.74
Note: capital management 2%.

⬆️⬆️🚀(usdjpy bullish sentiment)Hello trader’s what do you think about USDJPY) ?
Traders are buying the tans Lines breakout now waiting retest fullback up ⬆️
Entry 143.999
Target 146.441
Target 149.799
safe trade ❤️💙 pales like 👍🏻 and comments 📝

Upside potential in UFOLooking very good at this moment to buy on weekly timeframe and daily timeframe also.
This is breakout opportunity as the stock broke the important resistance and also it's 200 EMA on weekly timeframe. And also a breakout of inside candle on daily timeframe. This stock can give you more Risk to reward ratio as the is only 12.5% and the reward that you can expect is around 100% approx.

XEM Looking Extremely BullishOn the Day Chart It's a no brainer
On the 15minute chart that i'm showing it's a bull flag
you can look at the stem of the bull flag to acquire a price target that hits at least 55% of the time in bull market scenarios

Double Bottom on EUR/USD @ H4This short-term double bottom chart pattern has formed on the H4 chart of EUR/USD following a clear downtrend. I will use this formation as a potential bullish entry. The two bottoms are marked on the chart. The neckline is marked with the upper yellow line. My potential entry level is at the cyan line. My potential take-profit level is at the green line. A stop-loss (not shown on the chart) will be set to the low of the breakout candle or to the low of the preceding candle should the breakout one appear mostly outside the pattern's borders. I will ignore short signals here.

[INTRADAY] #BANKNIFTY PE & CE Levels(24/01/2024) Today will be gap up opening in BANKNIFTY. After opening if banknifty sustain above 45050 level then possible upside rally of 400-500 points upto 45450 level.Any Major downside only expected in case banknifty starts trading below 44950 level.

NVDA: An Unstoppable Rally! How Far Will It Go? (D&W charts).NVDA shares are in a very strong uptrend, and since they broke the previous all-time high around $500 (yellow area), we have been navigating in unknown waters, since there are no more “previous tops” to act as resistance levels to guide us here. Since our previous study, NVDA has made many important movements, so let's update our idea. Remember, the link to my previous post is below this analysis, as usual.
In this case, there are a few things to remember that can help us. Firstly, the $ 600 is supposed to act as a resistance, not because it is a technical key point, but because it is a round number. More often than not, the market has a thing for round numbers, especially when it is making new highs, and apparently, NVDA is finding a resistance near the $600 (at least in the short-term).
Secondly, since NVDA broke the $500, it also triggered a Rectangle chart pattern seen on the weekly chart, as seen on the chart below:
The technical target of a Rectangle pattern is its height projected in the direction of the breakout (as evidenced by the red arrows). This takes is to the $626, approximately. Therefore, although NVDA is having a hard time breaking the psychological resistance at $600, in theory it still has more upside.
If this is a buy or not, it depends on your strategy and the time-frame you work, but I understand when I see people worried about it being overbought. If we use a few indicators, like RSI, we see that NVDA is around the 80s area, but there is a problem in determining whether a stock is overbought or oversold using only indicators.
On May 2023, NVDA went into overbought territory, as its RSI exploded and I saw many people worried about this. However, the price didn’t correct. In fact, it kept going up, while the RSI dropped, and this is one of the reasons why I don’t trade indicators – I trade price, but I use indicators sometimes as a tool to support my thesis, when I need more confirmation.
Therefore, as long as NVDA maintains the pattern on making higher highs/lows, trading above its support levels, the bull trend will persist. For now, there is no technical evidence, price action-wise, suggesting a pullback, and if a pullback occurs, we see many support levels to hold the price, as seen on the chart below, like the retracements, the 21 ema, and in the worst-case scenario, the $500 again.
I’ll keep you updated on this, so remember to follow me for more analysis like this, and like this idea to support me.
Best regards,
Nathan.
