[INTRADAY] #BANKNIFTY PE & CE Levels(23/01/2024) Today will be gap up opening in BANKNIFTY. After opening if banknifty sustain above 46050 level then possible upside rally of 400-500 points upto 46450 level & this rally can extend another 400 points if market gives breakout 46550 level.Any Major downside only expected in case banknifty starts trading below 45950 level.
Chartpatterntrading

BTC LongInitiating a BTC long position now reflects confidence in Bitcoin's current market conditions, anticipating upward price movement for potential gains. Risk management is essential for navigating market fluctuations effectively.

⤵️⤵️( EURUSD FULLBACK DOWN bearish sentiment)Hello trader’s what do you think about EURUSD) ?
traders are you looking 👀 dxy 3 . 100 eurusd fullback down selling zoon
Entry 1.9329
Target 1.07200
Sl 1.10207
Safe trade 💙❤️ pales like 👍🏻 and comments 📝

ICICIGI Up Move ExpectedIn ICICIGI an up move is expected till 1650. This stock has given a strong breakout and the breakout is also backed by huge volume. This stock can give you a return of around 195 point which is around 13.42 from 1454.85 and also a Risk to Reward Ratio of 1:4.42. You can definitely go for it but only after considering the risk first.
FOLLOW FOR MORE!!

⤵️⤵️( GBPUSD bearish sentiment analysis)Hello trader’s what do you think about GBPUSD) ? FX:GBPUSD
traders are doing a bearish flag gbpusd bearish momentum on this week fullback down 1.25327)
Entry Level 1.28375
Take profits 1.26595
Take profits 1.25014
safe trade 💙❤️ pales like 👍🏻 and comments 📝 FX:GBPUSD

🤹🏻♂️⤴️⤴️(AUDJPY) bullish sentiment channel)Hello trader’s what do you think about AUDJPY) ?
traders are you looking 👀 trandline hit fullback up ⬆️ my price points 96.519 wait down retest update you will )
Entry 96.519
Target 97.431
Target 97.799
Safe trade ❤️💙 pales like 👍🏻 and comments 📝

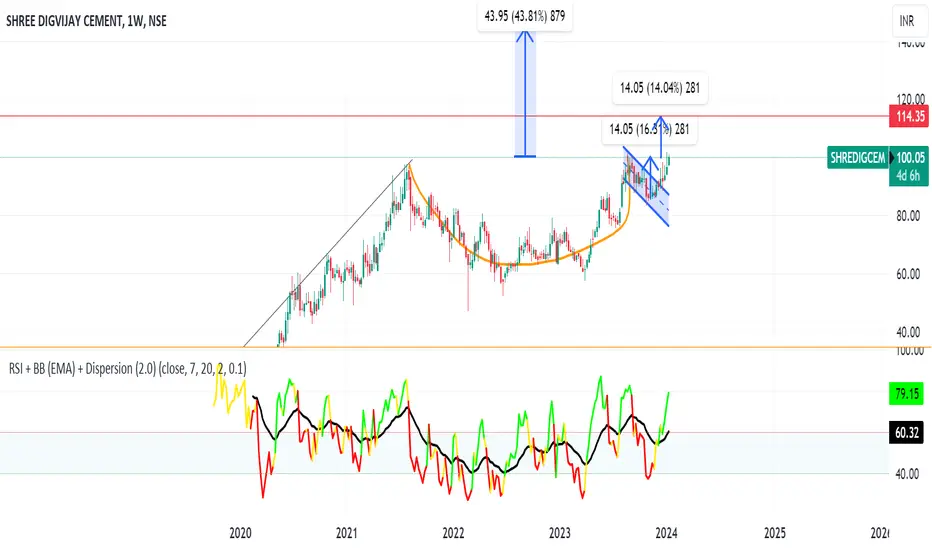
SHREEDIGICEM - Poised for a 10-15% upmove from cmp.The stock is breaking out of 2 year old consolidation, once can expect 40-50% ROI in short to mid term.
For Swing trade, one may look to enter at current price and trail profits post 114, 14-15% ROI.
The stock is in uptrend in all higher timeframes. The stock is clearly indicating cup and handle pattern in weekly.
⤴️⤴️( gold bullish momentum flag patterns) full back 2100) 🤹🏻Hello trader’s what do you think about gold) FXOPEN:XAUUSD
traders are you looking 👀 a fake breakout) 2011 ) gold price retest resistance level 2060) now gold price 2040 this week gold price hit
2100)
H4 time 🕰️ frame 🖼️
Entry price 2031)
Take profits 2064
Take profits 2081
Take profits 2103
safe trade 🙏❤️💙 pales like 👍🏻 and comments 📝

[INTRADAY] #BANKNIFTY PE & CE Levels(18/01/2024) Today will be gap down opening in BANKNIFTY. After opening if banknifty start trading below 45950 level then possible downside rally of 400-500 points upto 45550 Level in todays session.Any Major upside only expected in case banknifty starts trading above 46050 level to 46450 level.

GBPJPY Reversal TrendWe can see the completion of a rising wedge which is the reversal chart pattern, it giving us a selling chance after breaking below the trend line and retest it again. A lot of Market liquidity for short positions with the aim of pushing the price down to the resistance zone around 170.275 - 170.00

⤴️⤴️AUDUSD) bullish market sentiment analysis)Hello trader’s what do you think about Audusd)?
Audusd 4H tame frame 🖼️ bullish momentum in market sentiment and Trendlinien. I think 💭 Audusd retest support levels fullback up ⬆️
Entry 0.66627
Target 0.67906
Target 0.68819
safe trade 🙏🙏🩵❤️ pales like 👍🏻 and comments)

[INTRADAY] #BANKNIFTY PE & CE Levels(15/01/2024) Today will be gap up opening in BANKNIFTY. After opening if banknifty sustain above 47550 level then possible upside rally of 400-500 points upto 47950 level & this rally can extend another 400 points if market gives breakout 48050 level.Any Major downside only expected in case banknifty starts trading below 47450 level.also possible reversal downside 47950 level.

⤵️⤵️. GPBJPY)4H tame frame 🖼️ bearish momentum) analysis)Hello trader’s what do you think about GBPJPY) ?
Gpbjpy breakdown resistance levels fullback down 👇
Entry 183.710
Target 181.762
Target 178.322
safe trade 🙏🙏❤️🩵 Plaes like 👍🏻 and comments)

GBP USD TRADE SET UP GBP USD has formed a symmetrical triangle.
To get an entry we must wait for a break out of the pattern and a retest of the previous low that was created.
Your thoughts on GBP USD ?

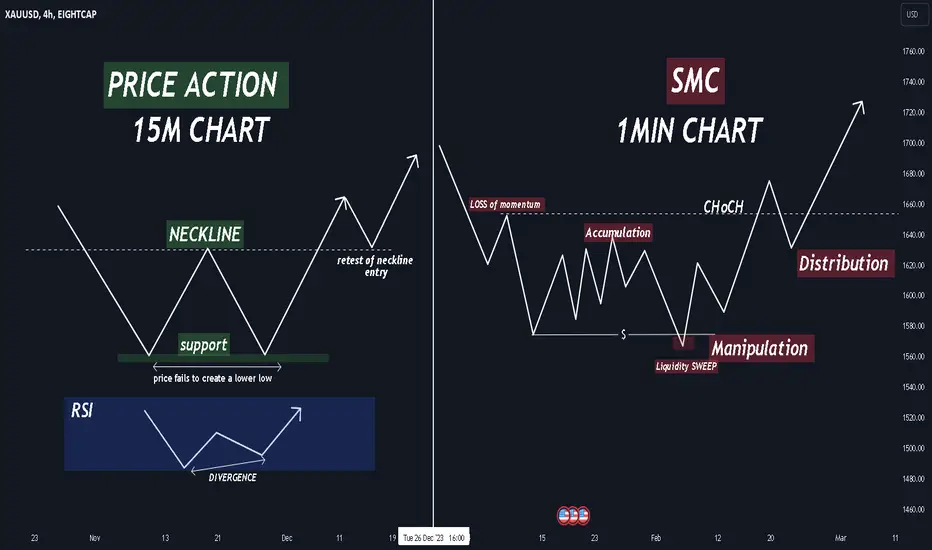
PRICE ACTION VS SMART MONEY CONCEPTS : the double bottomIn the world of technical analysis, the double bottom pattern holds a special place for traders. However, the way this pattern is interpreted can vary, especially when comparing the traditional price action approach with the more intricate Smart Money concepts.
Traditionally, a double bottom is identified by the formation of two distinct lows, approximately at the same price level, separated by a reaction high. Traders keen on price action look for a breakout above this reaction high as a signal for potential bullish momentum.
As a price action trader i was interested by the Smart money concepts approach so i decided to read about it a little bit and i found it pretty detailed after reading here are the differences that i noticed on the double bottom pattern.
GOLD|Important supply and demand areasHello friends, I hope you are doing well.
We have the gold chart in 1 hour.Currently, gold is fluctuating in a trending range area and we have the top and bottom of the trending range to enter trading positions.
CPI data will be released today, if we have data that is in favor of gold, that is, the US inflation has decreased, this means that it will harm the dollar index and gold can move upwards.
We should know that apart from the top of the trending range, which is a resistance, we have the next resistance in the area of (2046-2044) and after the resistance that is the base of the falling movement, it is around (2066-2064).
On the other hand, if inflation is published more than expected, it will benefit the dollar index and can create selling pressure on gold.
The area that currently maintains the price is the area (2016-2019). If this area is broken, the next support is the price range (2004-2008) and then the price range (1990-1995).
If the price reaches these areas, we can enter trading positions with confirmation

XAUUSD 1H think the market may break through the channel and retest the key resistance zones because the bears failed.

[INTRADAY] #BANKNIFTY PE & CE Levels(12/01/2024) Today will be gap up opening in BANKNIFTY. After opening if banknifty sustain above 47550 level then possible upside rally of 400-500 points upto 47950 level.Any Major downside only expected in case banknifty starts trading below 47450 level.

(happy 😃 Christmas 🎄 btc uSdt) bullish Moving up ⬆️)Hello trader’s what do you think about btc usdt)?
traders happy customers btc uSdt next move will up ⬆️ btc uSdt breakdown resistance levels )
Target 46k)⬆️
Target 48k)⬆️
Target 50k)⬆️
Target 52k)⬆️

Symmetrical Triangle on EUR/CHF @ H4The 4-hour chart of EUR/CHF is showing a a symmetrical triangle pattern. It can be used for a trend continuation breakout setup. My potential entry is marked with the cyan line, which is located at 10% of the triangle's base width below the lower border. My take-profit will be at the green line, which is located at 100% of the triangle's base width below the lower border. I will set my stop-loss to the triangle's upper angle (0.93490). I will ignore bullish breakouts from this trend-continuation formation.

XAUUASD1HThe price is trading within the descending channel. I expect gold may test the resistance, liquidity is in the area 2040-2050. and rollback and go down to retest the support level.
MY goal is the support level at 2020-2015

AUD USD TRADE SET UP AUD USD has broken out of a falling wedge pattern and closes above with 2 candle stick confirmation patterns
But there is USD News coming at NY session
Anyways i will keep holding my longs.

[INTRADAY] #BANKNIFTY PE & CE Levels (11/01/2024) Today will be gap up opening in BANKNIFTY. After opening if banknifty sustain above 47550 level then possible upside rally of 400-500 points upto 47950 level. Any Major downside only expected in case banknifty starts trading below 47450 level.
